Final Project: Design of an Electric Vehicle
Create a MATLAB model of electric car which uses a battery and a DC motor. Choose suitable blocks from Powertrain block set. Prepare a report about your model including following:
Objectives:
1. System level configurations
2. Model parameters
3. Results
4. Conclusion
Description of an Electric Vehicle
The electric vehicle (EV) is propelled by an electric motor, powered by rechargeable battery packs, rather than a gasoline engine.the major components are listed below
- An electric motor.
- A controller.
- A rechargeable battery.
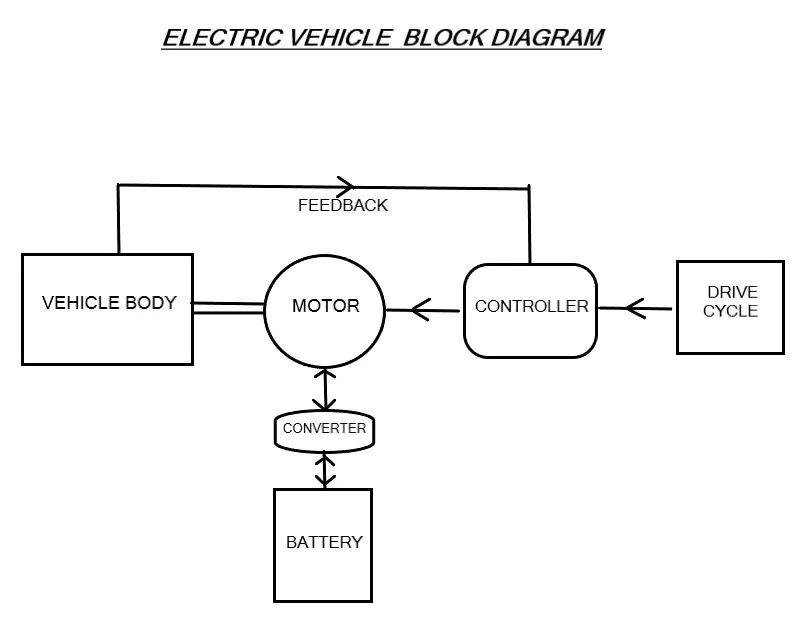
The electric motor takes power from a controller and the controller takes the power from a rechargeable battery(it may be lithium ion,lead acid). The electric vehicle operates on an electric/current principle. It uses a battery pack (batteries connected in series or parellel) to provide power to the electric motor. The motor then uses the power (voltage) received from the batteries to rotate a transmission and the transmission turns the wheels. There are Four main components of the electric vehicle: the potentiometer, batteries, direct current (DC) controller, and motor .
Description of Parts and their Functions
1.Potentiometer.
It is circular in shape and it is hooked to the accelerator pedal. The potentiometer, also called the variable resistor, provides the signal that tells the controller how much power is it supposed to deliver.
In our model we are going to use a special technique called pulse width modulation(PWM) because the voltage drop in potentiometer is much more than pwm and hence large amount of power losses happen in potentiometer.
Also we can use potentiometer in small application and pwm for heavey load applications.
Batteries. The batteries provide power to the controller. Three types of batteries: leadacid, lithium ion, and nickel-metal hydride batteries. Batteries range in voltage (power).we can use different types of battery and it depends on the requirement but in our case we are going to use lithium ion battery
DC Controller. (H-Bridge)
The controller takes power from the batteries and delivers it to the motor. The controller can deliver zero power (when the car is stopped),
And delivers full power (when the driver presses full accelerator pedal), or any power level in between. If the battery pack contains twelve 12-volt batteries, wired in series to create 144 volts, the controller takes in 144 volts direct current, and delivers it to the motor in a controlled way . The controller reads the setting of the accelerator pedal from the two potentiometers and regulates the power accordingly. If the accelerator pedal is 25 percent of the way down, the controller pulses the power so it is on 25 percent of the time and off 75 percent of the time. If the signals of both potentiometers are not equal, the controller will not operate. Motor. The motor receives power from the controller and turns a transmission. The transmission then turns the wheels, causing the vehicle to run.
H_Bridge
an H-bridge is a rather simple circuit, containing four switching element, with the load at the center, in an H-like configuration. The switching elements are usually bi-polar or FET transistors
In the Figure, above, the two transistors in the left are in complimentary pairs. Similarly the two trasistors in the right are complimentary pair. Complimentary pair means when one turns on, the other turns off, similarly when one turns off, the other turns on. A DC Motor has two terminals. When we apply a potential difference across the two, it will rotate in one direction. If we reverse the polarity, it will rotate in the opposite direction. To reverse a DC motor, you need to be able to reverse the direction of the current in the motor. The easiest way to do this is using an H-bridge circuit. Now lets take an example. Take a look at the Circuit shown below.
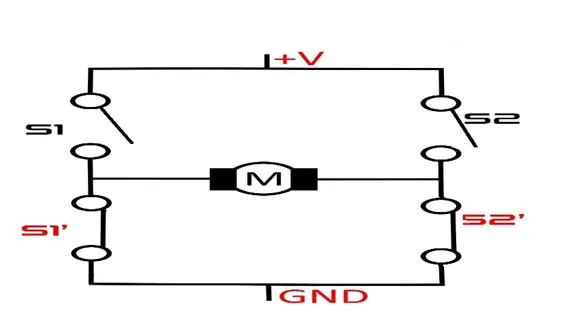
Here, S1′ is complement of S1 and S2′ is complement of S2. Now what happens when S1 and S2 are in the OFF state (Logic Zero)? S1′ and S2′ will be in the ON state but there wont be any closed path for the current to travel from +ve to gnd.
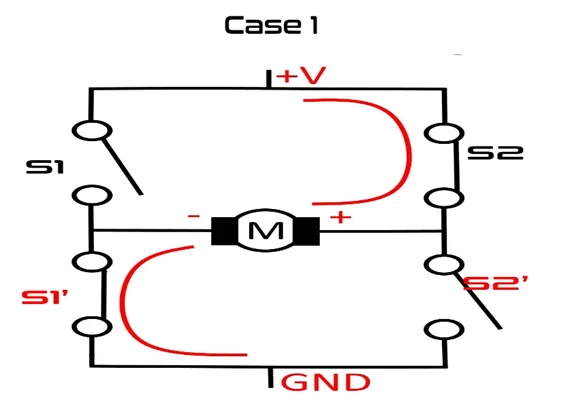
What if S1 is OFF and S2 is ON? S1′ Turns on and S2′ turns off. Since there is a closed path, the current flow from +ve terminal, S2, M, S1′ and to the GND. Here, the motor rotates in a particular direction, say clockwise.lets take a look in the below image
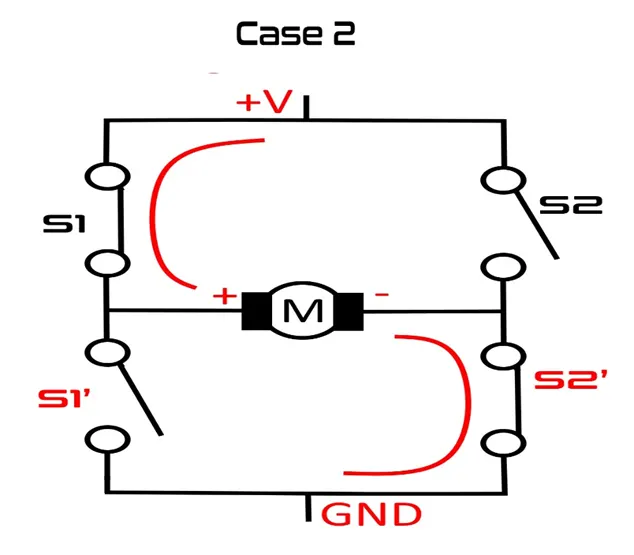
When S2 is OFF and S1 is ON? S2′ Turns ON and S1′ turns OFF. Here the current flows from +ve terminal, S1, M, S2′ and to the GND. Here, we noticed that the polarity at the terminals of the motor is reversed and the motor rotates in the opposite direction.
The Truthtable
S1 S2 S1′ S2′
1 1 0 0 No Rotation
0 1 1 0 Clockwise
1 0 0 1 Anti Clockwise
0 0 1 1 No Rotation
This is how we control the direction of DC motor Using H-Bridge
Theory of Operation for EV
When the driver steps on the pedal the potentiometer activates and provides the signal that tells the controller how much power it is supposed to deliver. There are two potentiometers for safety. The controller reads the setting of the accelerator pedal from the potentiometers, regulates the power accordingly, takes the power from the batteries and delivers it to the motor. The motor receives the power (voltage) from the controller and uses this power to rotate the transmission. The transmission then turns the wheels and causes the car to move forward or backward. If the driver floors the accelerator pedal, the controller delivers the full battery voltage to the motor. If the driver takes his/her foot off the accelerator, the controller delivers zero volts to the motor. For any setting in between, the controller chops the battery voltage, thousands of times per second to create an average voltage somewhere between 0 and full battery pack voltage.
MODULE 1
modeling of electric vehicle using simulink
simulink model of electric vehicle
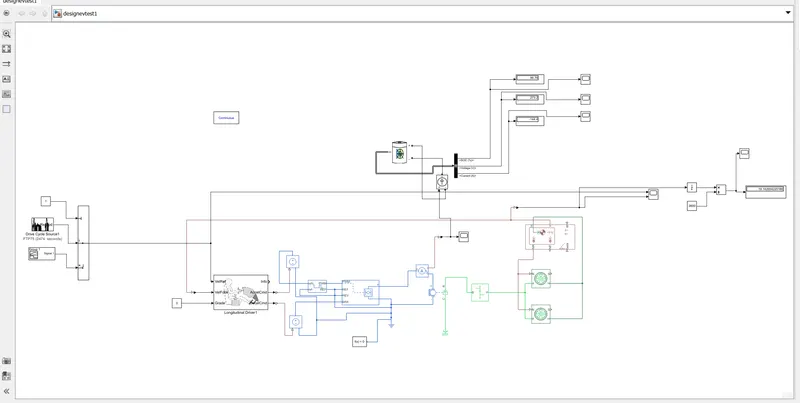
construction of simuliunk model and significance of parts
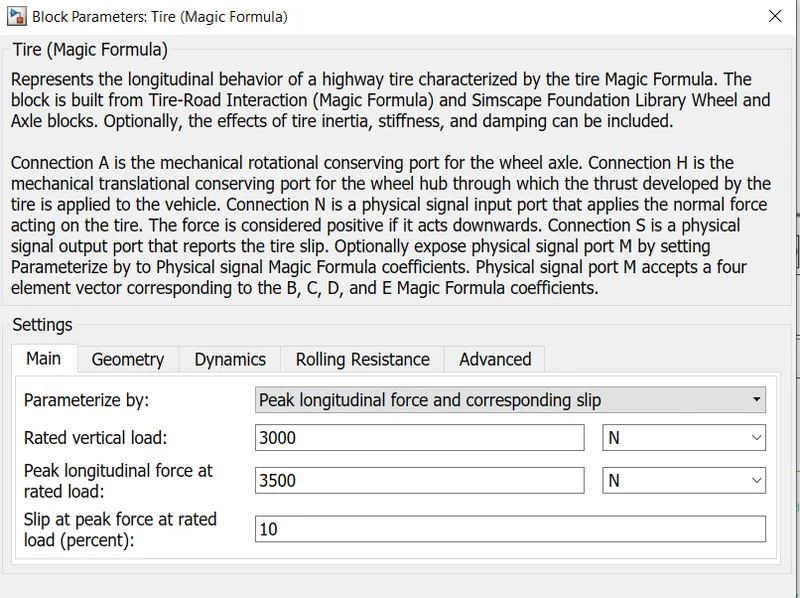
TIRE/WHEEL
The Tire (Magic Formula) block models the tire as a rigid wheel-tire combination in contact with the road and subject to slip. When torque is applied to the wheel axle, the tire pushes on the ground (while subject to contact friction) and transfers the resulting reaction as a force back on the wheel. This action pushes the wheel forward or backward. If we include the optional tire compliance, the tire also flexibly deforms under load.in our model we are using tires without compliance as it takes less time in simulation
vehicle body
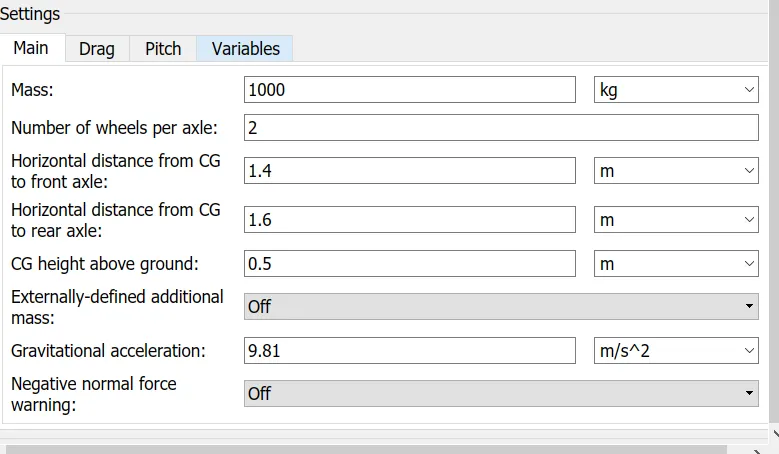
The Vehicle Body block represents a two-axle vehicle body in longitudinal motion. The vehicle can have the same or a different number of wheels on each axle. For example, two wheels on the front axle and one wheel on the rear axle. The vehicle wheels are assumed identical in size. The vehicle can also have a center of gravity (CG) that is at or below the plane of travel.
The block accounts for body mass, aerodynamic drag, road incline, and weight distribution between axles due to acceleration and road profile. Optionally include pitch and suspension dynamics. The vehicle does not move vertically relative to the ground
Connection H is the mechanical translational conserving port associated with the horizontal motion of the vehicle body. The resulting traction motion developed by tires should be connected to this port. Connections V, NF, and NR are physical signal output ports for vehicle velocity and front and rear normal wheel forces, respectively. Wheel forces are considered positive if acting downwards. Connections W and beta are physical signal input ports corresponding to headwind speed and road inclination angle, respectively. If variable mass is modeled, the physical signal input ports CG and M are exposed. CG accepts a two- element vector representing the x and y distance offsets from vehicle CG to additional load mass CG. M represents the additional mass. If both variable mass and pitch dynamics are included, the physical signal port J accepts the inertia of the additional mass about its own CG.
simple gear
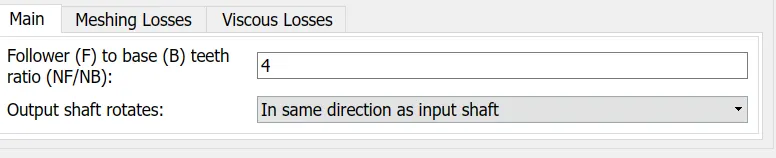
The Simple Gear block represents a gearbox that constrains the connected driveline axes of the base gear, B, and the follower gear, F, to corotate with a fixed ratio that you specify. wecan choose whether the follower axis rotates in the same direction or opposite direction as the base axis. If they rotate in the same direction, the angular velocity of the follower, ωF, and the angular velocity of the base, ωB, have the same sign. If they rotate in opposite directions, ωF and ωB have opposite signs. You can easily add and remove backlash, faults, and thermal effects.
Connections B (base) and F (follower) are mechanical rotational conserving ports. Specify the relation between base and follower rotation directions with the Output shaft rotates parameter. Optionally include thermal effects and expose thermal conserving port H by right-clicking on the block and selecting Simscape block choices to switch between variants.
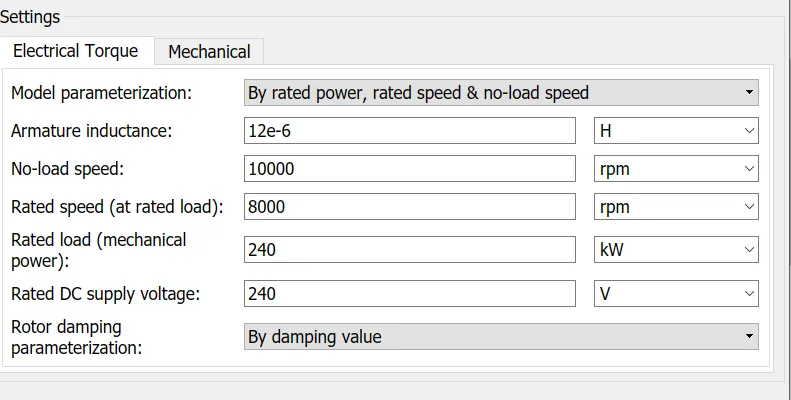
This block represents the electrical and torque characteristics of a DC motor.
The block assumes that no electromagnetic energy is lost, and hence the back-emf and torque constants have the same numerical value when in SI units. Motor parameters can either be specified directly, or derived from no-load speed and stall torque. If no information is available on armature inductance, this parameter can be set to some small non-zero value.
When a positive current flows from the electrical + to - ports, a positive torque acts from the mechanical C to R ports. Motor torque direction can be changed by altering the sign of the back-emf or torque constants.
current sensor:
When current flows through a conductor, it creates a proportional magnetic field around the conductor. ... The sensor then outputs a certain voltage or current that a meter connected to the sensor can read and translate into the amount of current flowing through the conductor
The above block represents an ideal current sensor, that is, a device that converts current measured in any electrical branch into a physical signal proportional to the current.
Connections + and - are conserving electrical ports through which the sensor is inserted into the circuit. Connection I is a physical signal port that outputs current value.
H-Bridge
The H-bridge block represents an H-bridge motor driver. The block has the following two Simulation mode options
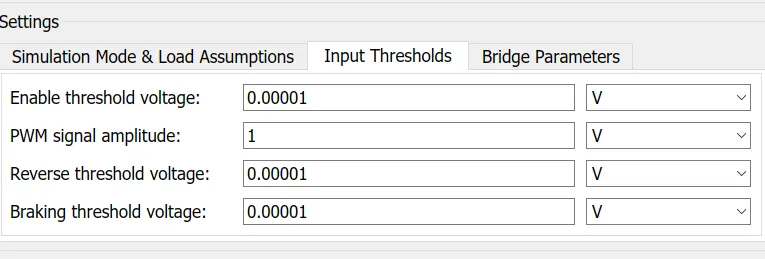
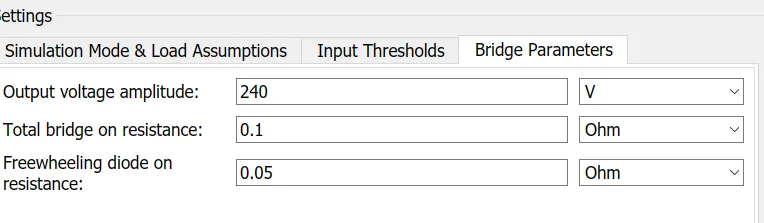
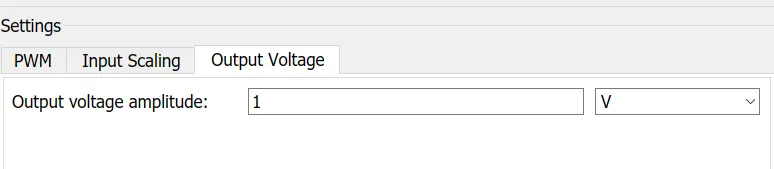
PWM -The H-bridge block output is a controlled voltage that depends on the input signal at the PWM port. If the input signal has a value greater than the Enable threshold voltage (0.0001)parameter value, the H-bridge block output is on and has a value equal to the value of the Output voltage amplitude(0.0001) parameter. If it has a value less than the Enable threshold voltage(0.0001) parameter value, the block maintains the load circuit using one of the following three Freewheeling mode options:
Via one semiconductor switch and one freewheeling diode
Via two freewheeling diodes
Via two semiconductor switches and one freewheeling diode
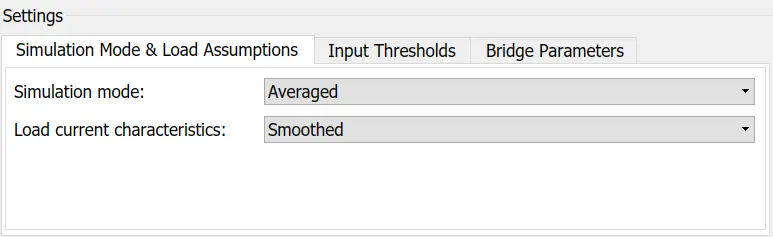
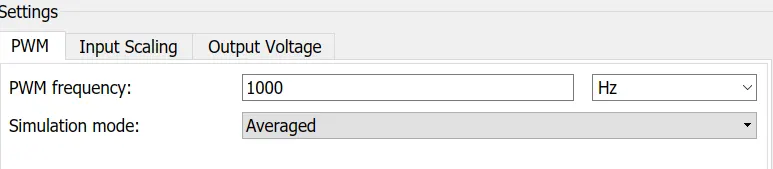
This block represents an H-bridge motor drive. The block can be driven by the Controlled PWM Voltage block in PWM or Averaged mode. In PWM mode, the motor is powered if the PWM port voltage is above the Enable threshold voltage(i.e 0.0001). In Averaged mode, the PWM port voltage divided by the PWM signal amplitude parameter defines the ratio of the on-time to the PWM period. Using this ratio and assumptions about the load, the block applies an average voltage to the load that achieves the correct average load current. The Simulation mode parameter value must be the same for the Controlled PWM Voltage and H-Bridge blocks.
If the REV port voltage is greater than the Reverse threshold voltage, then the output voltage polarity is reversed. If the BRK port voltage is greater than the Braking threshold voltage, then the output terminals are short circuited via one bridge arm in series with the parallel combination of a second bridge arm and a freewheeling diode.
Voltages at ports PWM, REV and BRK are defined relative to the REF port
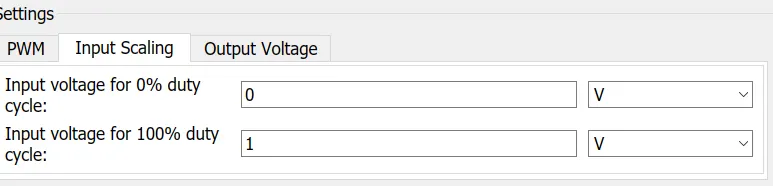
below are the parameters that we have set in the h bridge
PWM controller
The PWM control signals are square waves of high frequency, usually 25kHz or above, to make the noise from the fan above the audible human range. The PWM signal can start or stop the motor, depending on the high and low state of it. When the PWM signal is high, the motor runs, otherwise, the motor is stationary.
This block creates a Pulse-Width Modulated (PWM) voltage across the PWM and REF ports. The output voltage is zero when the pulse is low, and is equal to the Output voltage amplitude parameter when high. Duty cycle is set by the input value. Right-click the block and select Simscape->Block choices to switch between electrical +ref/-ref ports and PS input u to specify the input value.
At time zero, the pulse is initialized as high unless the duty cycle is set to zero or the Pulse delay time is greater than zero.
The Simulation mode can be set to PWM or Averaged. In PWM mode, the output is a PWM signal. In Averaged mode, the output is constant with value equal to the averaged PWM signal.
parameters
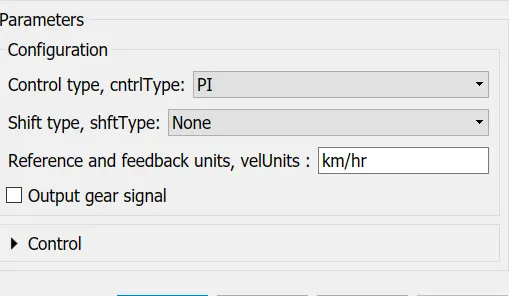
Longitudinal Driver
The Longitudinal Driver block implements a longitudinal speed-tracking controller. Based on reference and feedback velocities, the block generates normalized acceleration and braking commands that can vary from 0 through 1. You can use the block to model the dynamic response of a driver or to generate the commands necessary to track a longitudinal drive cycle.below is the representation of block
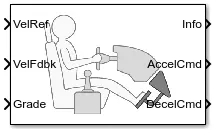
where velref =refrence velocity it takes inputs from the drive cycle or signal builder
velfdbk=feedback velocity this is the actual velocity that a vehicle have while in operation
grade =grade is the inclination of the vehicle ,if we increase the grade angle the motion of the vehicle is going down
battery
in our case we have used lithium ion battery and the capacity of this battery is 240v
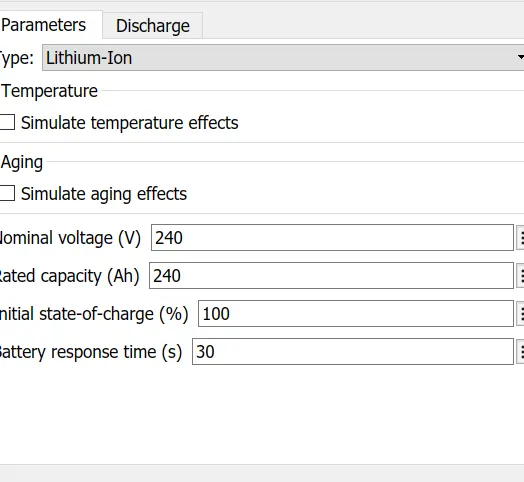
The Battery block implements a generic dynamic model that represents most popular types of rechargeable batteries.
Charge and Discharge Characteristics
The circuit parameters can be modified to represent a specific battery type and its discharge characteristics. A typical discharge curve consists of three sections.
The first section represents the exponential voltage drop when the battery is charged. The width of the drop depends on the battery type. The second section represents the charge that can be extracted from the battery until the voltage drops below the battery nominal voltage. Finally, the third section represents the total discharge of the battery, when the voltage drops rapidly.
When the battery current is negative, the battery recharges, following a charge characteristic.
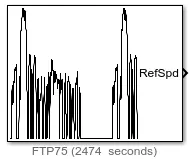
drive cycle
A drive cycle is typically represented by a series of data points which plots vehicle speed against time. Driving cycles are produced to assess the performance of vehicles in various ways, including fuel consumption and pollutant emissions.
we have used FTP75 driving cyce
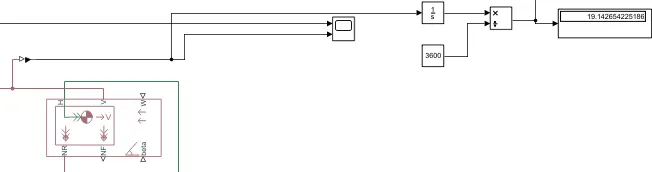
DISTANCE CALCULATION
in the below plot the actual velocity of vehicle has been intregated and converted it into kilometers a didplay has connected to show the numeric value of distance .
Model working
In our model we can give input signals to the longtidunal driver block in many ways but we have used drive cycle and signal builder in our model .controlled pwm device recives voltage from the controlled voltage source and converts it into input pulse signals with two switching action on and off and sends to power conveter.as we have used h_bridge power conveter .the H-bridge recives pulses that are modulated and thus provides required amount DC voltage to the motor.the DC motor which is under the control of H-bridge converts this electrical energy into mechanical rotation so we can say if more supply is drawn to motor the motor runs at high speed .thus the motor transmits the required torque to the wheel and the vehicle starts moving .once the motion is attained the vehicle is going to send the velocity signals to the longtidunal driver’s vehicle feedback port once this is process is complete we can compare our refrence signal with the vehicle speed to know the whether our vehicle follows the drive cycle data or not .after running the simulation we will know the the exact state of charge of the battery.
As we have used full H-bridge so forword braking forword motoring reverse braking and reverse motoring are possible.
RESULTS
Lets take a look on SoC ,Current and voltage
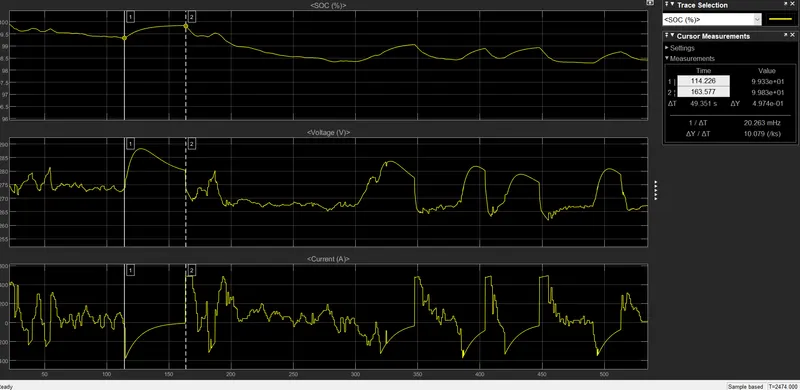
Fig.2 : graph between Soc,current,voltage
from the above results we can conclude that in just time t=49 sec regenrative braking is taking place in this period time the vehicle is decelerating and the battery is going to recharge for almost 50 seconds and charges upto 0.5 % .in the above plot lets take a look onto the 3rd graph(i-e current) the current is in the negative direction it means that our dc motor is running in the reverce direction.
output results of drive cycle and actual speed data
the graph between drive cycle data and actual speed is shown below
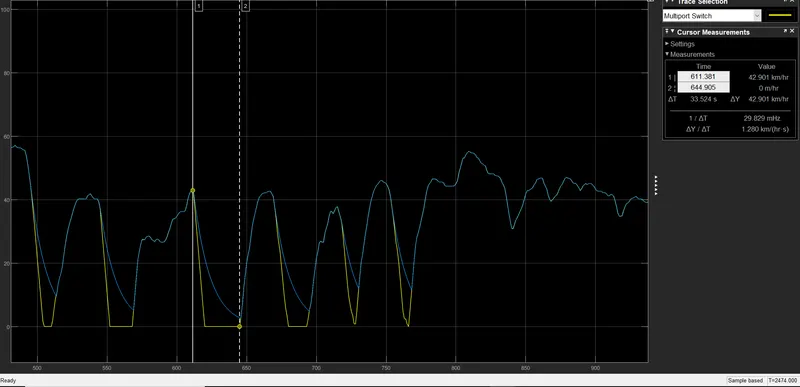
from the above plot the bule plot is the drive cycle plot and the yellow is the actual speed of the vehicle
from the measurement we have seen clearly at time (t=610s ) the vehicle speed matches the drive cycle data and the speed is almost 42km/hr after that brakes are applied and the vehicle decelrates and remains at rest for almost 40 seconds while the drive cycle is not taking rest ,in this way the actual speed of the vehicle is delayed the with the drive cycle data for almost 40 seconds.