Sensitivity Analysis
Introduction
We have a gri30 mechanism that contains 325 elementary reactions that could occur during combustion process. Using a sensitivity analysis, one can analyse how the sensitivity of each reaction is different for different parameters like temperature, pressure, concentration, etc.
This could be useful in practical applictions as one could tune the particular elementary reactions in a way to reduce some concentrations at outputs, or increase reaction rates.
Aim
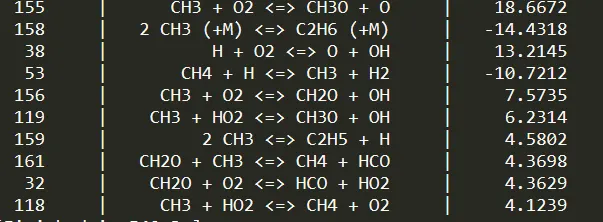
1. To write a Cantera program using python that identifies the 10 reactions most sensitive to temperature from the gri30 mechanicsm
Code
This code creates a basic reactor network that simulates the combustion process while considering elementary reactions.
This code can be used to get the sensitivity on N number of reactions in the gri mechanism.
import sys
import numpy as np
import cantera as ct
import numpy.matlib

import matplotlib.pyplot as plt
gas = ct.Solution('gri30.xml')

gas = ct.Solution('gri30.xml')
T_initial = 1500
P_intial = ct.one_atm

gas.TPX = T_initial,P_intial,{'CH4':1,'O2':2,'N2':7.52}
r = ct.IdealGasReactor(gas)
#help(r)
n = 324
rid = np.linspace(0,n,n+1)+1 #counts 325 reactions from 1 to 325

sim = ct.ReactorNet([r])
reactions_gri = gas.reaction_equations()
N = 10

#adding 325 gri sensitivity reactions
for i in range(n):
	r.add_sensitivity_reaction(i)

sim.rtol = 10e-6
sim.atol = 1e-15
sim.rtol_sensitivity = 10e-6
sim.atol_sensitivity = 10e-6

temp_senistivity_maxval = [0]*n
states = ct.SolutionArray(gas, extra = ['time_in_ms'])

for t in np.arange(0,2e-3,5e-6):
	sim.advance(t)
	states.append(r.thermo.state, time_in_ms = t*1e3)
	for j in range(n):
		temp_senistivity = sim.sensitivity('temperature',j)
		if abs(temp_senistivity) >= abs(temp_senistivity_maxval[j]):
			temp_senistivity_maxval[j] = temp_senistivity

'''
print(temp_senistivity_maxval)
print(j)
'''

#this section creates sorted lists from increasing to decreasing order of sensitivities
reactions_gri = [r for s,r in sorted(zip(np.abs(temp_senistivity_maxval),reactions_gri),reverse = True)]
rid = [r for s, r in sorted(zip(np.abs(temp_senistivity_maxval),rid),reverse = True)]
temp_senistivity_maxval = [temp_senistivity for abs_temp_senistivity, temp_senistivity in sorted(zip(np.abs(temp_senistivity_maxval),temp_senistivity_maxval),reverse = True)]

rplot = reactions_gri[0:N]
rid_plot = rid[0:N]
splot = temp_senistivity_maxval[0:N]


for k in range(N):
	print("%5d %5s %26s %5s %10.4f" % (rid_plot[k],'|', rplot[k],'|',splot[k]))


plt.subplot(2,2,1)
plt.plot(states.time_in_ms,states.T)
plt.xlabel('Time (ms)')
plt.ylabel('Temperature (K)')
plt.subplot(2,2,2)
plt.plot(states.time_in_ms,states.X[:,gas.species_index('OH')])
plt.xlabel('Time (ms)')
plt.ylabel('OH concentration')
plt.subplot(2,2,3)
plt.plot(states.time_in_ms,states.X[:,gas.species_index('H')])
plt.ylabel('H concentration')
plt.subplot(2,2,4)
plt.plot(states.time_in_ms,states.X[:,gas.species_index('CH4')])
plt.xlabel('Time (ms)')
plt.ylabel('CH4 concentration')


plt.show()
Output
The ten most sensitive reactions are:
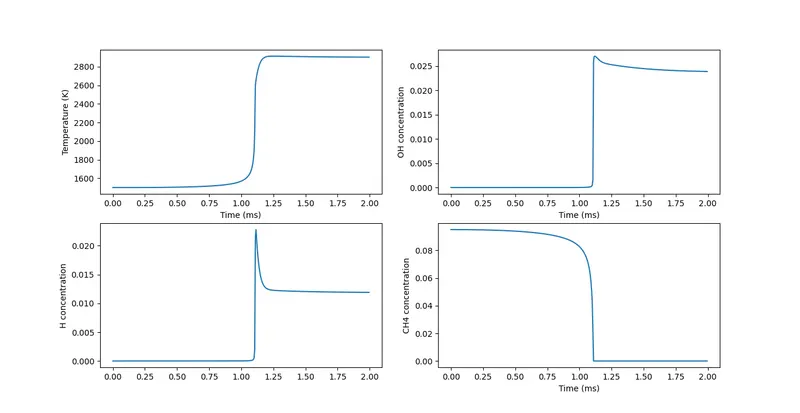
The above image shows the ignition delay, as well as how the concentration of certain species vary during the combustion process.