Gate Valve Parametric Study
Gate Valve Parametric Study
Introduction
A gate valve (also called sluice gate) is a valve that can obstruct or restrict the flow of fluid through a pipe. It can be completely opened, or it can completely be closed or be at intermediate positions, thus controlling different flow rates. Its application is to usually only either completely restrict, or offer vary resistance to flow through a pipe.
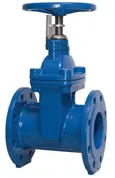
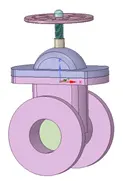
The above figures show a real gate valve, and the modelled one that has been used for this simulation.
In this project, a gate valve parametric study will be performed. A parametric study involves the varying of a certain dimension and observing how the output properties change. Here, the primary objective is that the valve is opened from 10% to 80% and the mass flow rate is observed. Concepts such as flow coefficient and flow factor will also be discussed.
Objectives
- To perform a parametric study on the gate valve simulation by setting the opening from 10% to 80%.
- To obtain the mass flow rates at the outlet for each design point.
- To calculate the flow coefficient and flow factor for each opening and plot the graph.
- To discuss the results of the mass flow rate and flow coefficient.
Geometry and Meshing approach
Using Ansys space claim, a cleanup of an imported gate valve is done. The gate disk is parameterized, and a fluid volume is extracted using the volume extract option.
Finally, using suppress for physics, all solid components are suppressed as they are not essential for the simulation.
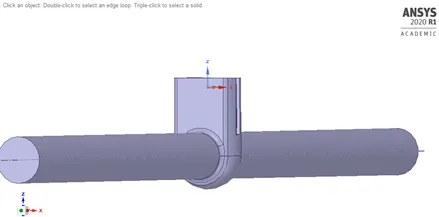
The fluid volume has also been extracted using the pull tool, to simulate pipe flow.
Gate disk paramterisation:
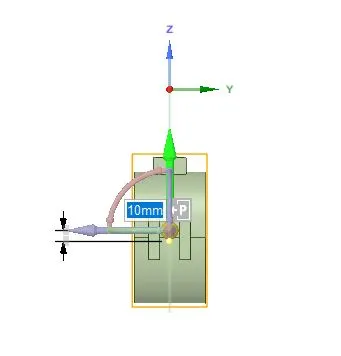
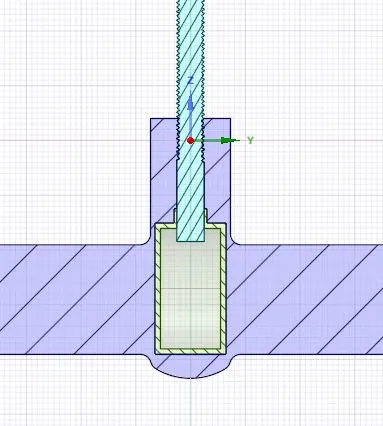
Final cut sectional view:
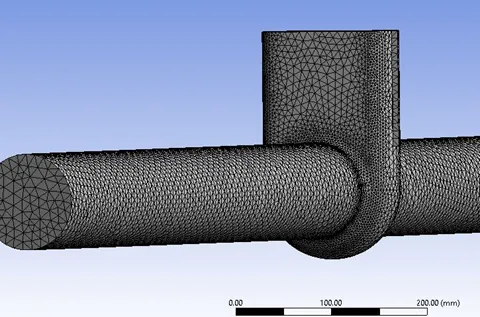
Mesh details:
|
Element size |
10 mm |
|
Number of Elements |
241,431 |
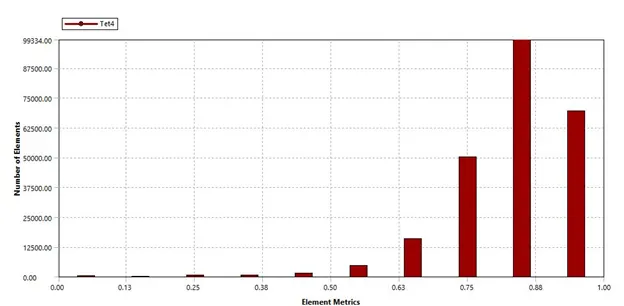
Element Quality:
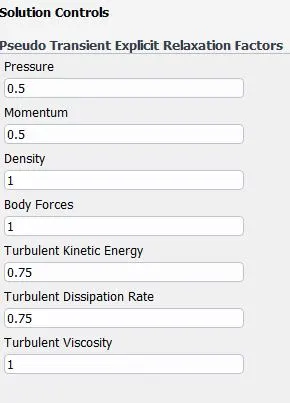
Processing approach
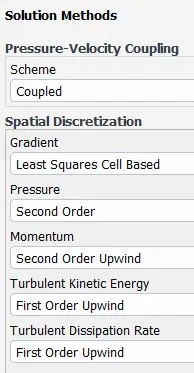
The following parameters have been used to perform the simulation in fluent
|
Solver |
Pressure-based |
|
Time |
Steady |
|
Gravity |
-9.81 m/s2 in Z direction |
|
Viscous Model |
K-epsilon, realizable, scalable wall functions |
|
Inlet- Pressure inlet |
10 Pascal |
|
Fluid |
Water |
Results
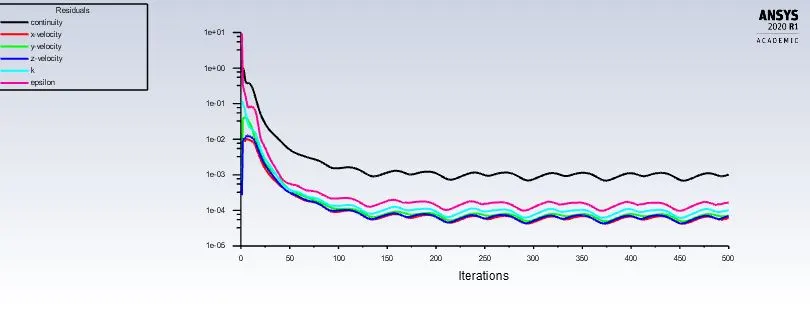
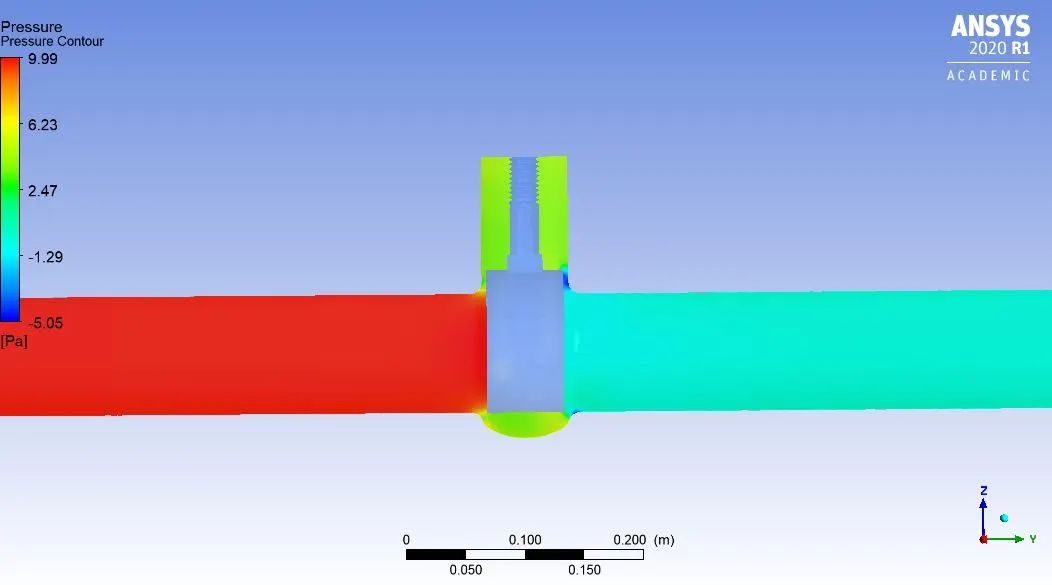
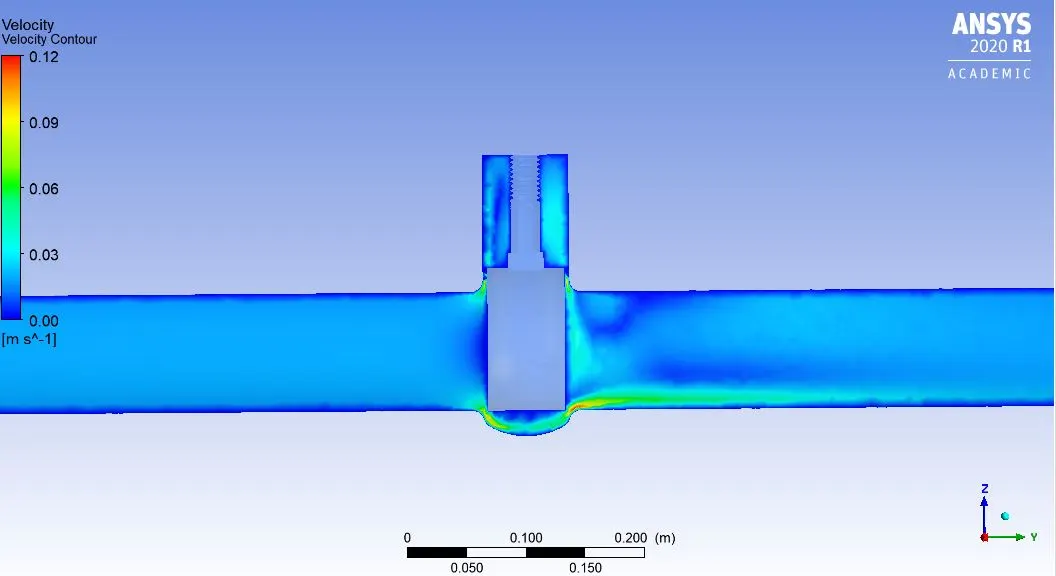
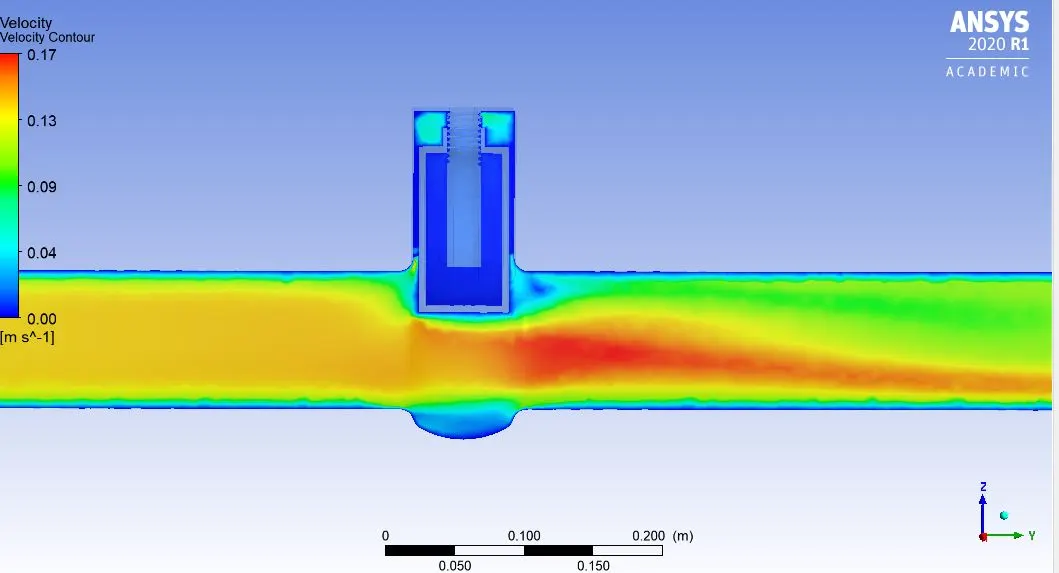
10 mm valve opening:
20 mm valve opening:
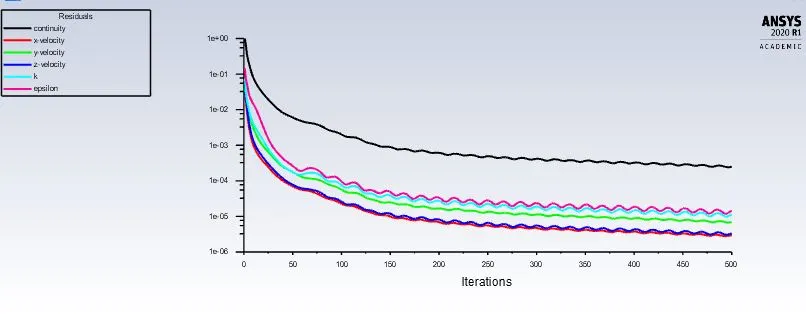
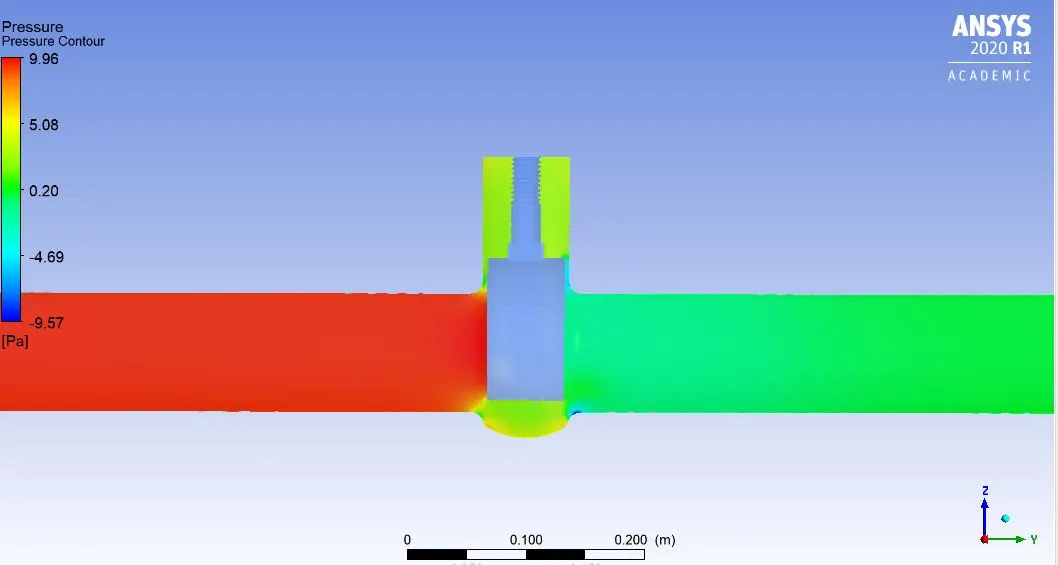
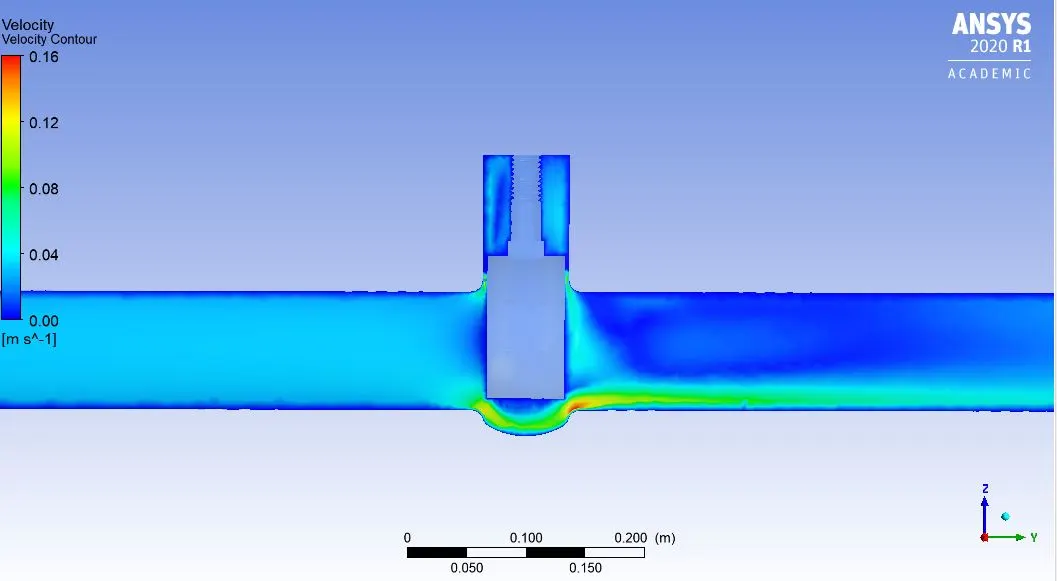
30 mm valve opening:
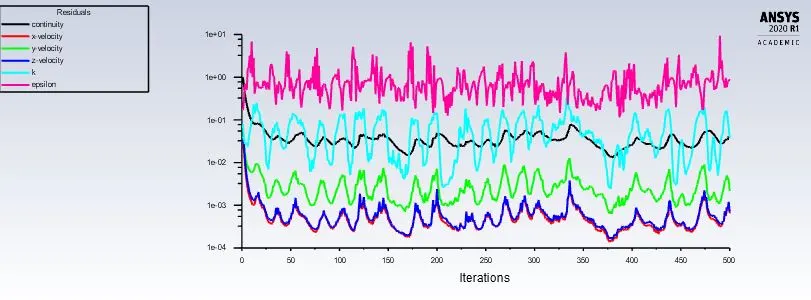
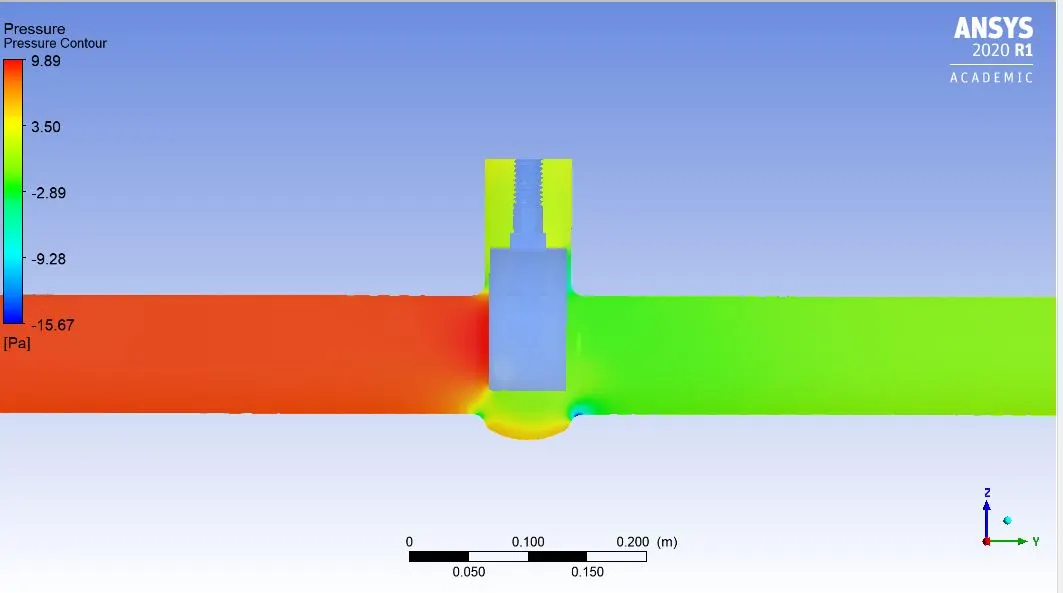
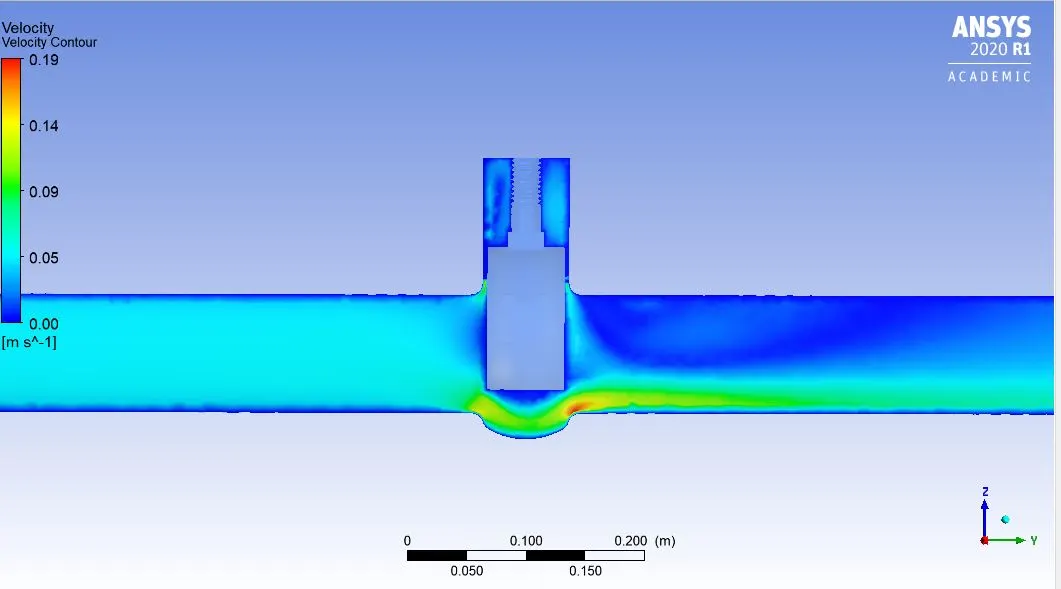
40 mm valve opening:
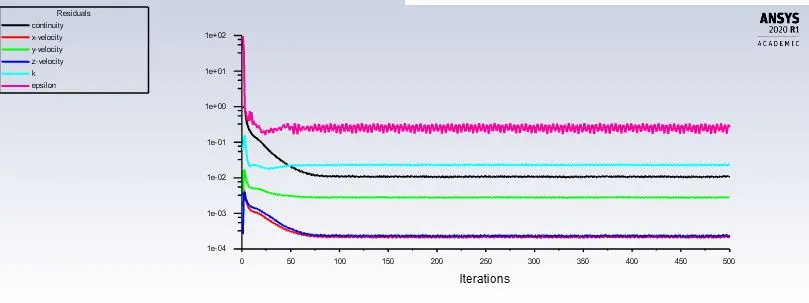
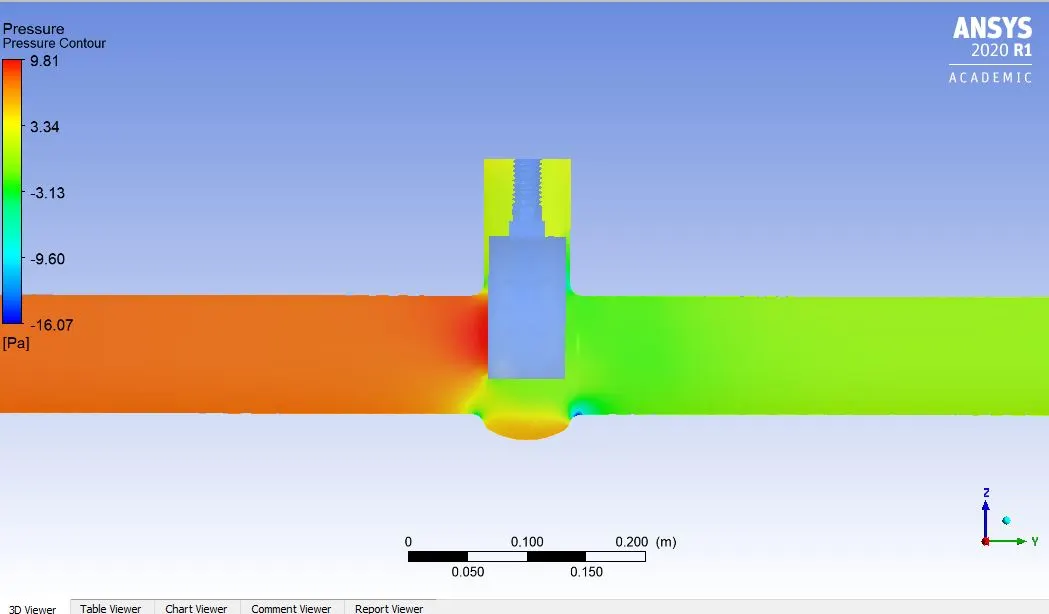
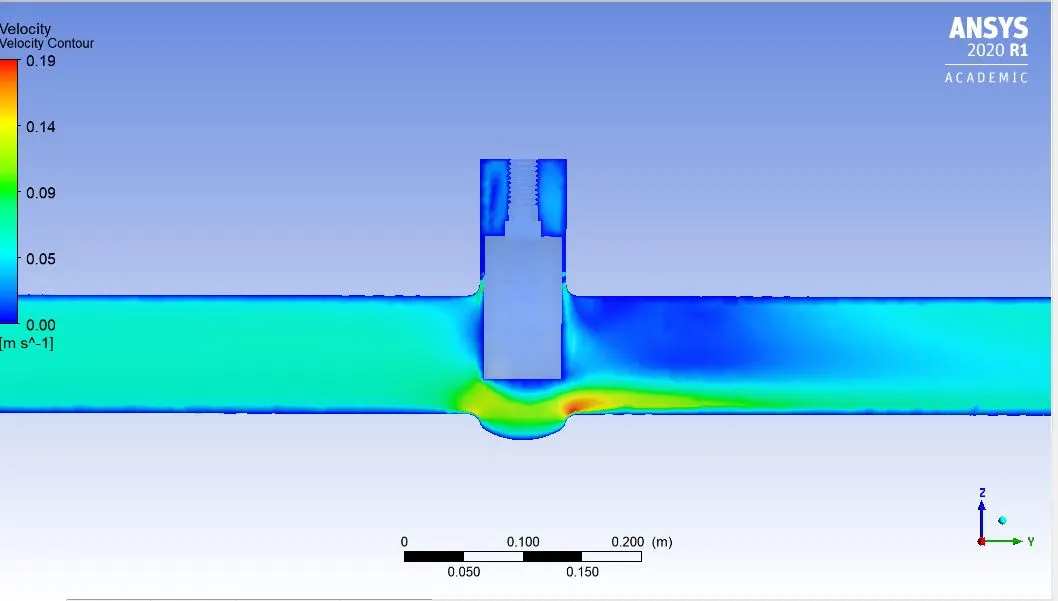
50 mm valve opening:
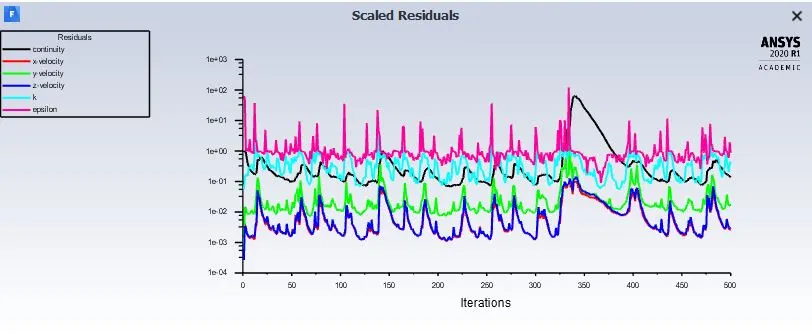
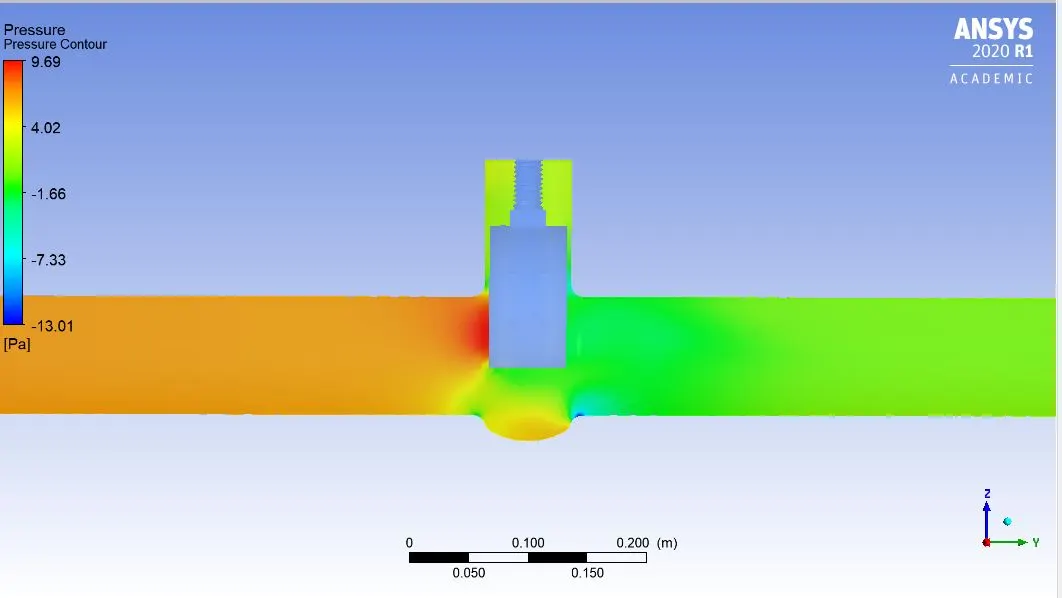
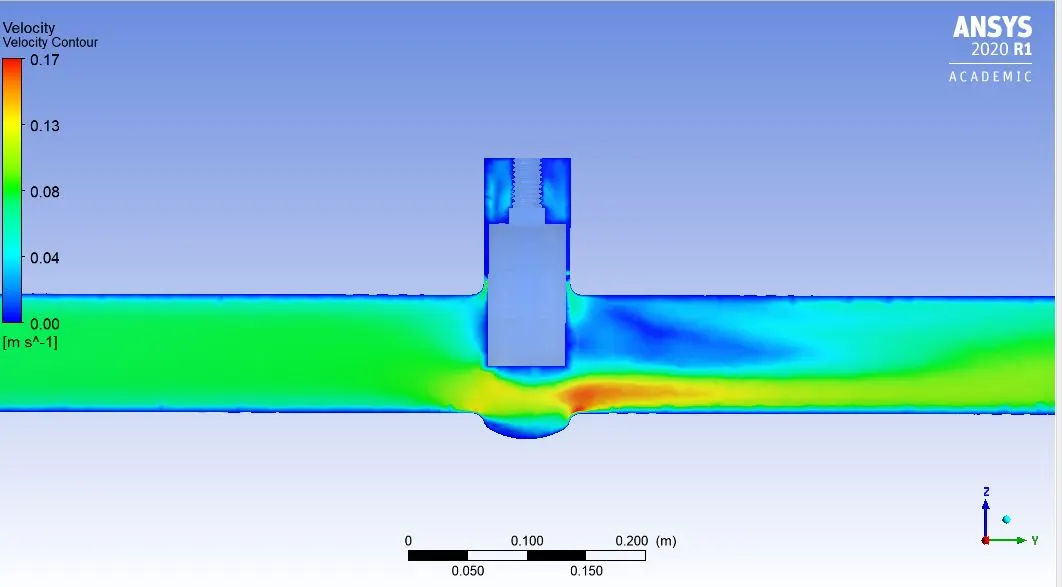
60 mm valve opening:
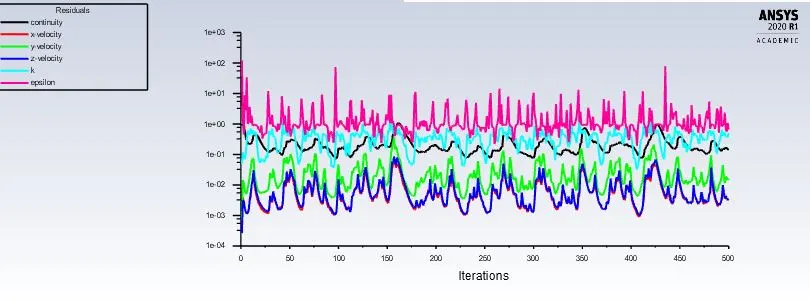
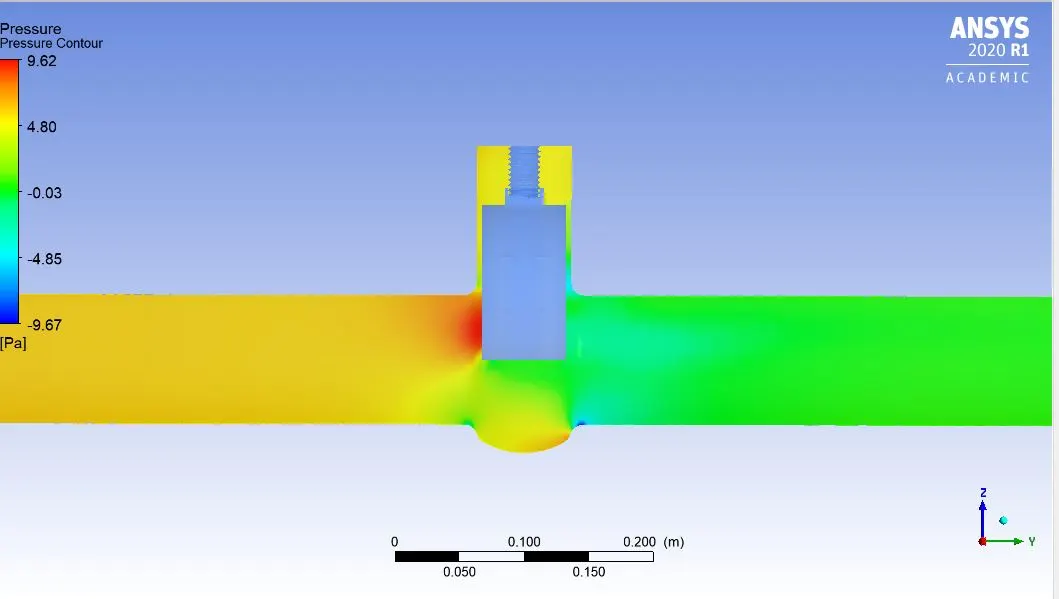
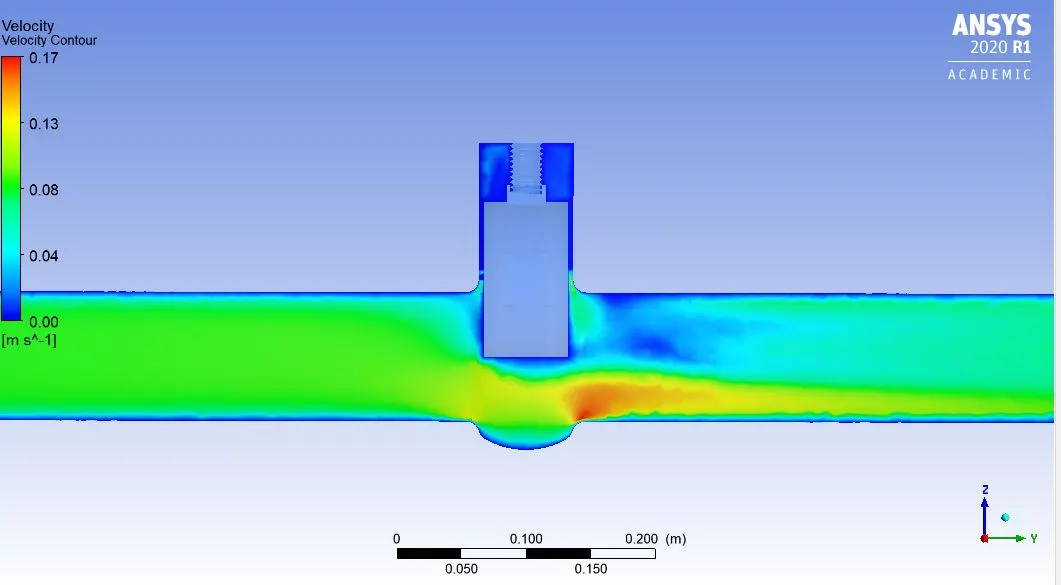
70 mm valve opening:
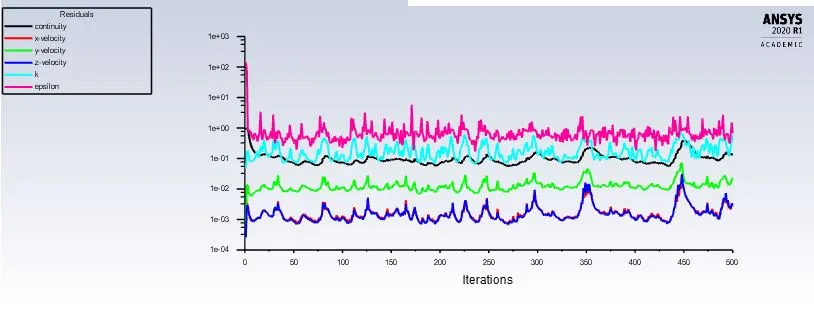
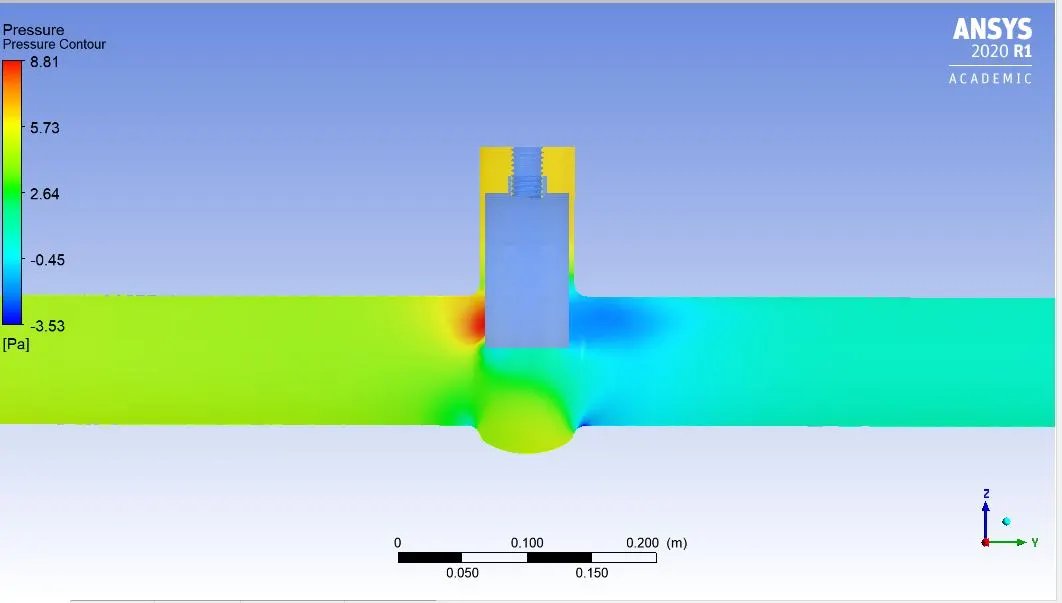
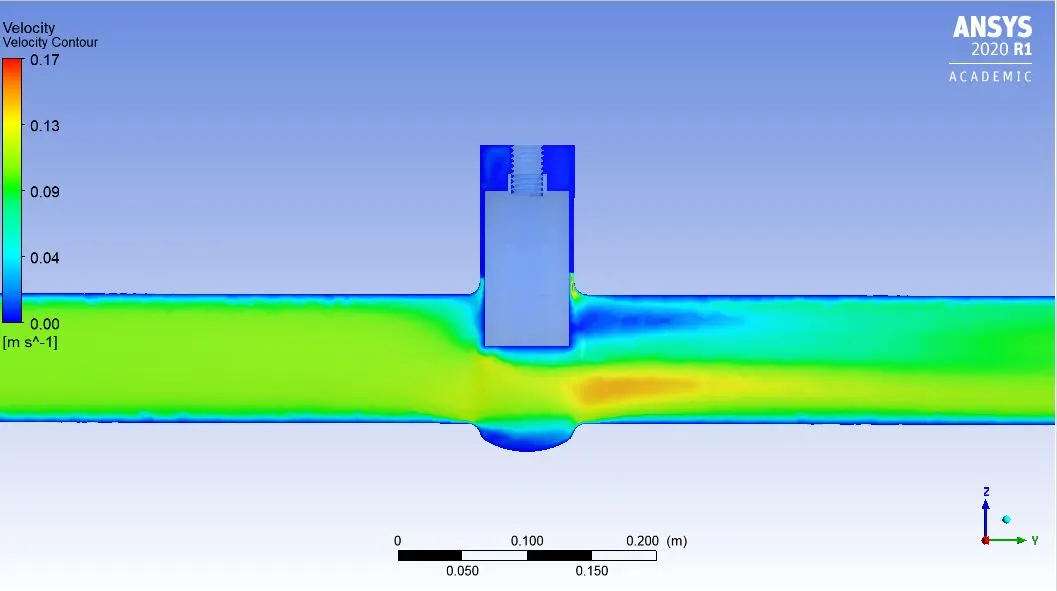
80 mm valve opening:
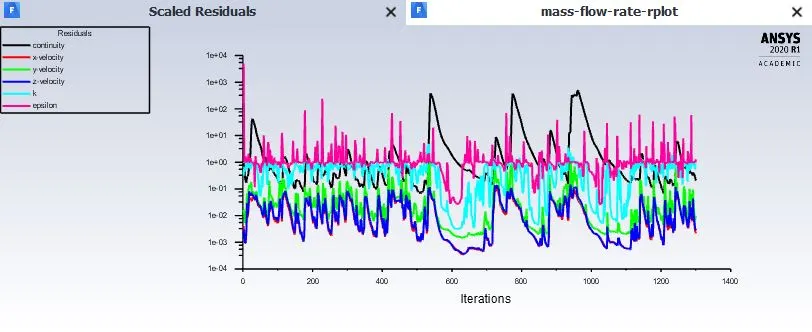
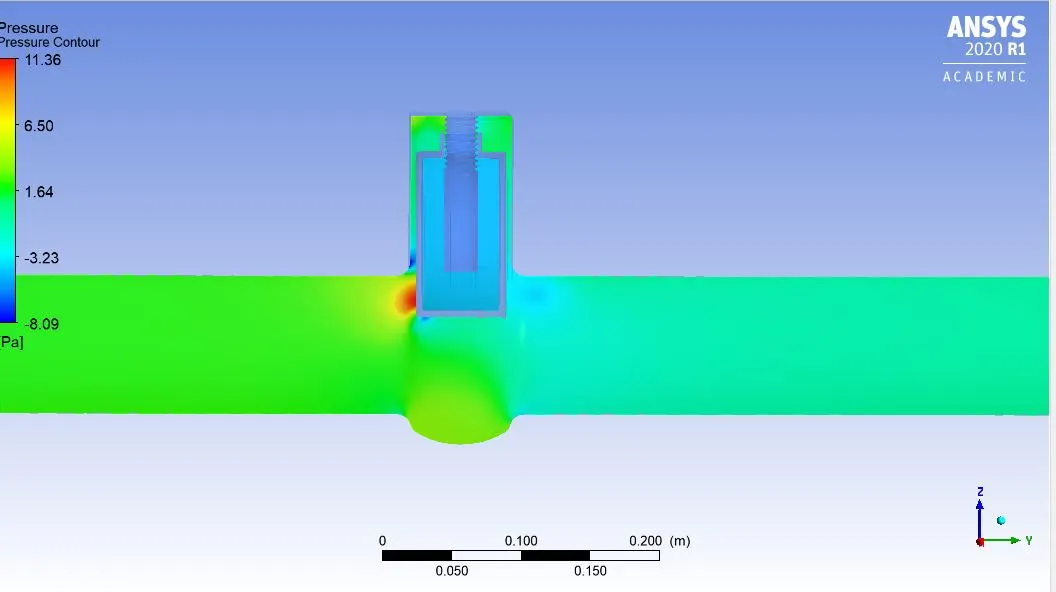
Parameter Table for mass flow rate:
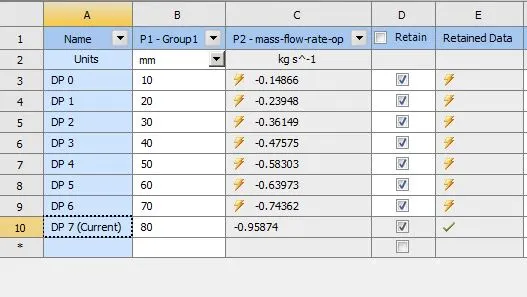
The negative sign indicates outflow from the outlet.
Flow coefficient and Flow factor
Flow coefficient is a mathematical quantity that describes the relationship between pressure drop, flow rate, and specific gravity of a fluid as it flows through a pipe. It basically describes the efficiency at which fluid is allowed to flow.
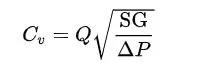
Where Q is the flow rate in Kg/s. SG is the specific gravity = 1,
 is the pressure drop across the valve, and in this case is taken as 10 Pascal.
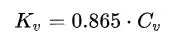
Flow factor is calculated as:
Results and Inferences
| Opening (mm) | Flow Rate Q (Gal/min) | Flow Coefficient Cv | Flow Factor Kv | Pressure drop P (Psi) | Specific Gravity | |
| 10 | 2.356261 | 61.87033874 | 53.51784301 | 0.00145038 | 1 | |
| 20 | 3.795758 | 99.66842945 | 86.21319147 | |||
| 30 | 5.7296165 | 150.4473883 | 130.1369909 | |||
| 40 | 7.5406375 | 198.0008991 | 171.2707777 | |||
| 50 | 9.2410255 | 242.6494255 | 209.8917531 | |||
| 60 | 10.1397205 | 266.2472205 | 230.3038458 | |||
| 70 | 11.786377 | 309.4848735 | 267.7044156 | |||
| 80 | 15.196029 | 399.014991 | 345.1479672 |
The graphs illustrates the variation of flow coefficient and flow factor with valve opening.
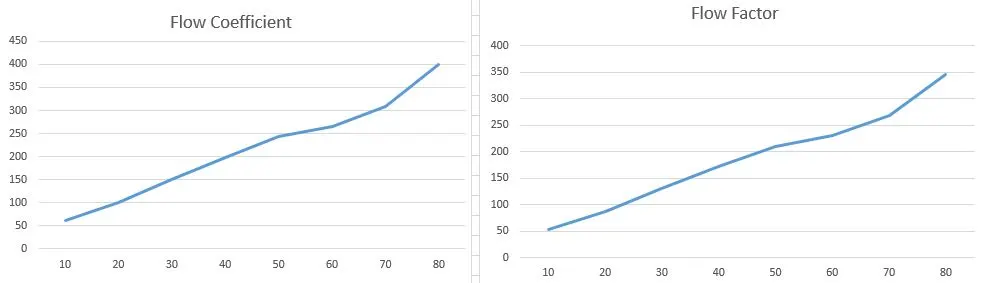
From the graph, it is observed that with an increase in the valve opening, the flow coefficient and flow rate both increase. This indicates that the flow efficiency, or the flow through a pipe is higher and at a higher rate with more valve opening, which is what is expected as there is less obstruction to the fluid flow.