Week 4 - Genetic Algorithm
- GENETIC ALGORITHM:
- AIM:
The main aim of the project is to optimize the given stalagmite function and to find the global maxima of the same function using MATLAB coading.
- OBJECTIVE:
Genetic algorithm (GA) is a search based optimization technique which mimics the principles of Natural Genetics and Natural selection. It is frequently used to find the optimal or near-optimal solution. The algorithm repetedely modifies the population of individual solutions. At each step,genetic algorithm randomly selects individuals from current population and uses them as a parent to produce children for the next generation. Over successive generation the population evolves towards the optimal solution. Gentic Algorithm use to solve the problems that are not well suited for standard optimization algorithms,including problem in which the objective function is discontinous, non-differentiable, stochastic or highly non-linear. Fig(1) represents the flowchart of genetic algorithm.
FIG(1) : Flowchart of Genetic Algorithm
Genetic Algorithm starts with the initilization of population selection,population is a number of sample data points taken to perform the optimization function.These sample data points undergo following steps
- Selection:
In this step, parent is selected from a sample data points to produce their offsprings, the main aim is to find the fittest individual using fittness approach.The fitter individual has a greater probability of selection ,in this way parents are selected for the crossover process.
- Crossover:
It is a process of taking a two parent's solution and producing the offspring from them.
- Mutation:
Mutation is carried out to maintain the genetic diversity from one generation of population of chromosome to the next generation.If mutation is not performed,the chromosome will become similar to each other ,convergence take place soon and results in local minima.
The termination condition of a Genetic Algorithm is important in determining when a GA run will end. It has been observed that, initially, the GA progresses very fast with better solutions coming in every few iterations, but this tends to saturate in the later stages where the improvements are very small. We usually want a termination condition such that our solution is close to the optimal, at the end of the run.
we keep one of the following termination conditions :
-
When there has been no improvement in the population for X-number of generations.
-
When we reach an absolute number of generations.
-
When the objective function value has reached a certain predefined value.
- SYNTAX:
x = ga(fun,nvars,A,b,Aeq,beq,lb,ub,nonlcon,IntCon,options)
- fun - Objective function
Objective function specified as function handel or function name, write a objective function to accept the row vector of length nvars and return a sclar vector.
2. nvars - Number of variables
Number of variables is specified as a possitive integer. The solver passes row vector of length nvars to fun.
3. A- Linear inequality constraints
Linear inequality constraint is specified as a real matrix. A is M-by-nvars matrix ,where M is number of inequalities
4. b - Linear inequality constraints
Linear inequality constraint is specified as a real vector.b is M-element vector related to A matrix.
5. Aeq - Linear equality constraints
Linear equality constraints is specified as a real matrix. Aeq is M-by-nvars matrix,where M is number of equalities
6. beq - Linear equality constraints
Linear equality constraint is specified as a real vector . beq is M-element vector releated to Aeq matrix.
7. lb - Lower bound
Lower bound is specified as a real vector or array of doubles.
8. ub - Upper bound
upper bound is specified as a real vector or array of doubles.
9. nonlcon - Non-linear constraints
Non-linear constraints is specified as a function handel or function name.nonlcon is a function that accepts a vector ar arrayx and returns two arrays,c(x) and ceq(x).
10. options - optimization options
optimization options is specifed as the output of optimoptions or a structure.
- PROBLEM:
To perform the Genitic Algorithm optimization for a stalagmite function,to find it's maxima.The stalagmite function has two inputs(x&y) as shown :
`f(x,y) = f1x *f2x*f1y*f2y`
where,
`f1x = [sin(5.1*pi*x+0.5)]^6`
`f1y = [sin(5.1*pi*y+0.5)]^6`
`f2x = exp[-4*ln(2)*(x-0.0667)^2/0.64]`
`f2y = exp[-4*ln(2)*(y-0.0667)^2/0.64]`
- STALAGMITE FUNCTION:
CODE:
function [f] = stalagmite(input_vector)

f1x = (sin((5.1*pi).*input_vector(1)+0.5)).^6;

f1y = (sin((5.1*pi).*input_vector(2)+0.5)).^6 ;

f2x = exp((-4*log(2))*(input_vector(1)-0.0667).^2/0.64);

f2y= exp((-4*log(2))*(input_vector(2)-0.0667).^2/0.64);

f1 = (f1x*f1y*f2x*f2y);

f = -f1;

end
Genitic algorithm always finds the global minma in order to find the global maxima of stalagmite function introduce negetive sign ('-') in the function.
- OPTIMIZATION CODE:
clear all
close all
clc

%program to optimize the stalagmite function

x = linspace(0,0.6,150);
y = linspace(0,0.6,150);

%creating 2d array

[xx yy] = meshgrid(x,y);

%Evaluating stalagmite function

for i = 1 : length(x)
for j = 1:length(y)

input_vector1 = xx(i,j);
input_vector2 = yy(i,j);

[input,fval] = stalagmite(input_vector);
end
end

%study 1 - statistical behaviour with unbound

tic

%number of itteration
n = 50;
for i = 1:n

[inputs,fopt(i)] = ga(@stalagmite,2);


xopt(i) = inputs(1);
yopt(i) = inputs(2);

end

study_time1 = toc

figure(1)
subplot(2,1,1)
hold on
surfc(xx,yy,f)
shading interp
plot3(xopt,yopt,fopt,'marker','o','markersize',5,'markerfacecolor','b')
title('unbound')
subplot(2,1,2)
plot(fopt)
xlabel('no of itteration')
ylabel('function maximum')


%study 2 - statistical behaviour with bound

tic

%number of itteration
n = 50;
for i = 1:n

[inputs,fopt(i)] = ga(@stalagmite,2,[],[],[],[],[0;0],[1;1])


xopt(i) = inputs(1);
yopt(i) = inputs(2);

end

study_time2 = toc

figure(1)
subplot(2,1,1)
hold on
surfc(xx,yy,f)
shading interp
plot3(xopt,yopt,fopt,'marker','o','markersize',5,'markerfacecolor','b')
title('bound')
subplot(2,1,2)
plot(fopt)
xlabel('no of itteration')
ylabel('function maximum')

%study 3 -statistical behaviour with increasing population size
options = optimoptions('ga')
options = optimoptions(options,'Population_size',200)

tic

%number of itteration
n = 50;
for i = 1:n

[inputs,fopt(i)] = ga(@stalagmite,2,[],[],[],[],[0;0],[1;1],[],[],options)


xopt(i) = inputs(1);
yopt(i) = inputs(2);

end

study_time3 = toc

figure(1)
subplot(2,1,1)
hold on
surfc(xx,yy,f)
shading interp
plot3(xopt,yopt,fopt,'marker','o','markersize',5,'markerfacecolor','b')
title('bound with increasing population size')
subplot(2,1,2)
plot(fopt)
xlabel('no of itteration')
ylabel('function maximum')
- EXPLANATION:
- Define the search space using linspace command.
- create 2d array using meshgrid command.
- sub programm is created using stalagmite function and stored in f variable.
- study 1 :
- In case 1 it calculated the global maxima value by using a random samples from the function,the number of itteration is given as 50.
- tic command records the current time and toc function is used to evaluate the elapsed time.
- The x and y values are stored in xopt and yopt.
- we use subplot(m,n,p) command to divide the current figure into a m*n grid and create axes in the position specified by p.
- plot the stalagmite function using surfc command to create 3D surface plots.
- surface interp commanad is used to remove the grid lines and makes the plot more smoother.
- plot3 command is used to plot the coordinates in 3D space.
- plot fopt values using plot command.
- PLOT:
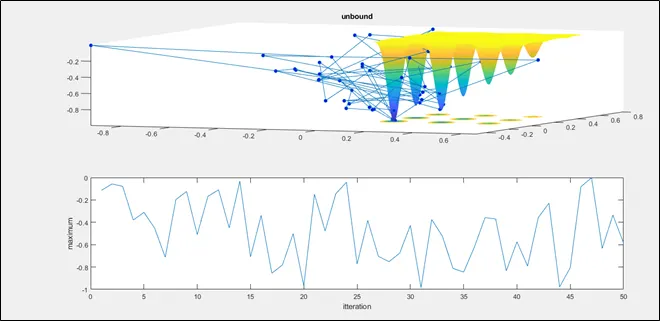
From the above figure it is clear that function maximize at many values because of random samples selected during optimization and study time for this case is around 11sec. Hence their is a need to give the boundry condition in case 2.
- study2:
- In case 2 it calculated the global maxima value by using a upper and lower boundary condition ,the number of itteration is given as 50.
- tic command records the current time and toc function is used to evaluate the elapsed time.
- The x and y values are stored in xopt and yopt.
- we use subplot(m,n,p) command to divide the current figure into a m*n grid and create axes in the position specified by p.
- plot the stalagmite function using surfc command to create 3D surface plots.
- surface interp commanad is used to remove the grid lines and makes the plot more smoother.
- plot3 command is used to plot the coordinates in 3D space.
- plot fopt values using plot command.
- PLOT:
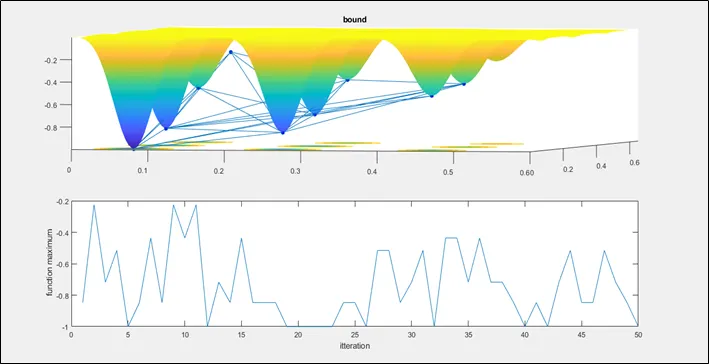
From the above figure function maximize at many values but within the given limit and study time for this case is around 15sec . We can obtain a maximize value by increasing the population size as in case 3.
- study 3:
- In case 3 it calculated the global maxima value by using a upper and lower boundary condition and by increasing the population size ,the number of itteration is 50.
- population size is increased to 200 by using optimotions command which create optimization problem.
- tic command records the current time and toc function is used to evaluate the elapsed time.
- The x and y values are stored in xopt and yopt.
- we use subplot(m,n,p) command to divide the current figure into a m*n grid and create axes in the position specified by p.
- plot the stalagmite function using surfc command to create 3D surface plots.
- surface interp commanad is used to remove the grid lines and makes the plot more smoother.
- plot3 command is used to plot the coordinates in 3D space.
- plot fopt values using plot command.
- PLOT:
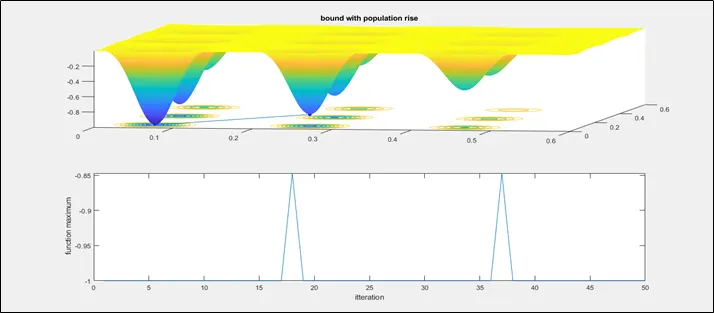
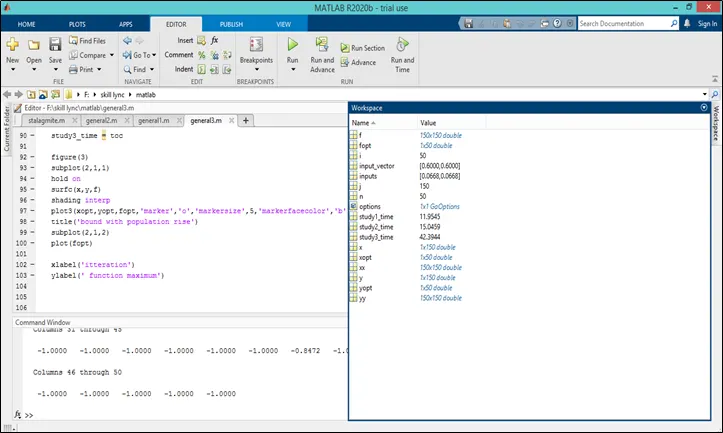
From the above figure it is clear that the maximum value is -1 at x = 0.0688 and y = 0.0688 and study time for this case is around 42sec.
- WORKSPACE:
- REFERENCES:
- https://in.mathworks.com/help/gads/ga.html
- skill-lync.freshdesk.com