Parsing NASA thermodynamic data
- FILE PARSING OF NASA THERMODYNAMIC DATA:
- AIM:
The main aim of the project is to write a program to evaluate the thermodynamic data such as specific heat, Enthalpy,Entropy of NASA thermodynamic data and to create the plots for all the species and to display the molecular weight calculation using MATLAB coding.
- OBJECTIVE:
NASA came up with a thermodynamic data which is used to evaluate the properties such as specific heat(c_p),Enthalpy(H),Entropy(S).Now,parsing a file means reading in a data stream of some sort and building an in memory model of semantic content of that data.
- DEFINATIONS:
1. Specific Heat:
Specific Heat is a ratio of the quantity of heat required to raise the temperature of a body one degree to that required to raise the temperature of an equal mass of water one degree.The SI unit of specific heat is J/KG-K.
2. Enthalpy:
The Enthalpy of a Thermodynamic system is defined as the sum of its internal energy and the work required to achieve its presure and volume. The SI unit of specific Enthalpy is kj/kg.
3. Entropy:
Entropy is a measure of degree of disorderness of the system. The SI unit of entropy is j/k.
- FILE PARSING:
From the given thermodynamic data it it clear that their are 53 species and for each species their are 14 co-efficients and for each species their is a unique low,mid and high temperature ranges . Fomula used to calculate the specific heat ,enthalpy and entropy using the coefficient is as shown below,
`(cp)/R = a1+a2*T+a3*T^2+a4*T^3+a5*T^4`
where, cp = specific heat in j/kg-k
`H/(RT) = a1+(a2*T)/2+(a3*T^2)/3+(a4*T^3)/4+(a5*T^4)/5+(a6)/T` `
R = universal gas constant (8.314j/k-mol)
H = enthalpy in kj/kg
`S/R = a1*logT+a2*T+(a3*T^2)/2+(a4*T^3)/3+(a5*T^4)/4+a7` S = entropy in j/k
Their are 14 coefficient as said in which first 7 coefficient are High temperature coefficient and second 7 coefficient are Low temperature coefficient.
- EXPLANATION:
Getting header information:
clear all
close all
clc
%To open the thermal data file
f1 = fopen('THERMO.dat','r');

%get heading file

heading = fgetl(f1);
The program starts with the clear all close all and clc which clears the previous recorded data and to open the thermal file use command fopen,to read the heading line of the data use fgetl command and to read the next line use same command (fgetl).
Getting the global temperature information:
%Global temperature values

global_temp = fgetl(f1);

x = strsplit(global_temp);

global_low_temp = str2double(x{2});
global_mid_temp = str2double(x{3});
global_high_temp = str2double(x{4});

fgetl(f1)
fgetl(f1)
fgetl(f1)
To get the global temperature line fgetl command is used ,usually information will stored in the form of strings, to get the numerical value use str2double command which converts the text in string of numerical value in string to double precision value and use {} instead of () which means the global temperature line is in the form of cell array by which we can obtain the global temperature values and to skip the next three lines use fgetl command.
Getting local temperature information of individual species:
line1 = fgetl(f1);
    species_name = line1(1:6);

    %local temperature

    local_temp1 =line1(49:55);
    low_temp = str2double(local_temp1);

    local_temp2 = line1(58:65);
    high_temp = str2double(local_temp2);

    local_temp3 = line1(68:75);
    mid_temp = str2double(local_temp3);
To get the local temperature line use fgetl command and store it as line1 in which we can observe that the first is the species name and the maximum length of species name is 6 hence by giving the command line1(1:6) matlab can read the species name whose maximum length is 6 and in the same line we observe the local temperatures and local low temperature is located at 49 location to the 55th location and use str2double command to convert the string form to the numerical value and store it as low temperature and repeat the same process to get high and mid temperature.
To Extract the coefficient values:
 % extracting the coefficient
    line2 = fgetl(f1);
    line3 = fgetl(f1);
    line4 = fgetl(f1);

    a = strfind(line2,'E');
    b = strfind(line3,'E');
    c = strfind(line4,'E');

    %extracting coefficient of high temperature
    a1 = str2double(line2(1:a(1)+3));
    a2 = str2double(line2(a(1)+4:a(2)+3));
    a3 = str2double(line2(a(2)+4:a(3)+3));
    a4 = str2double(line2(a(3)+4:a(4)+3));
    a5 = str2double(line2(a(4)+4:a(5)+3));
    a6 = str2double(line3(1:b(1)+3));
    a7 = str2double(line3(b(1)+4:b(2)+3));

    %extracting coefficient of low temp
    a8 = str2double(line3(b(2)+4:b(3)+3));
    a9 = str2double(line3(b(3)+4:b(4)+3));
    a10 = str2double(line3(b(4)+4:b(5)+3));
    a11 = str2double(line4(1:c(1)+3));
    a12 = str2double(line4(c(1)+4:c(2)+3));
    a13 = str2double(line4(c(2)+4:c(3)+3));
    a14 = str2double(line4(c(3)+4:c(4)+3));
To extract the value of coefficient which is used to calculate the specific heat ,enthalpy and entropy use fgetl command.Once we get the coefficient line of thermal data ,observe that letter 'E' is present in each coefficient and use strfind command used to find the string 'E' and store it in as a,b,c and in command window it will show the location of E by which we can extract the first coefficient and it will be in the form of string and to get the numerical value use str2double command by these we can obtain all 14 coefficient.
Specific Heat Function:
function c_p = specific_heat(a1,a2,a3,a4,a5,a8,a9,a10,a11,a12,mid_temp,R,t)

if t<=mid_temp
    c_p = (a8+a9.*t+a10.*t.^2+a11.*t.^3+a12.*t.^4).*R;
else
    c_p = (a1+a2.*t+a3.*t.^2+a4.*t.^3+a5.*t.^4).*R;
end
From the formula it is observed that specific heat is a function of coefficients,universal gas constant,temperature.If loop is used because their is a condition that first 7 coefficient are high temperature coefficient and second 7 coefficient are low temperature coefficient.Hence the function is coded as above .
Enthalpy Function:
function H = enthalpy(a1,a2,a3,a4,a5,a6,a8,a9,a10,a11,a12,a13,R,t,mid_temp)
if t<=mid_temp

    H = (a8+(a9.*t./2)+(a10.*t.^2/3)+(a11.*t.^3/4)+(a12.*t.^4/5)+(a13./t)).*R.*t;
else
    H =(a1+(a2.*t/2)+(a3.*t.^2/3)+(a4.*t.^3/4)+(a5.*t.^4/5)+(a6./t)).*R.*t;
end
From the formula it is observed that Enthalpy is a function of coefficients,universal gas constant,temperature.If loop is used because their is a condition that first 7 coefficient are high temperature coefficient and second 7 coefficient are low temperature coefficient.Hence the function is coded as above.
Entropy Function:
function S = entropy(a1,a2,a3,a4,a5,a7,a8,a9,a10,a11,a12,a14,R,t,mid_temp)

if t<=mid_temp
    S = (a8*log(t)+a9.*t+(a10.*t.^2/2)+(a11.*t.^3/3)+(a12.*t.^4/4)+a14).*R;
else
    S = (a1*log(t)+a2.*t+(a3.*t.^2/2)+(a4.*t.^3/3)+(a5.*t.^4/4)+a7).*R;
end
From the formula it is observed that Entropy is a function of coefficients,universal gas constant,temperature.If loop is used because their is a condition that first 7 coefficient are high temperature coefficient and second 7 coefficient are low temperature coefficient.Hence the function is coded as above.
Molecular Weight Function:
function molecular_weight_calc = molecular_weight(species_name)
elements = ['O','H','C','N','A'];
atomic_mass =[15.999,1.008,12.011,14.007,39.948];
mol_wt =0;
for i = 1:length(species_name)
    for j = 1:length(elements)
        if strcmpi(species_name(i),elements(j))
            mol_wt = mol_wt+atomic_mass(j);
            z = j;
        end
    end
    t = str2num(species_name(i));
    if (t>1)
        mol_wt = mol_wt+(atomic_mass(z)*(t-1));
    end
    molecular_weight_calc = mol_wt
end
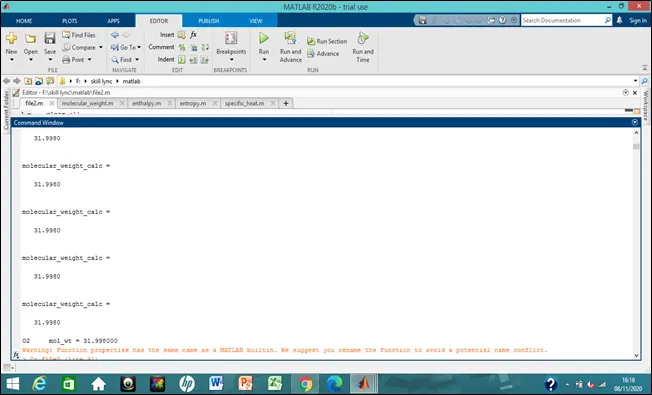
It is observed that the thermodynamic data contain mainly 5 species such as oxygen,Hydrogen,Carbon,Nitrogen,Argon and symbols of these species is stored in array called elements and its corresponding atomic mass is stored in atomic mass array.For loop is initiated because the process is repeated for every species . strcmpi command is used to compare the string character of species name and coresponding elements and molecular weight is calculated using the formula mol wt = mol wt + atomic mass.If their is a repeatation of species then if loop is initiated and molecular weight is calculated as shown above.
molecular_weight_calc = molecular_weight(species_name);

k =sprintf('%s mol_wt = %f',species_name,molecular_weight_calc);
disp(k)
In main codeing we write the above codeing in which sprintf is used to format the molecular weight values into string vector and %f command is used to get the floating value of molecular weight of species.disp(k) is used to display the values of molecular weight in command window.
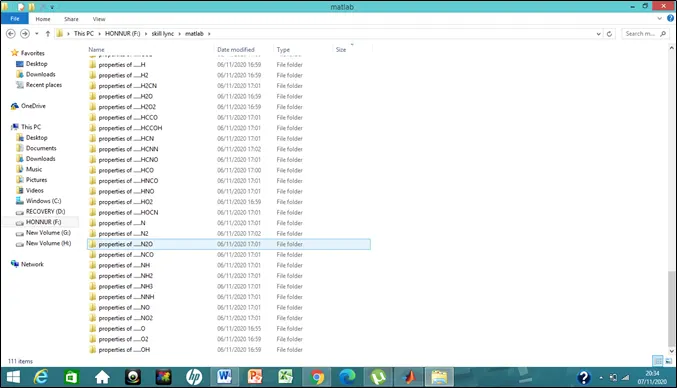
Creating Folder:
%creating folder
data = strcat('properties of .....',species_name);
mkdir(data);
file = pwd;
strcat command is used to concatenate strings horizontally which means it combines both the strings (for ex:properties of o,properties of h2o....)and store it in data and mkdir command is used to create new folder and identify the current folder by using pwd command.
Plotting:
%plotting
figure(1)
plot(t,c_p)
data1 = strcat(species_name,'temperature vs specific heat');
xlabel('Temperature')
ylabel('specific_heat')
title(species_name)
f = fullfile(data)
cd(f)
saveas(gcf,[pwd '/specific heat vs temperature .jpg'])
cd(file)

figure(2)
plot(t,H)
data2 = strcat(species_name,'temperature vs enthalpy');
xlabel('Temperature')
ylabel('Enthalpy')
title(species_name)
cd(f);
saveas(gcf,[pwd '/enthalpy vs temperature .jpg'])
cd(file)

figure(3)
plot(t,S)
data3 = strcat(species_name,'temperature vs entropy')
xlabel('Temperature')
ylabel('Entropy')
title(species_name);
cd(f);
saveas(gcf,[pwd '/entropy vs temperature .jpg'])
cd(file)
Plot the temperature vs specific heat values using plot command and strcat command is used to concatenate strings horizontally which means it combines both the strings and store it as a data1 and give the xlabel , ylabel and title for the graph and fullfile command is used to store the entire information in data file and cd displays the current folder and the graph is saved using saveas command in jpg format and gcf command is used to handel the current figure.
- MAIN CODING:
clear all
close all
clc
f1 = fopen('THERMO.dat','r');

%get heading file

heading = fgetl(f1);

%Global temperature values

global_temp = fgetl(f1);

x = strsplit(global_temp);

global_low_temp = str2double(x{2});
global_mid_temp = str2double(x{3});
global_high_temp = str2double(x{4});

fgetl(f1)
fgetl(f1)
fgetl(f1)

% their are 53 species

for i = 1:53
    line1 = fgetl(f1);
    species_name = line1(1:6);

    %local temperature

    local_temp1 =line1(49:55);
    low_temp = str2double(local_temp1);

    local_temp2 = line1(58:65);
    high_temp = str2double(local_temp2);

    local_temp3 = line1(68:75);
    mid_temp = str2double(local_temp3);

    % extracting the coefficient
    line2 = fgetl(f1);
    line3 = fgetl(f1);
    line4 = fgetl(f1);

    a = strfind(line2,'E');
    b = strfind(line3,'E');
    c = strfind(line4,'E');

    %extracting coefficient of high temperature
    a1 = str2double(line2(1:a(1)+3));
    a2 = str2double(line2(a(1)+4:a(2)+3));
    a3 = str2double(line2(a(2)+4:a(3)+3));
    a4 = str2double(line2(a(3)+4:a(4)+3));
    a5 = str2double(line2(a(4)+4:a(5)+3));
    a6 = str2double(line3(1:b(1)+3));
    a7 = str2double(line3(b(1)+4:b(2)+3));

    %extracting coefficient of low temp
    a8 = str2double(line3(b(2)+4:b(3)+3));
    a9 = str2double(line3(b(3)+4:b(4)+3));
    a10 = str2double(line3(b(4)+4:b(5)+3));
    a11 = str2double(line4(1:c(1)+3));
    a12 = str2double(line4(c(1)+4:c(2)+3));
    a13 = str2double(line4(c(2)+4:c(3)+3));
    a14 = str2double(line4(c(3)+4:c(4)+3));

    %universal gas constant

    R = 8.314;
    t=linspace(low_temp,high_temp,500);


    %calculating specific heat

    c_p =  specific_heat(a1,a2,a3,a4,a5,a8,a9,a10,a11,a12,mid_temp,R,t);

    %calculating enthalpy

     H = enthalpy(a1,a2,a3,a4,a5,a6,a8,a9,a10,a11,a12,a13,R,t,mid_temp);

     %calculating entropy

     S = entropy(a1,a2,a3,a4,a5,a7,a8,a9,a10,a11,a12,a14,R,t,mid_temp);


%creating folder
data = strcat('properties of .....',species_name);
mkdir(data);
file = pwd;


%plotting
figure(1)
plot(t,c_p)
data1 = strcat(species_name,'temperature vs specific heat');
xlabel('Temperature')
ylabel('specific_heat')
title(species_name)
f = fullfile(data)
cd(f)
saveas(gcf,[pwd '/specific heat vs temperature .jpg'])
cd(file)

figure(2)
plot(t,H)
data2 = strcat(species_name,'temperature vs enthalpy');
xlabel('Temperature')
ylabel('Enthalpy')
title(species_name)
cd(f);
saveas(gcf,[pwd '/enthalpy vs temperature .jpg'])
cd(file)

figure(3)
plot(t,S)
data3 = strcat(species_name,'temperature vs entropy')
xlabel('Temperature')
ylabel('Entropy')
title(species_name);
cd(f);
saveas(gcf,[pwd '/entropy vs temperature .jpg'])
cd(file)


molecular_weight_calc = molecular_weight(species_name);

k =sprintf('%s mol_wt = %f',species_name,molecular_weight_calc);
disp(k)
end


fclose(f1)- PLOTTING:
Plots of O2:
Specific heat vs temperature:
Enthalpy vs temperature:
Entropy vs temperature:
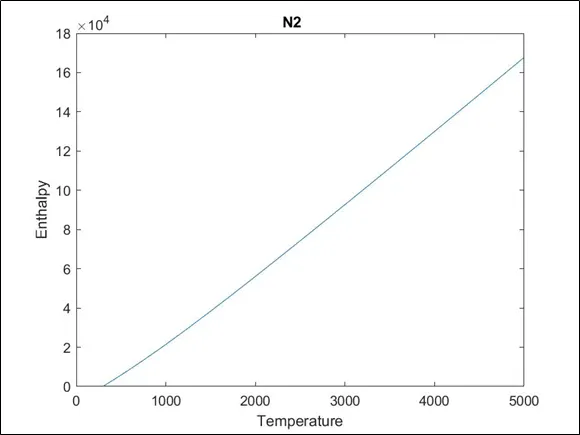
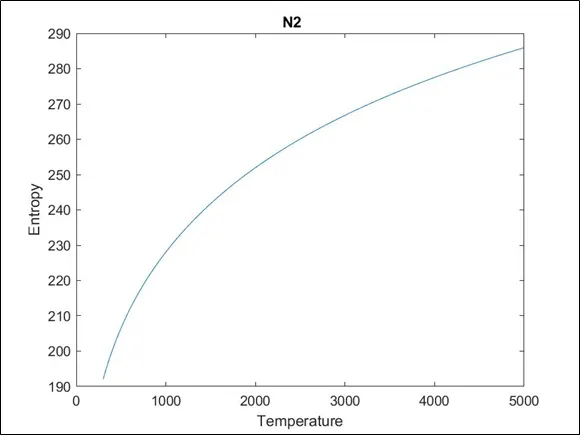
Plots of N2:
Specific Heat vs temperature:
Enthalpy vs temperature:
Entropy vs temperature:
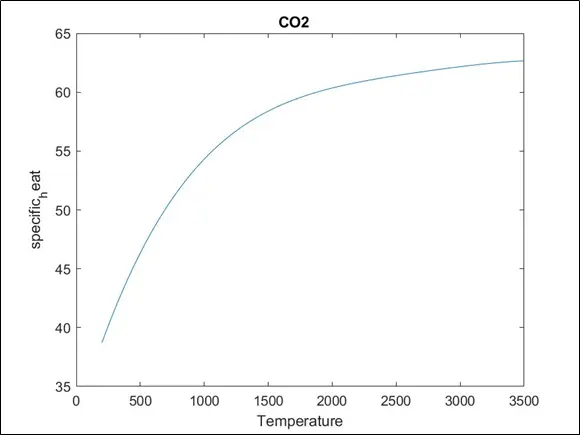
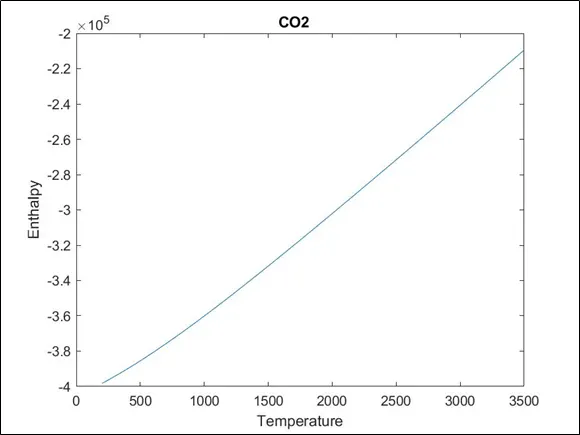
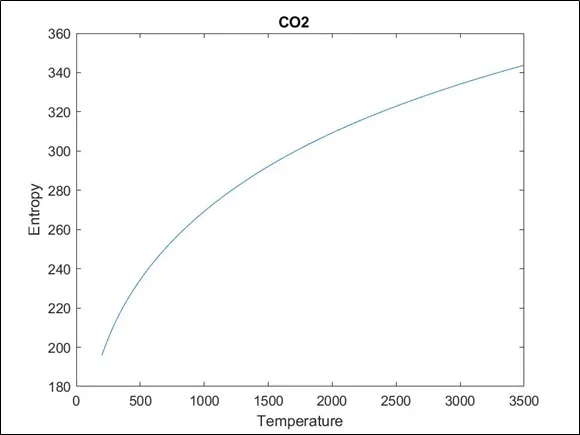
Plots of CO2:
Specific Heat vs temperature:
Enthalpy vs temperature:
Entropy vs temperature:
- SIGNIFICANCE OF PLOTS:
- SPECIFIC HEAT VS TEMPERATURE:
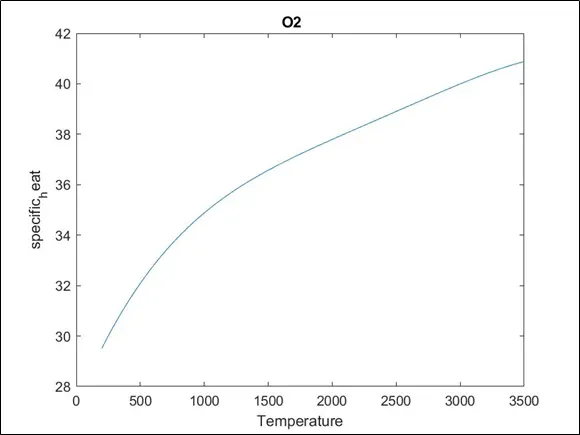
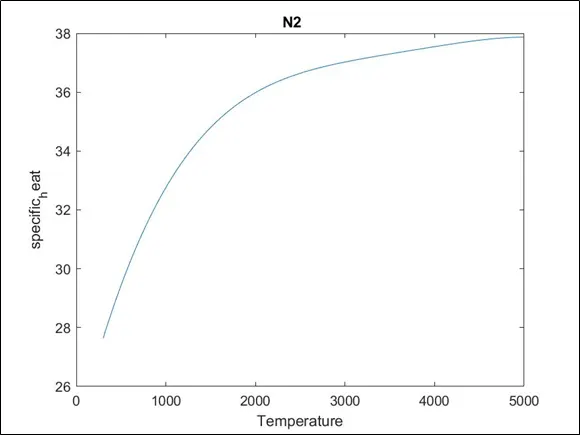
Specific heat of a subustance changes when their is a change in temperature.At molecular level, the internal energy of a subustance is stored in the form of transational,rotational and vibrational energy. It has 3 degree of freedom for each form of energy.In lower temperature range vibrational energy is insignificant,thus the bulk of the energy is given by remaining two forms,hence specific heat is comparitevely low when temperature increases,vibrational energy gains signifinance hence more amount of energy is required to raise the temperature by the same amount.Thus specific heat increases with temperature.
2. ENTHALPY VS TEMPERATURE:
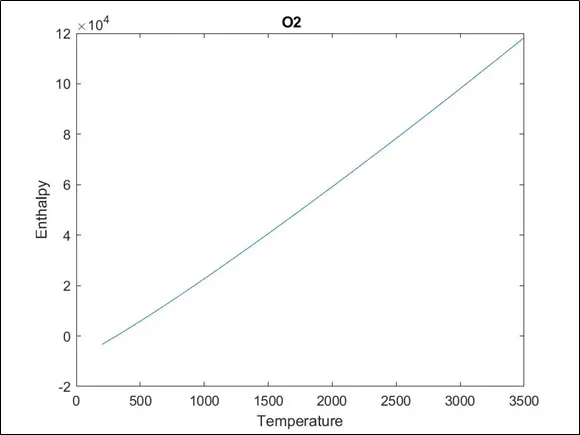
When temperature is increased the amount of molecular interaction also increases,then internal energy of the system rises thus, enthalpy of system increased.
`H = U+PV` where U = internal energy
H= enthalpy
3.ENTROPY VS TEMPERATURE:
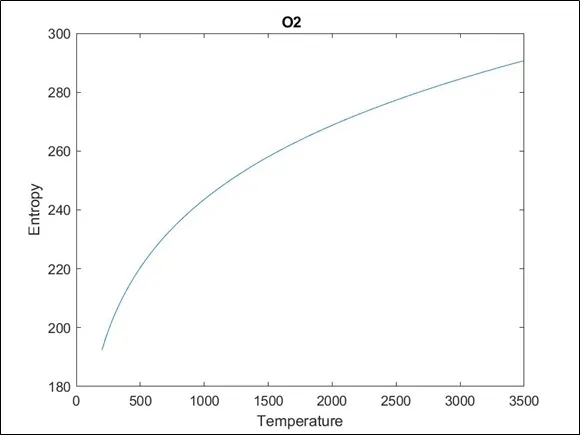
When temperature is increased ,more amount of energy is put into the system which exites the random activity.Since entropy is a measure of randomness in the system, entropy of system is increased.
- FILES OF INDIVIDUAL SPECIES:
- MOLECULAR WEIGHT CALCULATION:
- CONCLUSION:
The data has been extracted and thermodynamic property such as specific heat,Enthalpy,Entropy is calculated and graphs has been plotted and the files of individual species is created.