Week - 4
1. Implement control logic of a “washing machine” using Stateflow as per given sequence:
- If the power supply is available, the system gets activated
- If the Water supply is not available, stop the process & indicate through LED
- Soaking time should be 200s followed by Washing time of 100s.
- Then rinsing happens for next 20s & dryer runs for 50s
After all the processes have completed turn on the finished LED
ans:
BLOCKS USED:
CHART: To define the state flow
SLIDER SWITCH: To swicth on and off supply and water
DISPLAY: To display results
LAMP: Display a colot that reflect the input value
SIMULINK MODEL:
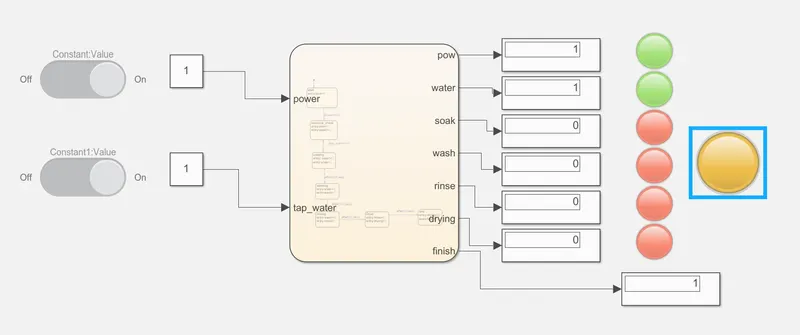
BASIC EXPLANATION:
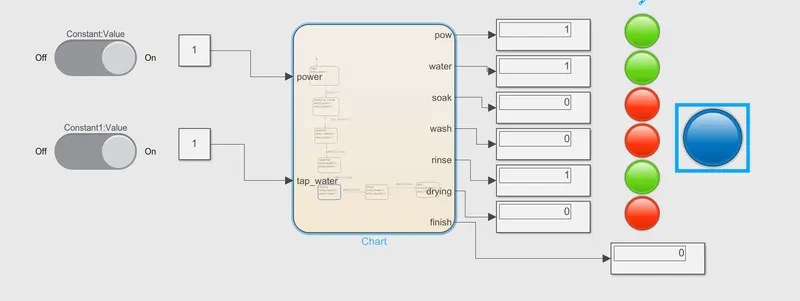
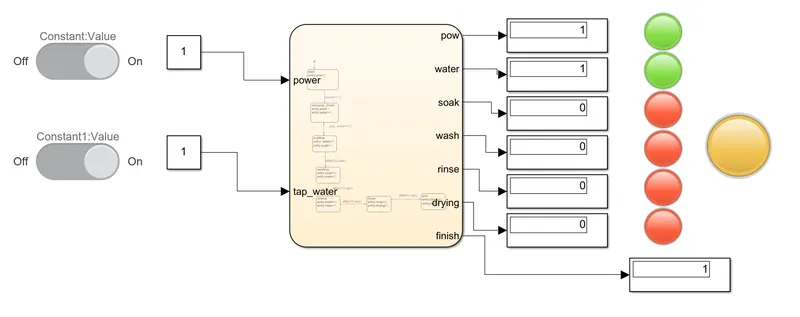
Two inputs power and water are switched on and off using a switch then different states gets activated based on the defined state flow parameters. the lamp block helps to identify when the different stages start and end. additional lamp is used to alert the user when all the operation is complete
BLOCK EXPLANATION:
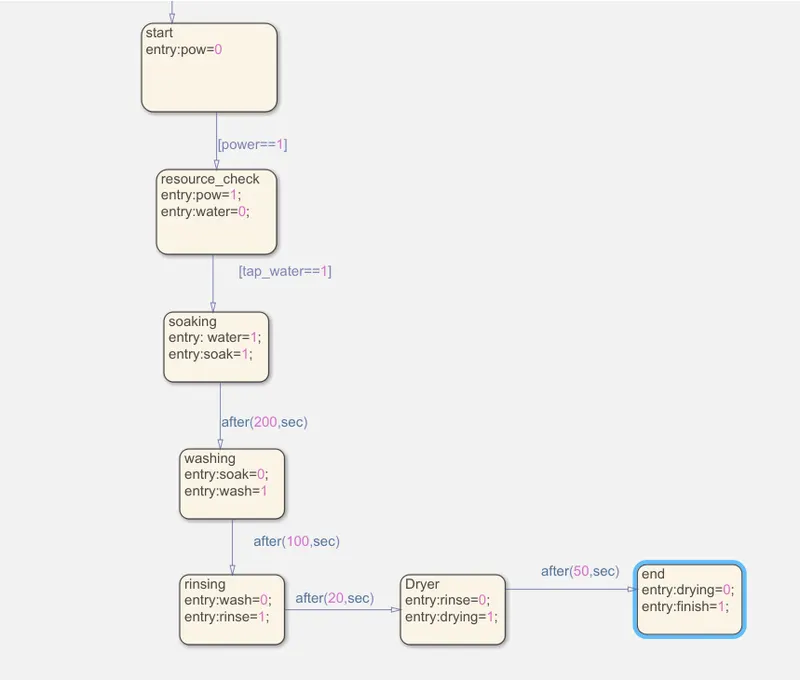
As per our condition we have created 2 inputs power and water (water supply). if the input value of both these are one then only machine starts or else it will stop and indicate us with red light. when both supplies are available it jumps to different states. To carry out a process for a specific time a time delay is given by giving "after(200,sec)" etc, to hold the parameter values for a specific time.
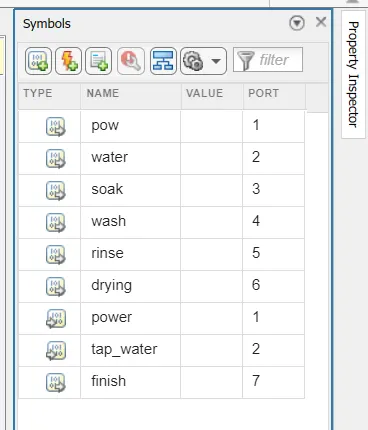
using symbols pane option the data's are set as input and output values
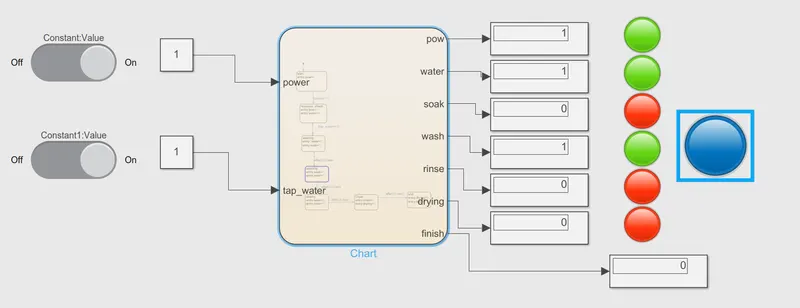
SOME OUTPUTS:
1)When the washing process is happening
2) When Rinsing process is happend
3) After the washing process is completed
RESULT
as we can see here, when the process is happeng the lamp will display green and other times it will remain red.
when the process is running one lamp connected to finish will remain blue at the end of process it turns to yellow
2. Make a Simulink chart for the “Gear shift” logic as per below conditions:
Speed Range(kmph) Gear
0 to 15 1
16 to 25 2
26 to 40 3
41 to 60 4
Above 61 5
Give speed input while the simulation is running & display the gear number.
ans:
BLOCKS USED:
CHART: To define the state flow
CONSTANT: To input constant values
SLIDER GAIN: To vary the speed during simulation
DISPLAY: To display the results
GENERAL EXPLANATION:
We are applying various speed input values and based on logic of the chart gear shifting happens.
CHART EXPLANATION:
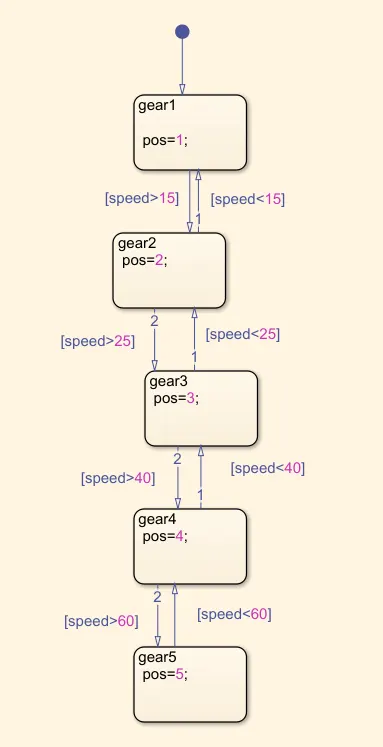
we have added 5 states and in state 1, the postion of gear is one till the speed reaches above 15 it will stay in that state, when the speed reaches above 15 it will shift to second and will stay on second, if the spped exceeds the upper limit it will shift to 3rd gear and if it gets lower limit it shifts back to 1st. Simmilarly all the gears work based on setted threshold limit.
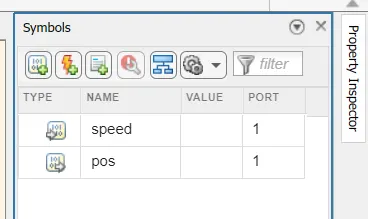
using symbols pane option we have given speed as input and position (pos) as output
OUTPUT
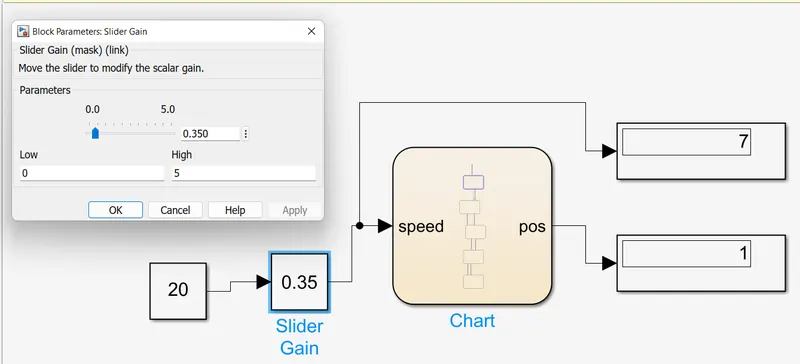
1) WHEN SPPED IS 7KM/HR
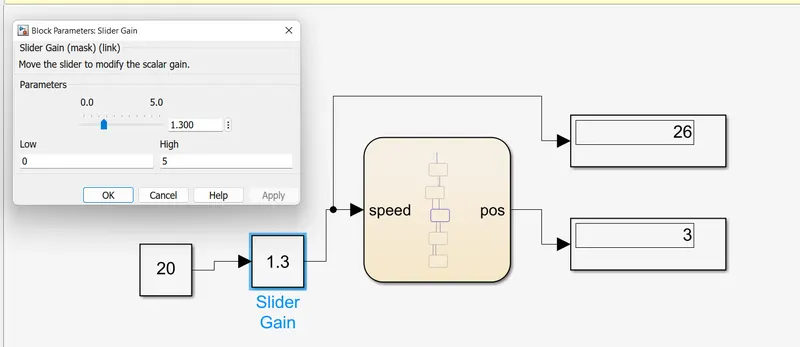
2) WHEN SPPED IS 26KM/HR
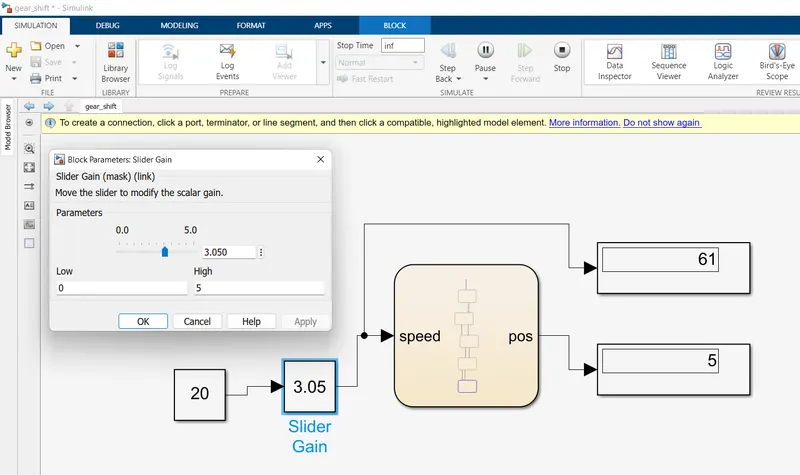
3) WHEN SPPED IS 61KM/HR
RESULT
We were able to change gears based on different input as per our logics