Project - Data Handling and Interpolation
MATLAB PROGRAM
clear all
close all
clc
%xlsread returns numeric data in array to num,n text data to txt and
%raw data to raw
[numb]=xlsread('VI.xlsx');
%extracting voltage and current values
v=numb(:,1);
i=numb(:,2);
%providing v values within a certain range
vlmt=(-17.3:0.1:0.9)
%interpolation is a process of determining the unknown values that lie in
% between the known data points. It is mostly used to predict the unknown values
i1=interp1(v,i,vlmt)

%actual plot
figure(1)
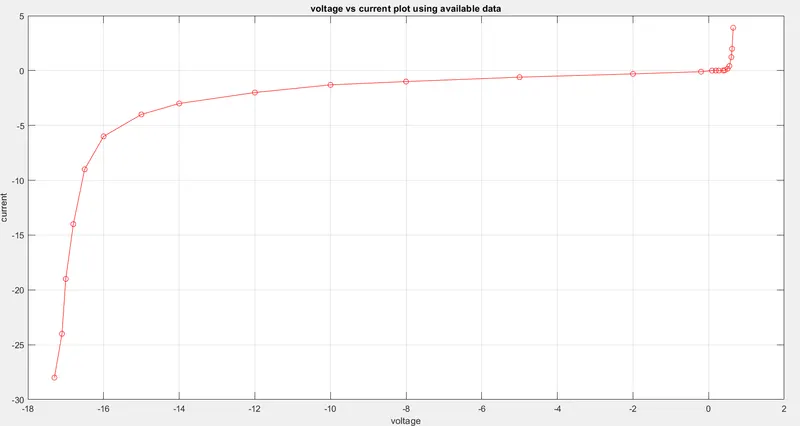
plot(v,i,'o-','Color','r')
xlabel('voltage')
ylabel('current')
title('voltage vs current plot using available data')
grid;

%interpreted plot
figure(2)
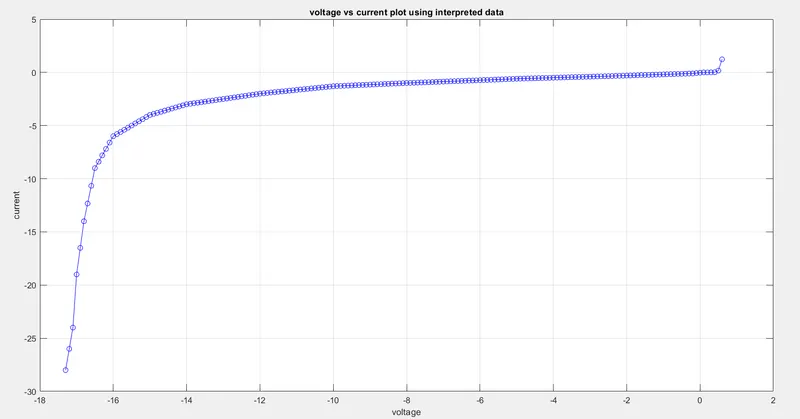
plot(vlmt,i1,'o-','Color','b')
xlabel('voltage')
ylabel('current')
title('voltage vs current plot using interpreted data')
grid;

%for opening a file and start writing
f1=fopen('interpreted_i.txt','w')
%writing data to text file
% %f is used to specify a floating point and \n for next line
fprintf(f1,'%4f \n',i1);
%closing the file
fclose(f1);
OUTPUTS
1) PLOTTING ACTUAL DATA
2) PLOTTING INTERPOLATED DATA
3) DATA WRITTEN TO A TEXT FILE
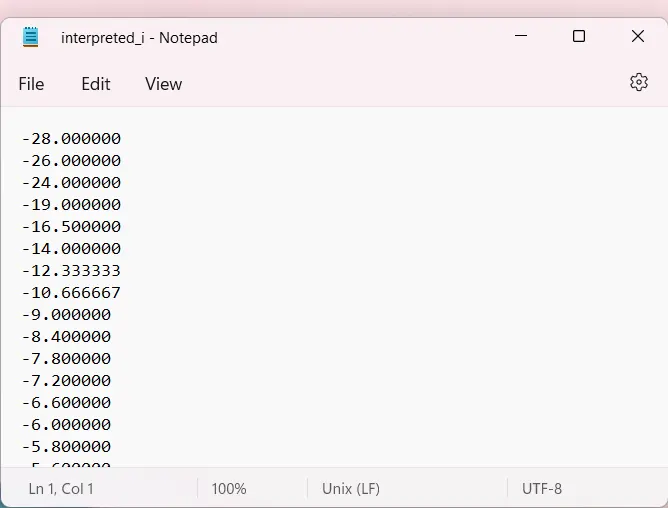
The missing data's are determined using interpolation and is written to a text file