Week 6 - Data analysis
Q) Take a look at the data analysis video before you attempt this challenge.
Your task is to write a script that does the following.
Data visualizer (100 points)
- Your script should take column numbers as the input and plot the respective columns as separate images
- Each file should be saved by the name of the column
- The plot labels should be extracted from the file. If, I request for a plot between column 1 (crank angle) and column 8(volume), then the label information should automatically be extracted and must appear as labels in the plots. THIS SHOULD NOT BE DONE MANUALLY
Compatability check (30 points)
- You code should exit gracefully, if a non-compatible file is provided as an input. It should say something like "File not recognized. Please provide a valid CONVERGE output file"
Basic performance calculation (50 points)
- Calculate the area under the P-V diagram. P is in column 2 and V is in column 8.
- Calculate the power output of this engine. Assume that RPM is 1500
- This engine consumed 20 micro grams of fuel (per 1 stroke cycle). Calculate its specific fuel consumption.
Ans:
Engine data analysis is a crucial aspect of understanding and optimizing the performance of internal combustion engines. By examining various parameters recorded during engine operation, such as crank angle, cylinder pressure, temperature, and volume, engineers can gain insights into the engine's behavior, efficiency, and areas for improvement.
Importance of Engine Data Analysis
Performance Optimization: Analyzing engine data helps in fine-tuning the engine for maximum efficiency and power output. By understanding the relationship between different parameters, adjustments can be made to improve fuel efficiency and reduce emissions.
Fault Diagnosis: Regular monitoring and analysis of engine data can help in early detection of potential issues. This proactive approach can prevent major failures and extend the engine's lifespan.
Design Improvements: Insights gained from data analysis can inform the design of future engine models, leading to innovations and enhancements in engine technology.
Compliance and Testing: Ensuring that engines meet regulatory standards for emissions and performance is another critical application of engine data analysis. It helps in verifying compliance and conducting rigorous testing.
Python code:
import sys
import math
import numpy as np
import matplotlib.pyplot as plt
crank = []
pressure = []
max_pres = []
min_pres = []
mean_temp = []
max_temp = []
min_temp = []
volume = []
mass = []
density = []
integrated_hr = []
hr_rate = []
c_p = []
c_v = []
gamma = []
kin_visc = []
dyn_visc = []
line_count = 1
# File path
file_path = 'engine_data.out'
# Check file compatibility using if-else
with open(file_path, 'r') as file:
first_line = file.readline()
if not first_line.startswith('#'):
print("File not recognized. Please provide a valid CONVERGE output file.")
sys.exit()
for line in open('engine_data.out'):
if '#' not in line:
crank.append(float(line.split()[0])) #Crank Angle
pressure.append(float(line.split()[1])) #Cylinder Pressure
max_pres.append(float(line.split()[2])) #Maximum Pressure
min_pres.append(float(line.split()[3])) #Minimum Pressure
mean_temp.append(float(line.split()[4])) #Mean Temperature
max_temp.append(float(line.split()[5])) #Maximum Temperature
min_temp.append(float(line.split()[6])) #Minimum Temperature
volume.append(float(line.split()[7])) #Cylinder Volume
mass.append(float(line.split()[8])) #Cylinder Mass
density.append(float(line.split()[9])) #Cylinder Density
integrated_hr.append(float(line.split()[10])) #Integrated Heat Release
hr_rate.append(float(line.split()[11])) #Heat Release Rate
c_p.append(float(line.split()[12]))#Specific Heat at Constant Pressure
c_v.append(float(line.split()[13])) #Specific Heat at Constant Volume
gamma.append(float(line.split()[14])) #Gamma
kin_visc.append(float(line.split()[15])) #Kinematic Viscosity
dyn_visc.append(float(line.split()[16])) #Dynamic Viscosity
# We convert the input from string to float so that
#we can do all arithemtic operations
line_count = line_count+1
# Initialize column labels
data_labels = [
"Crank Angle", "Cylinder Pressure", "Maximum Pressure", "Minimum Pressure",
"Mean Temperature", "Maximum Temperature", "Minimum Temperature", "Cylinder Volume",
"Cylinder Mass", "Cylinder Density", "Integrated Heat Release", "Heat Release Rate",
"Specific Heat at Constant Pressure", "Specific Heat at Constant Volume",
"Gamma", "Kinematic Viscosity", "Dynamic Viscosity",]
grouped_data=[crank, pressure, max_pres, min_pres, mean_temp, max_temp,
min_temp, volume, mass, density, integrated_hr, hr_rate, c_p, c_v, gamma,
kin_visc, dyn_visc ]
print(""""Plotting of Engine data, choose any two number from below:
1) Crank Angle 2)Cylinder Pressure 3) Maximum Pressure 4) Minimum Pressure
5) Mean Temperature 6) Maximum Temperature 7) Minimum Temperature 8) Cylinder Volume
9) Cylinder Mass 10) Cylinder Density 11) Integrated Heat Release 12) Heat Release Rate
13) Specific Heat at Constant Pressure 14) Specific Heat at Constant Volume
15) gamma 16) Kinematic Viscosity 17) Dynamic Viscosity """)
# Ask the user to enter a number
user_input_1=input('enter the first number:')
user_input_2=input('enter the second number:')
# Convert the input from string to float so that we can do all arithemtic operations
numb_1 = int(user_input_1)-1
numb_2 = int(user_input_2)-1
if 0 < numb_1 < 18 and 0 < numb_2 < 18:
x_data=grouped_data[numb_1]
y_data=grouped_data[numb_2]
plt.figure(figsize=(8, 6))
plt.plot(x_data,y_data)
plt.title("ENGINE DATA PLOT")
plt.xlabel(data_labels[numb_1])
plt.ylabel(data_labels[numb_2])
plt.show()
else:
print("Invalid entry")
sys.exit()
# Performance Calculations
work_done = np.trapz(pressure, volume) #area under the curve
# Calculate power output
RPM = 1500
power_output = (work_done * RPM / 120) #considering its a 4 stroke
# Calculate specific fuel consumption
fuel_consumption = 20e-6 # 20 micro grams per stroke
specific_fuel_consumption = (fuel_consumption * 60) / power_output # Convert to grams per kilowatt-hour
print(f"Area under the P-V diagram: {work_done}")
print(f"Power output: {power_output} Watts")
print(f"Specific fuel consumption: {specific_fuel_consumption} grams/kWh")
Explanation:
1) File compatibility is first checked, by checking if the provided file follows a basic pattern seen in our engine data output file.
2) An empty array of all the componets are first created.
3) The script checks if the file starts with a header line (indicated by #). If not, it prints an error message and exits. It reads data from the file, skipping header lines and extracting values into various lists (e.g., crank, pressure, volume).
4) All the empty arrays are appended with the corresponding values from engine data file.
5)We created data_labels and grouped_data, this is mainly done for plotting purpose. using this we can automate the plot so that we need not manually create individual plot.
6) The script prompts the user to select two columns by their indices for plotting. It generates a plot using matplotlib based on the selected columns and labels it automatically using predefined column labels.
7) Finally performance calculation is carried out
Results:
Run 1:
first number inputted: 5
second number inputted: 6
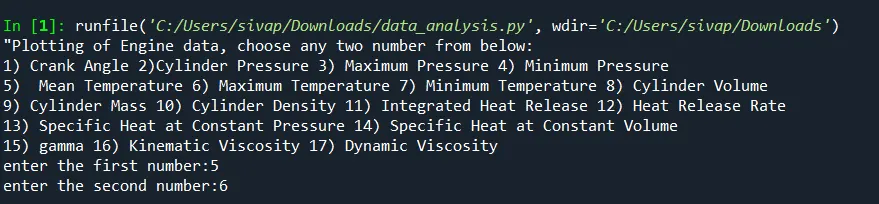

we can see that the area, power output and specific fuel consumption getting calculated.
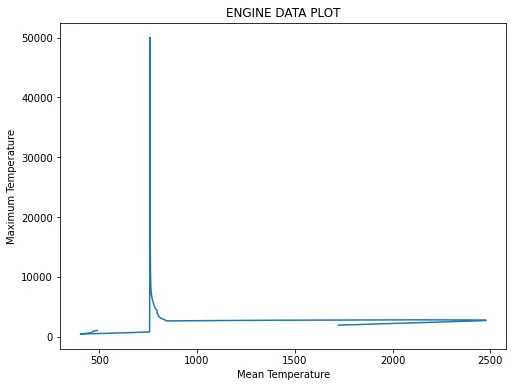
We got a plot of Mean temperature Vs Max temperature curve.
Run 2:
first number inputted: 12
second number inputted: 5
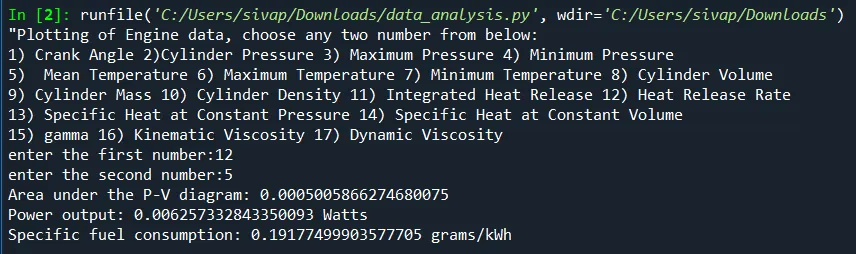
we can see that the area, power output and specific fuel consumption getting calculated.
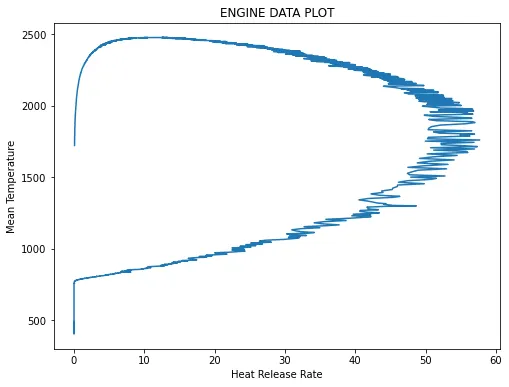
we got a Heat release rate Vs Mean temperature plot.
Run 3:
first number inputted: 10
second number inputted: 21
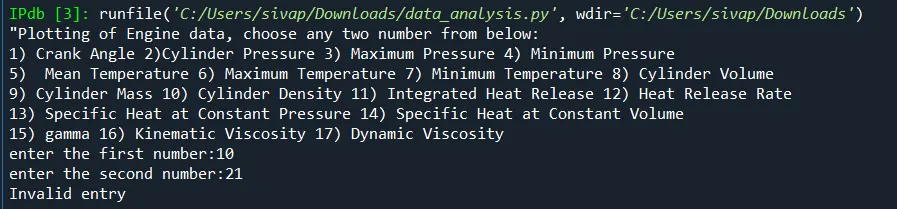
Since the second entered value, 21 is beyond the range, we can see that the output shows "invalid entry" and the program gets terminated.