Project 1 - Parsing NASA thermodynamic data
AIM: to File parse a NASA thermodynamic data and obtain plots for specific heat, enthalpy, entntropy of all the species and also calculate the molecular weight of species.
FILE PARSING
Parsing: Parsing a file means reading in a data stream and building a memory model of the content of that data.
Parsing splits a file or other input into pieces of data that can be easily stored or manipulated.
here we are reading values from a data file and taking in all the necessary values
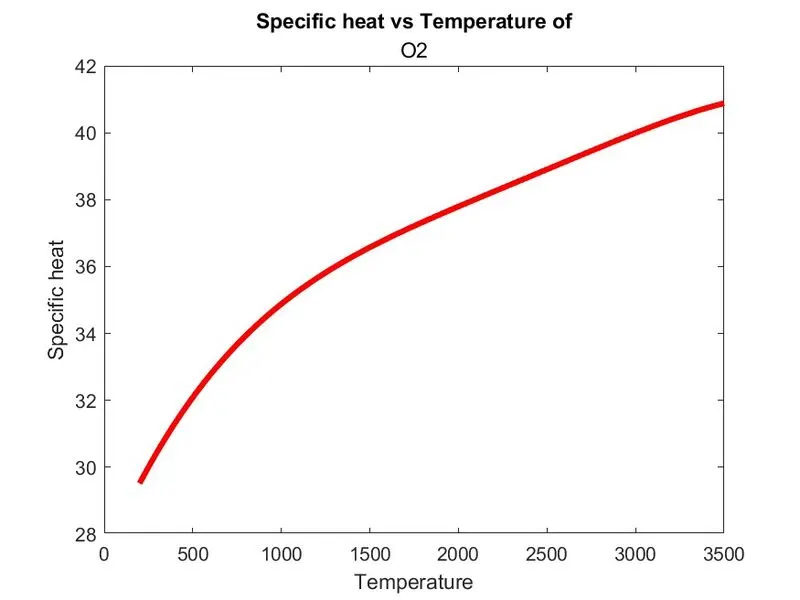
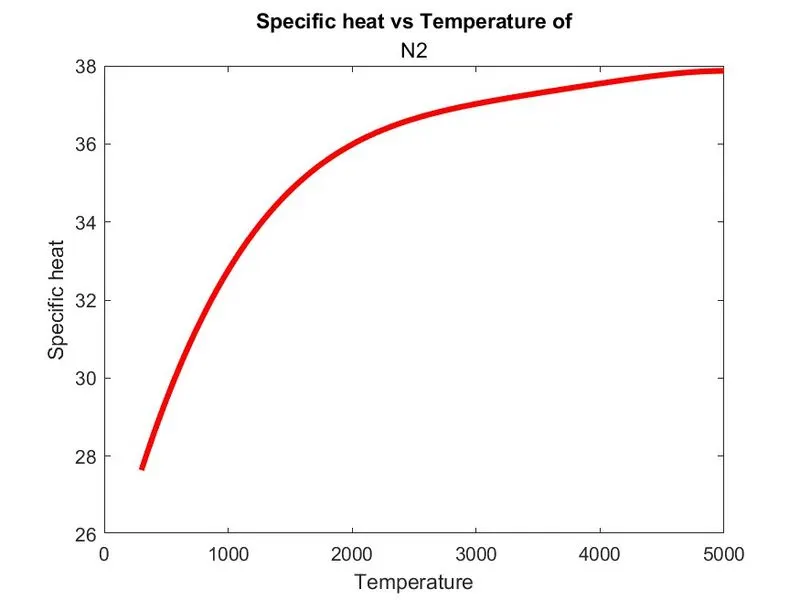
specific heat
The quantity of heat required to raise the temperature of one gram of a substance by one celcius degree
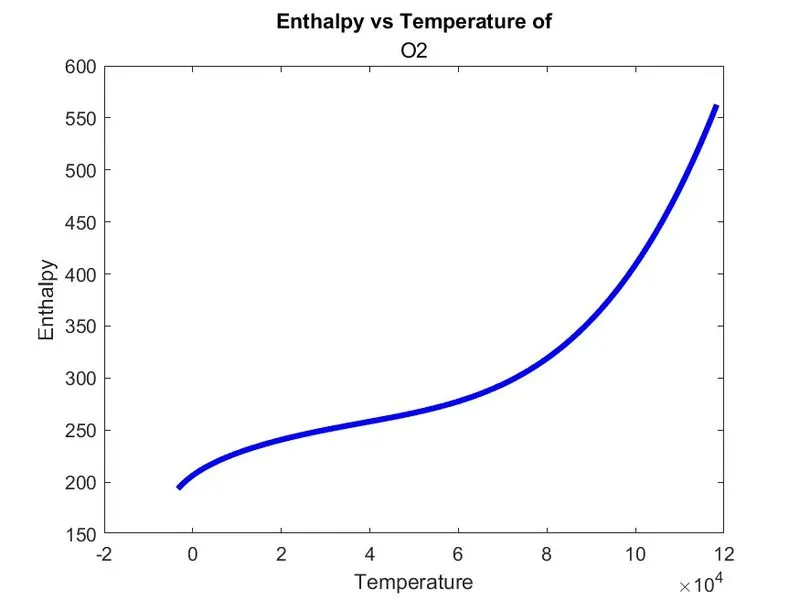
ENTHALPY
A thermodynamic quantity equivalent to the total heat content of a system. It is equal to the internal energy of the system plus the product of pressure and volume.
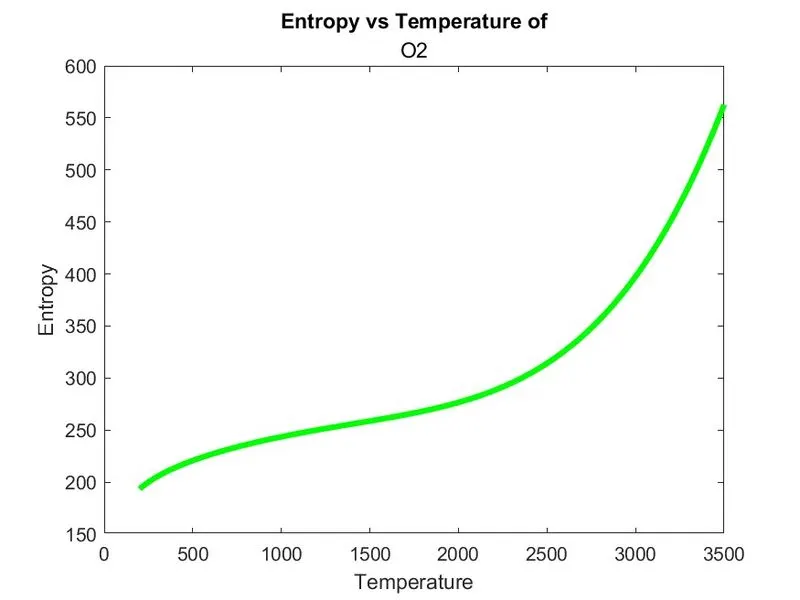
ENTROPY
The entropy of an object is a measure of the amount of energy which is unavailable to do work. Entropy is also a measure of the number of possible arrangements the atoms in a system can have. In this sense, entropy is a measure of uncertainty or randomness.
EQUATIONS USED

MOLECULAR WEIGHT
clear all
close all
clc
%opening the file
f1= fopen('THERMO.dat','r');
%using for loop to read 1st 5 lines

for i=1:5
 % fgetl reads lines from a file each
a=fgetl(f1);
end
for i=1:53
%getting first header line, which is a character with different data's
header_line=fgetl(f1);
%splitting the string based on the  delimiter
%our delimiter is space
a=strsplit(header_line,' ');

%we use curly bracket because it is characters
%1st cell of a represents the species
species=a{1};
%local lower, medium, higher temperatures, we are converting string to number
llt=str2double(a{end-3});
lmt=str2double(a{end-1});
lht=str2double(a{end-2});
T=linspace(llt,lht,500);
%getting species with exponential coefficent
line1=fgetl(f1);
% finding the location of Exponent(E)
e1=strfind(line1,'E');
%we are converting string to number
a1=str2double(line1(1:e1(1)+3));
a2=str2double(line1(e1(1)+4:e1(2)+3));
a3=str2double(line1(e1(2)+4:e1(3)+3));
a4=str2double(line1(e1(3)+4:e1(4)+3));
a5=str2double(line1(e1(4)+4:e1(5)+3));
line2=fgetl(f1);
e2=strfind(line2,'E');
a6=str2double(line2(1:e2(1)+3));
a7=str2double(line2(e2(1)+4:e2(2)+3));
a8=str2double(line2(e2(2)+4:e2(3)+3));
a9=str2double(line2(e2(3)+4:e2(4)+3));
a10=str2double(line2(e2(4)+4:e2(5)+3));
line3=fgetl(f1);
e3=strfind(line3,'E');
a11=str2double(line3(1:e3(1)+3));
a12=str2double(line3(e3(1)+4:e3(2)+3));
a13=str2double(line3(e3(2)+4:e3(3)+3));
a14=str2double(line3(e3(3)+4:e3(4)+3));

r=8.314;
%calling functions for specific heat enthalpy and entropy
[cp]=specific_heat(a1,a2,a3,a4,a5,a8,a9,a10,a11,a12,T,lmt,r);
[H]=enthalpy(a1,a2,a3,a4,a5,a6,a8,a9,a10,a11,a12,13,T,lmt,r);
[S]=entropy(a1,a2,a3,a4,a5,a7,a8,a9,a10,a11,a12,a14,T,lmt,r);

%creating new folder for individual species(as for loop executes)
mkdir(species)
%changing current folder
 cd(species)
 %Plot 1
figure(1)
plot(T,cp,'linewidth',3,'color','r')
xlabel('Temperature')
ylabel('Specific heat')
title('Specific heat vs Temperature of', sprintf('%s',species))
%saveas saves figure to a specific format
saveas(figure(1),'Cp VS T.jpg' )
 %Plot 2
figure(2)
plot(H,S,'linewidth',3,'color','b')
xlabel('Temperature')
ylabel('Enthalpy')
title('Enthalpy vs Temperature of', sprintf('%s',species))
saveas(figure(2),'H VS T.jpg')
 %Plot 3
figure(3)
plot(T,S,'linewidth',3,'color','g')
xlabel('Temperature')
ylabel('Entropy')
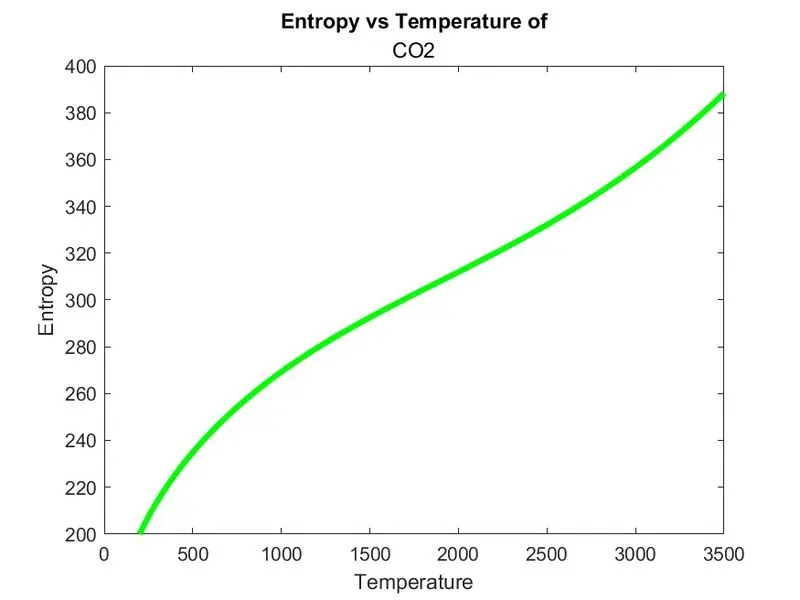
title('Entropy vs Temperature of', sprintf('%s',species))
saveas(figure(3),'S VS T.jpg' )
% returning back to initial directory
 cd ..
total_weigth=mol_wt(species);
end
%calling function for molecular weight
M = mol_wt(species);
MATAB FUNCTION
SPECIFIC HEAT
function [cp] = specific_heat(x1,x2,x3,x4,x5,x8,x9,x10,x11,x12,temp,lmt,const_R)
%first 7 coefficents are high temp coefficents the next 7 are low
%coefficents
if temp<=lmt

        cp=(x8+(x9*temp)+(x10*temp.^2)+(x11*temp.^3)+(x12*temp.^4))*const_R;

else
        cp=(x1+(x2*temp)+(x3*temp.^2)+(x4*temp.^3)+(x5*temp.^4))*const_R;
end
end
ENTHALPY
function [H]= enthalpy(x1,x2,x3,x4,x5,x6,x8,x9,x10,x11,x12,x13,temp,lmt,const_R)
%first 7 coefficents are high temp coefficents the next 7 are low
%coefficents
if temp<=lmt
    H= (x8+(x9*(temp/2))+(x10*(temp.^2/3))+(x11*(temp.^3/4))+(x12*(temp.^4/5))+(x13./temp)).*temp*const_R;
else
    H= (x1+(x2*(temp/2))+(x3*(temp.^2/3))+(x4*(temp.^3/4))+(x5*(temp.^4/5))+(x6./temp)).*temp*const_R;
end
end
ENTROPY
function [S]= entropy(x1,x2,x3,x4,x5,x7,x8,x9,x10,x11,x12,x14,temp,lmt,const_R)
%first 7 coefficents are high temp coefficents the next 7 are low
%coefficents
if temp>=lmt
    S=(x1*log(temp)+x2*temp+x3*(temp.^2/2)+x4*(temp.^3/3)+x5*(temp.^4/4)+x7)*const_R;
else
     S=(x8*log(temp)+x9*temp+(x10*(temp.^2)/2)+(x11*(temp.^3)/3)+(x12*(temp.^4)/4)+x14)*const_R;
end
end
MOLECULAR WEIGHT
function [wt]=mol_wt(species_name)
%elents common to the file
element=['H','O','C','N','Ar'];
%atomic weigth of the above elements
element_wt=[1.00784,15.999,12.011,14.0067,39.948];
%initial weight
wt=0;
%using for loop to compare the weight and add up the weight
for i=1:length(species_name)
    for j=1:length(element)

        tf=strcmp(species_name(i),element(j));
        if tf==1
            wt=wt+element_wt(j);
            position=j;
        end
     end
%coverting the string to number to get number suffix and adding up the
%molecular weight
n=str2num(species_name(i));
if n>1
     wt=wt+element_wt(position)*(n-1);
     % %s represents the character vector (letters) and %f represent the fixed point
     % notation(numbers)
       fprintf('the molecular weigth of %s=%f ',species_name,wt)
       disp('  ')
end
end
end
EXPLANATION
MAIN PROGRAM
First we open thermo.dat file using file open command, we use fgetl command to read the whole data. initially a loop to read 1st 5 lines and later another loop to read the data for 53 elements.
Header line contains species name and upper, lower and medium tempeature. we split the line using strsplit command splits a line at a specific delimiter and delimiter we use here is space (' '). To get 500 temperature values we use linespace command. To extract 14 data values of individual species we use strfind function to find the location of E (exponent). based on location of E, 14 data values are sorted out, then we call the functions and plot Specific heat, Entropy and Enthalpy VS temp.
If we dont create a seperate folder all the plots will be saved in a single file. mkdir command is used to create a new folder and cd command is used to change the current folder location and cd . . command helps to return to intial directory.
FUNCTION
Molecular weight function:
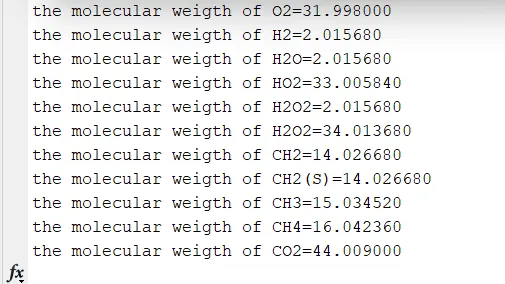
5 elements and their corresponding atomic weigths are stored in an array and compared with the molecules, if condition is true the molecular weight of elements gets added using for loop. for molecules having number as suffiux if loop is used to compute the molecular weigth. fprint command is used to print the molecular weight.
Specific heat, enthalpy, enthropy function calculations are based on equation attached at the starting. First 7 coefficents are high temp coefficents the next 7 are low temperature coefficents
ATTACHMENTS
1) SS of all the folders getting saved

2) Plot of O2
a) Cp vs temp
b) H vs temp
c) S vs temp
2) Plot of N2
a) Cp vs temp
a) H vs temp
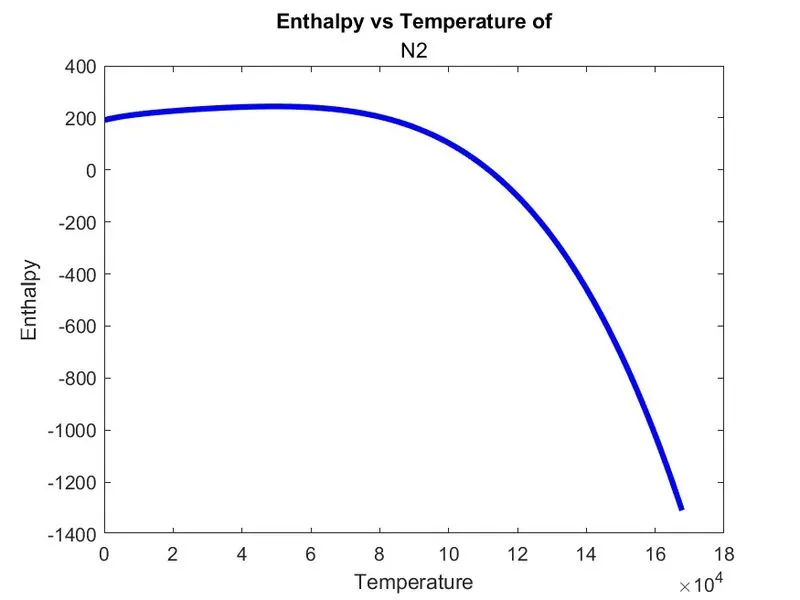
a) S vs temp
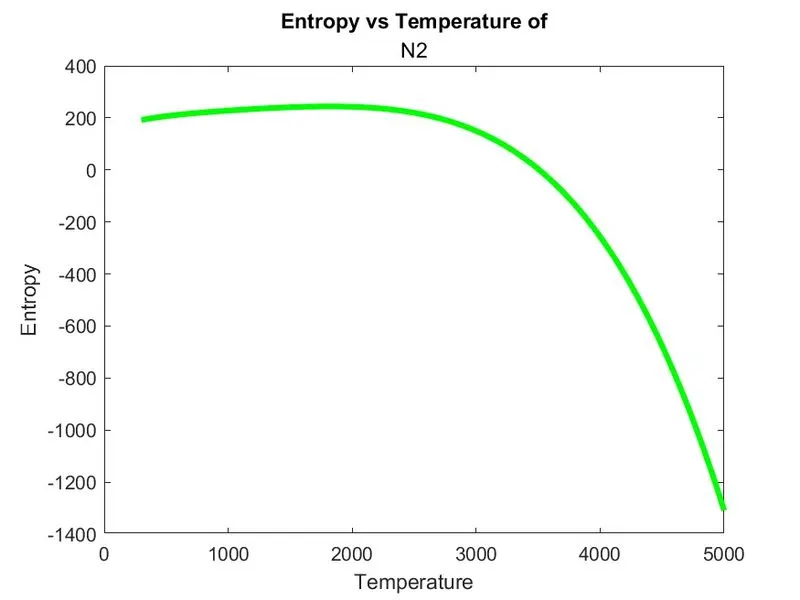
3) Plot of CO2
a) Cp vs temp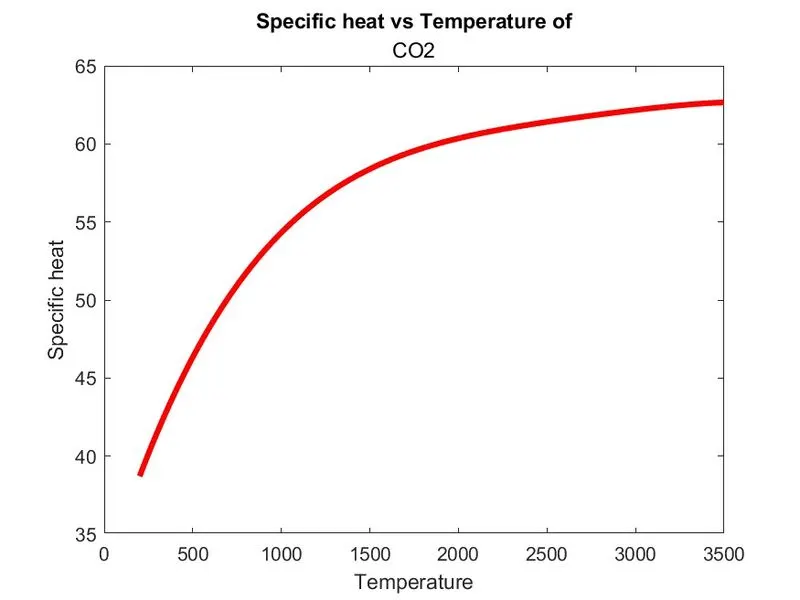
a) H vs temp
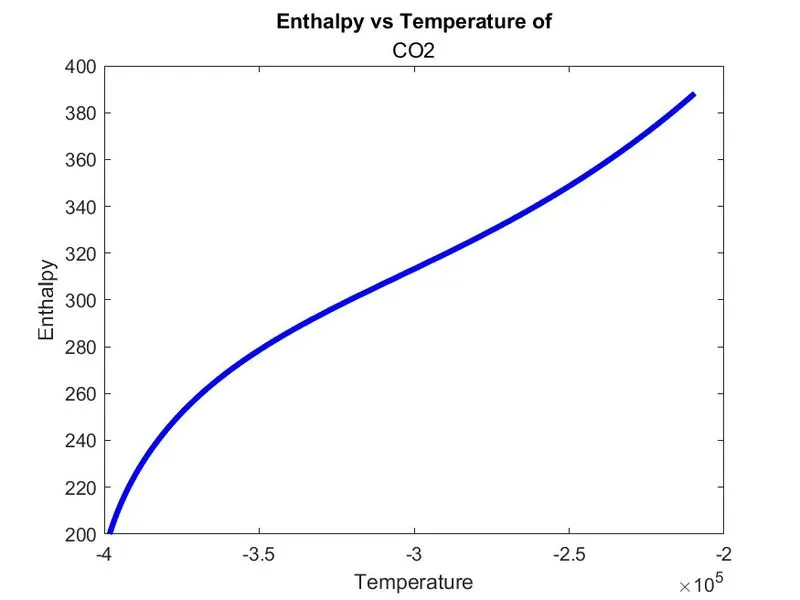
a) S vs temp
4) SS of Molecular weight displayed on command window
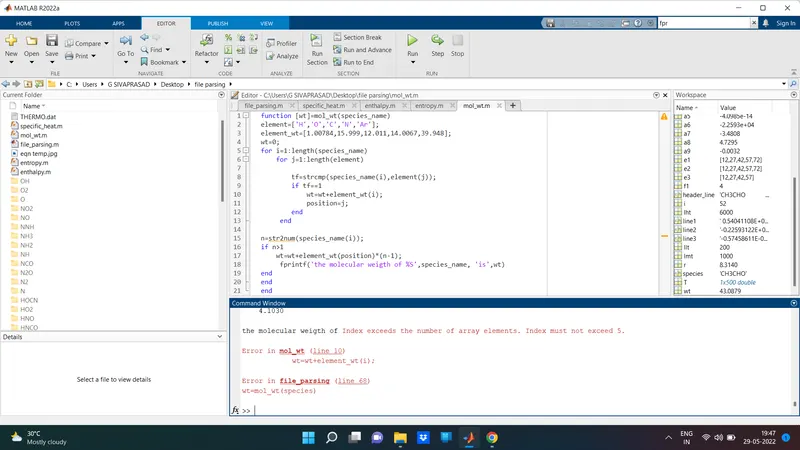
ERRORS FACED
 \
\
In molecular weigth function i have given