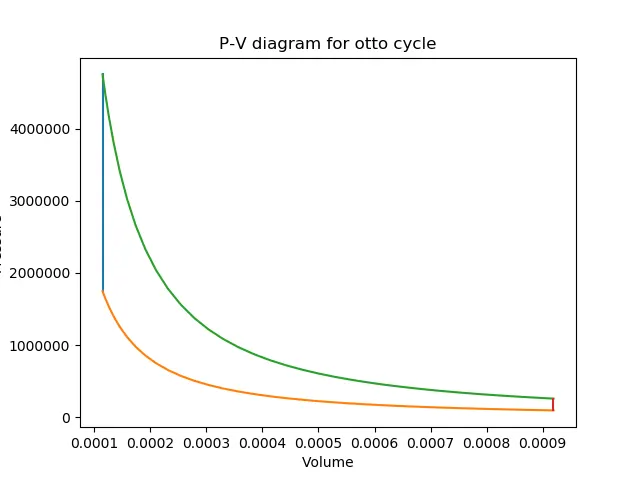
Week 2 Air standard Cycle
Aim :
Your code should create a PV diagram
Your should output the thermal efficiency of the engine.
Solution :
The code for the PV diagram is as follows :
import math
import  matplotlib.pyplot as plt


#inputs
p1=101325
t1=500
gamma=1.4
t3=2300

#Geometric dimensions :

bore=0.1
stroke=0.1
con_rod=0.15
cr=12

#volume computation
v_s=(math.pi/4)*pow(bore,4)
v_c= v_s/(cr-1)
v1=v_c+v_s

print(v_s)

#state point 2

v2=v_c

# p2v2^gamma =p1v1^gamma
p2=p1*pow(v1,gamma)/pow(v2,gamma)

rhs=p1*v1/t1

t2= p2*v2/rhs

print(t2)

#state point 3

v3=v2

rhs=p2*v2/t2
p3=rhs*t3/v3

#State 4

v4=v1

p4 =p3*pow(v3,gamma)/pow(v4,gamma)

plt.plot([v1,v2,v3,v4,v1],[p1,p2,p3,p4,p1])
plt.show()
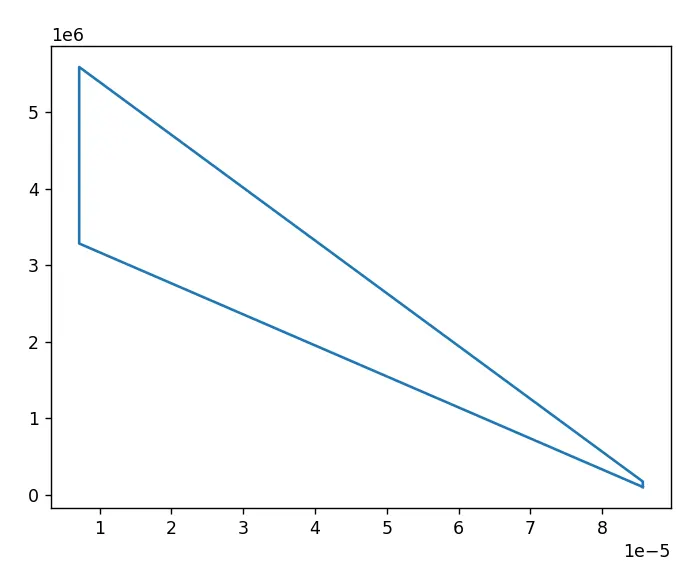
We get the following graph :
The thermal efficiency is given by the following :
 def enginekinematics(bore,stroke,con_rod,cr,start_crank,end_crank):
     #inputs
    p1=101325
    t1=500
    gamma=1.4
    t3=2300
     a=stroke/2
     R=con_rod/a
     sc=math.radians(start_crank)
     ec=math.radians(end_crank)
     n=10
      dth=end_crank-start_crank/(n-1)
      v_s=(math.pi/4)*pow(bore,4)
      v_c= v_s/(cr-1)
      v1=v_c+v_s
        V=[]
         for i in range(0,n):
         theta=sc + i*dth
         th1=0.5*(cr-1)
         th2=R + 1 - math.cos(theta)
         th3=pow(R,2) - pow(pow(math.sin(theta),2),0.5)
         th3=pow(th3,0.5)
         V.append((1+th1*(th2-th3))*v_c)
         print(V)
         return(V)


#inputs
p1=101325
t1=500
gamma=1.4
t3=2300

#Geometric dimensions :

bore=0.1
stroke=0.1
con_rod=0.15
cr=12

#volume computation
v_s=(math.pi/4)*pow(bore,4)
v_c= v_s/(cr-1)
v1=v_c+v_s

print(v_s)

#state point 2

v2=v_c

# p2v2^gamma =p1v1^gamma
p2=p1*pow(v1,gamma)/pow(v2,gamma)

rhs=p1*v1/t1

t2= p2*v2/rhs
vcompression=enginekinematics(bore,stroke,con_rod,cr,180,0)
constant=p1*pow(v1,gamma)

P_compression=[]
for v in vcompression:
    P_compression.append(constant/pow(v,gamma))

print(t2)

#state point 3

v3=v2

rhs=p2*v2/t2
p3=rhs*t3/v3

#State 4

v4=v1

p4 =p3*pow(v3,gamma)/pow(v4,gamma)

plt.plot([v1,v2,v3,v4,v1],[p1,p2,p3,p4,p1])
plt.show()
We get the following :