Week - 4
1.Implement control logic of a “washing machine” using Stateflow as per given sequence:
- If the power supply is available, the system gets activated
- If the Water supply is not available, stop the process & indicate through LED
- Soaking time should be 200s followed by Washing time of 100s.
- Then rinsing happens for next 20s & dryer runs for 50s
After all the processes have completed turn on the finished LED
AIM:
To Implement control logic of a washing machine using Stateflow.
Explanation of Blocks:
Blocks Used:
In this model 4 blocks are used & they are as follows-:
- State
- Constant
- Display
- Lamp
- State:
A state describes an operating mode of a reactive system. In a Stateflow chart, states are used for sequential design to create state transition diagrams.
ii. Constant:
The Constant block generates a real or complex constant value signal. Use this block to provide a constant signal input. The block generates scalar, vector, or matrix output.
iii. Display:
The Display block shows the value of the input data. You can specify the frequency of the display. For numeric input data, you can also specify the format of display.
If the block input is an array, you can resize the block vertically or horizontally to show more than just the first element. If the block input is a vector, the block sequentially adds display fields from left to right and top to bottom. The block displays as many values as possible. A black triangle indicates that the block is not displaying all input array elements.
The Display block shows the first 200 elements of a vector signal and the first 20 rows and 10 columns of a matrix signal.
iv. Lamp:
The Lamp block displays a color to indicate the value of the input signal. You can use the Lamp block with other Dashboard blocks to build an interactive dashboard of controls and indicators for your model. You can specify pairs of input values and colors to provide the information you want during simulation.
Explanation of the Model:
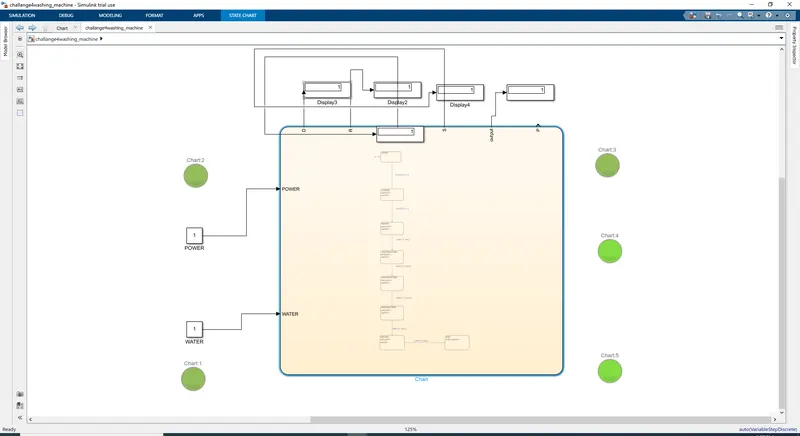
- Intially we have to create all the 8 process using state blocks.
- Starting from start.
- The second state block is Power to switch ON the washing machine.
- Then Water should be filled in the washing machine Water state block is used.
- The 4th process is to Soak where Soak state block is used & time given to soak is 200sec.
- After soaking, Washing state block is used & time given to wash is 100sec.
- Then Rinsing state block is used & time given to rinse is 20sec.
- Finally Dryer state block is used to dry & time given to dry is 50sec.
- Then End the process
- Use 2 Constant Blocks for Power & Water.
- 5 Display blocks are used to show the Results which are connected to all the state blocks connections.
- Then 5 lamps are used to glow.
- If the model is correct then 1 will be displayed in display block as lamp glows as green.
- If the model is wrong then 0 will be displayed in display block as lamp glows as orange.
- The model is given above & results given are correct.
2. Make a Simulink chart for the “Gear shift” logic as per below conditions:
Speed Range(kmph) Gear
0 to 15 1
16 to 25 2
26 to 40 3
41 to 60 4
Above 61 5
Give speed input while the simulation is running & display the gear number.
AIM:
TO make a simulink chart for the Gear shift.
Explanation OF blocks :
Block used:
- State
- Constant
- Display
- Slider
- Scope
State :
A state describes an operating mode of a reactive system. In a Stateflow chart, states are used for sequential design to create state transition diagrams.
Constant:
The Constant block generates a real or complex constant value signal. Use this block to provide a constant signal input. The block generates scalar, vector, or matrix output.
Display:
The Display block shows the value of the input data. You can specify the frequency of the display. For numeric input data, you can also specify the format of display.
If the block input is an array, you can resize the block vertically or horizontally to show more than just the first element. If the block input is a vector, the block sequentially adds display fields from left to right and top to bottom. The block displays as many values as possible. A black triangle indicates that the block is not displaying all input array elements.
The Display block shows the first 200 elements of a vector signal and the first 20 rows and 10 columns of a matrix signal.
Slider:
The Slider block tunes the value of the connected block parameter during simulation. For example, you can connect the Slider block to a Gain block in your model and adjust its value during simulation. You can modify the range of the Slider block's scale to fit your data. Use the Slider block with other Dashboard blocks to create an interactive dashboard to control your model.
Scope:
Display signals generated during simulation.
Expalnation of the Model:
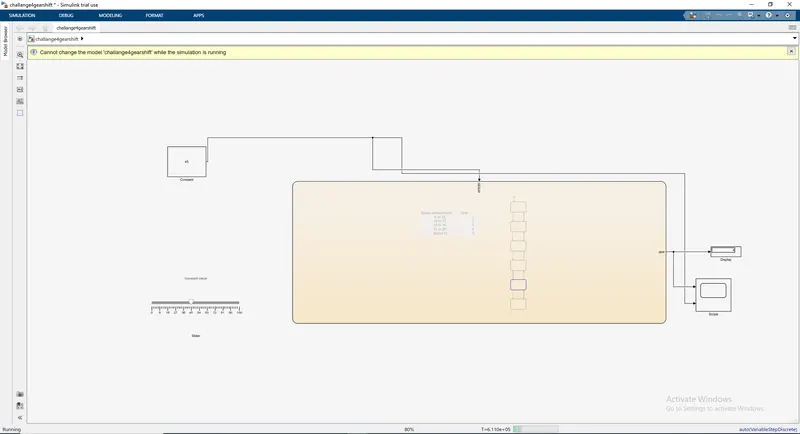
- Intially use 6 State blocks starting from starting from start to gear 5 as given in the question.
- 1 Constant block is used to connect to the chart.
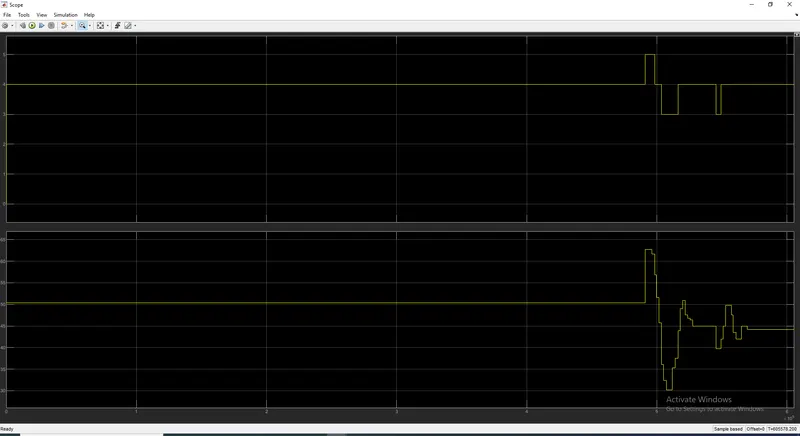
- From constant block is also connected to scope to give the Result.
- The chart is also connected to the display to show the gear in which the vechile is running.
- The slider block is given to adjust the speed according to which the simulation Results are obtained.
Conclusion:
A control logic of a washing machine using Stateflow is impleted & Simulink chart for the Gear shift as per given conditions has been implemented.