Week 9 - Senstivity Analysis Assignment
Aim:-
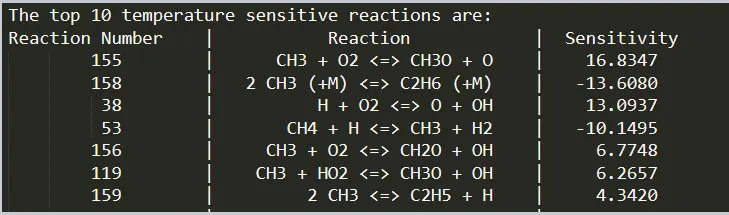
The aim is to find the sensitivity with respect to the temperature from the GRI mechanism by taking all the reactions and calculating the 10 most sensitive reactions.
Sensitivity Theory:-
Sensitivity analysis is the study of the change of the dependent variable with respect to the independent variable.
Sensitivity = ∂y/∂x
In a reaction mechanism, the change of value of parameters is different for different reactions, which means that the parameters are sensitive to some reactions and insensitive (relatively) to some other reactions. There are several reasons for which this happens, as the products and the energy liberated with each reaction are different.
This is done by finding the slope at each time step, for each reaction. The sensitivity value can be negative too, which means that the slope is negative which implies that increase in the independent variable and a decrease in the dependent variable.
Coding Approach:-
- Instantiate a gas object using Solution in Cantera for GRI mech File.
- Temperature, pressure and Mole Fraction of mixture is assigned using gas.TPX.
- An object r is created using gas object in IdealGasConstPressureReactor, which specify the equation to be solved for the species such as species equation and energy equation. There is other reactor as well, which is used in specific conditions prescribed for it such as IdealGasConstantVolume reactor, constant volume reactor, constant pressure reactor etc.
- A reactor Network is setup using r as input and named sim.
- Respective Tolerances are set.
- Attributes of Solution Array from Cantera is grouped as an instance of states with the addition of Time in milliseconds.
- A for loop is set and values are calculated for a specific Time period using the Advance command.
- For each time loop sensitivity of each reaction is calculated and the max sensitivity is saved is s_max.
- states are appended for each time loop.
- Reactions are shorted in descending order according to s_max and both values are stored and plotted as required
Python code:-
import numpy as np
import matplotlib.pyplot as plt
import cantera as ct
import sys

gas = ct.Solution('gri30.xml')
T = 1500
P = ct.one_atm

gas.TPX = T,P,{'CH4':1, 'O2':2, 'N2':7.52}
r = ct.IdealGasConstPressureReactor(gas, name = 'R1')
sim = ct.ReactorNet([r])
reactions = gas.reaction_equations()

# Extracting and adding reactions from mechanism to sensitivity analysis

n = gas.n_reactions           # Number of reactions in the reaction mechanism
r_nos = (np.linspace(1,n,n))
N = 10

for i in range(n):
	r.add_sensitivity_reaction(i)

# Set the tolerance for the solution and sensitivity analysis

sim.rtol = 1.0e-6   # Relative change in solution should be less than this value
sim.atol = 1.0e-15  # Absolute change in solution should be less than this value

sim.rtol_sensitivity = 1.0e-6   # Relative change in sensitivity should be less than this value
sim.atol_sensitivity = 1.0e-6  # Absolute change in sensitivity should be less than this value

s_max = [0]*n

states = ct.SolutionArray(gas, extra = ['t'])

for t in np.arange(0, 2e-3, 5e-6):
	sim.advance(t)
	states.append(r.thermo.state, t=1000*t)

	for j in range(n):
		s = sim.sensitivity('temperature',j)

		if abs(s) >= abs(s_max[j]):
			s_max[j] = s

# Ordering the reactions

reactions = [r for s, r in sorted(zip(np.abs(s_max),reactions), reverse=True)]
r_nos = [r for s, r in sorted(zip(np.abs(s_max),r_nos), reverse=True)]
s_max = [s for abs_s, s in sorted(zip(np.abs(s_max),s_max), reverse=True)]

# Extracting top 10 reactions

rplot = reactions[0:N]
r_nos_plot = r_nos[0:N]
splot = s_max[0:N]

# Printing

print("The top %d temperature sensitive reactions are:" % (N))
print("%8s %4s %18s %12s %12s" % ('Reaction Number','|','Reaction','|','Sensitivity'))

for i in range(N):
	print("%11d %8s %26s %4s %10.4f" %(r_nos_plot[i],'|',rplot[i],'|',splot[i]))


# Plotting

fig1, ax1 = plt.subplots()
y_pos = np.arange(len(rplot))
ax1.set_axisbelow(True)
ax1.barh(y_pos, splot, 0.5, align='center', color='blue')
ax1.set_yticks(y_pos)
ax1.set_yticklabels(rplot, rotation = 0, fontweight='bold')
ax1.invert_yaxis()
xticks = [-20, -15, -10, -5, 0, 5, 10, 15, 20]
ax1.set_xlabel('Temperature sensitivity')
plt.title('10 most sensitive reactions for the GRI 3.0 mechanism')
plt.tight_layout()
plt.show()

fig2, ax2 = plt.subplots(2,2)
plt.subplot(2,2,1)
plt.plot(states.t,states.T)
plt.xlabel('Time (ms)')
plt.ylabel('Temperature (K)')
plt.subplot(2,2,2)
plt.plot(states.t,states('OH').X)
plt.xlabel('Time (ms)')
plt.ylabel('OH Mole fraction')
plt.subplot(2,2,3)
plt.plot(states.t,states('H').X)
plt.xlabel('Time (ms)')
plt.ylabel('H Mole fraction')
plt.subplot(2,2,4)
plt.plot(states.t,states('CH4').X)
plt.xlabel('Time (ms)')
plt.ylabel('CH4 Mole fraction')
plt.tight_layout()
plt.show()Result:-
Output Graphs:-
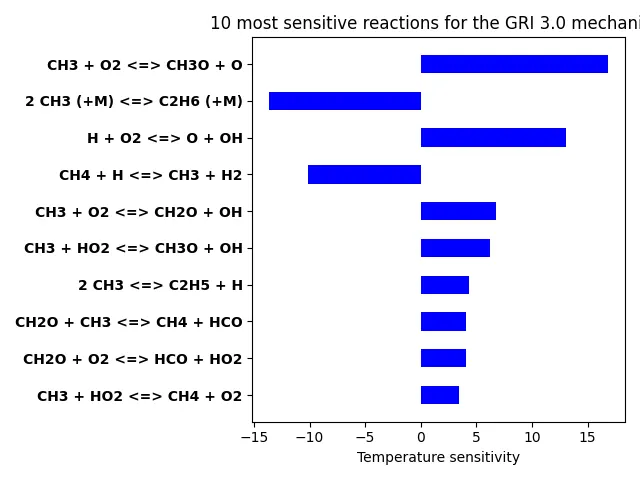
Figure(1): Top 10 most sensitive reactions
If the sensitivity value is positive, which means that the temperature increases the rate of reactions also increases , and vice versa if the value is negative.
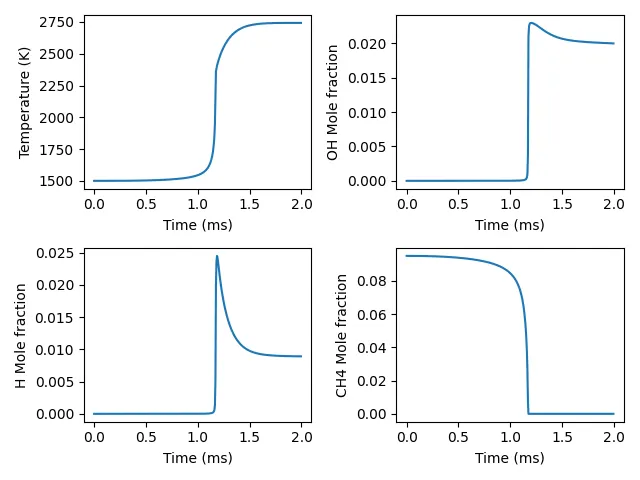
Figure(2): change in parameters with respect to time in milliseconds
The ignition delay is quite large when the temperature is 1500K. Once, the temperature starts to increase, the ignition delay will be reduced. The concentration of each species is varying with respect to time.
Conclusion:-
The most sensitive reaction to temperature is ‘CH3 + O2 <=> CH3O + O’ with a sensitivity coefficient of 16.834.