Week 5: Prandtl Meyer Shock problem
Shock Flow
It is a sudden change in flow variables (pressure, temperature, velocity, density, etc.). A shock wave occurs when all the built up pressure in a supersonic flow is released at a point where flow is subsonic, such as behind an aircraft, etc. The flow variables change drastically after the nexus between super and subsonic flow
Shock waves can be used to compress gases in supersonic flow, though they are not efficient enough for widespread use. An isentropic method is the Prandtl-Meyer Expansion fan, where supersonic flow expands whe the flow comes across a convex corner as seen in the image below:
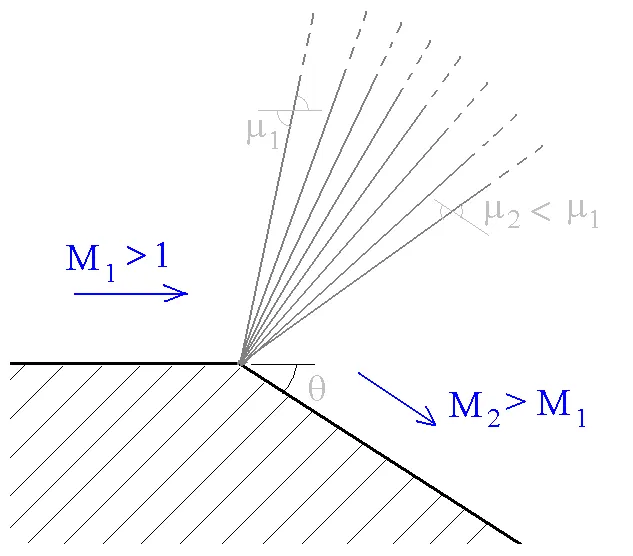
Across the expansion fan, the flow accelerates (velocity increases) and consequently Mach Number increases, while the static pressure, temperature and density decrease. All of these changes occur rapidly across the expansion fan region.
Boundary Conditions for Shock Flow
Normally, Dirichlet boundary conditions are used for flow problems. This condition specifies the value of the variable at the boundary. This is not possible for supersonic flow, as static pressure is only used for subsonic flow. Hence, we use another type of boundary condition for supersonic flow.
It is called the Neumann boundary condition, it denotes the values of the derivative applied at the boundary of the domain. This boundary condition's value can be either zero or non-zero. Zero gradient indicates there is no change across that particular domain. This boundary condition is used in flux problems (magnetic or heat flux).
In this project, I will be simulating the prandtl-meyer expansion fan in converge cfd. I will also be taking a look at the effects of the sub-grid criterion/scale (SGS) parameter and if the same phenomenon occurs in subsonic flow.
Geometry Creation
The geometry can either be created manually using converge or it can also be imported from another CAD software, in my case I imported the simple geometry.
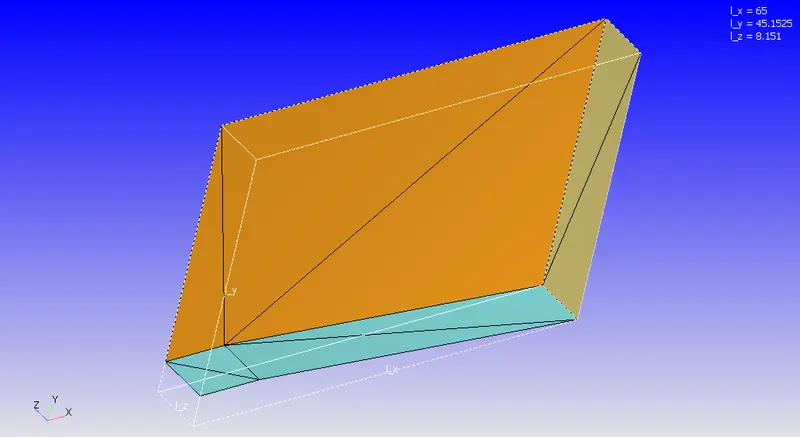
Do note that converge requires all geometry to be in metres, hence transformation may be required if the geometry was exported as millimetres (mm). This is the final geometry seen in converge.
Boundary
Case Setup
Now, on to the case setup tab:
Application Type
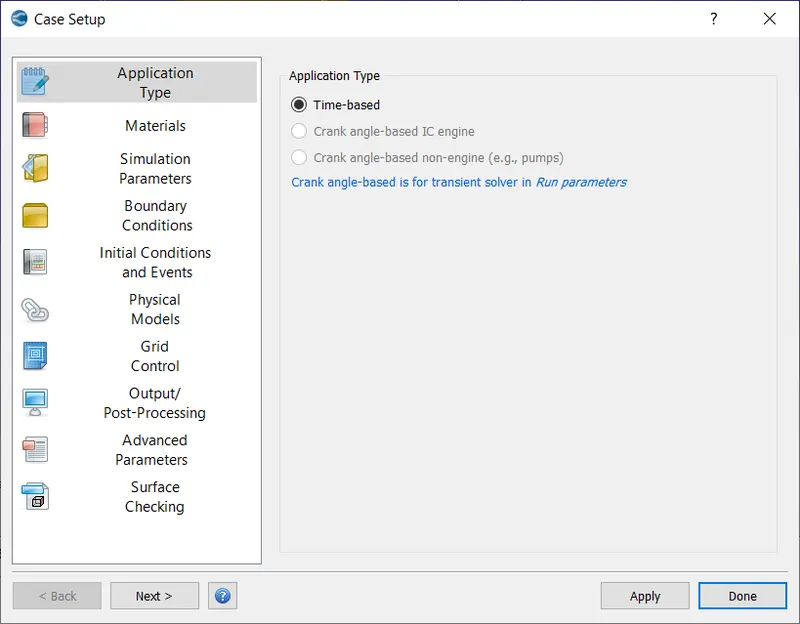
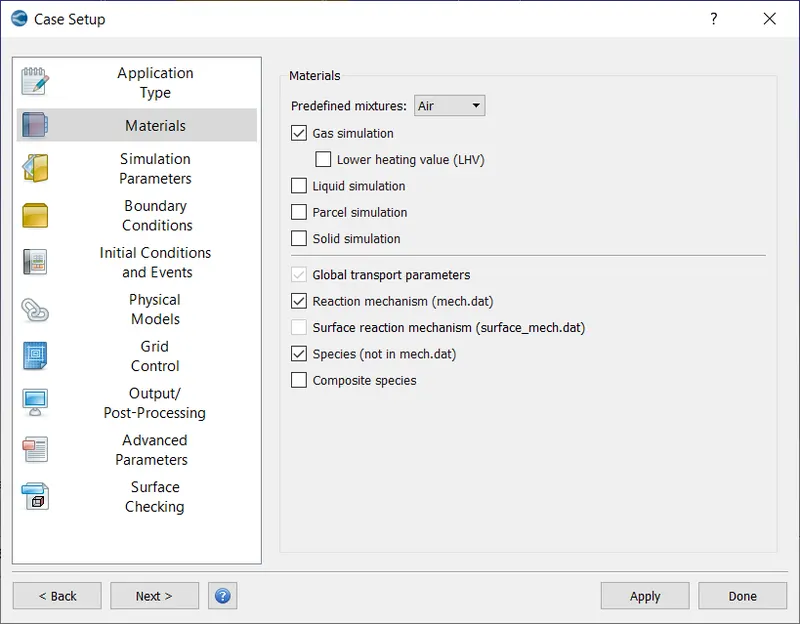
Materials: Gas Simulation, Global Transport Parameters and Reaction Mechanisms were set to default. In species, O2 and N2 were added.
Simulation Parameters
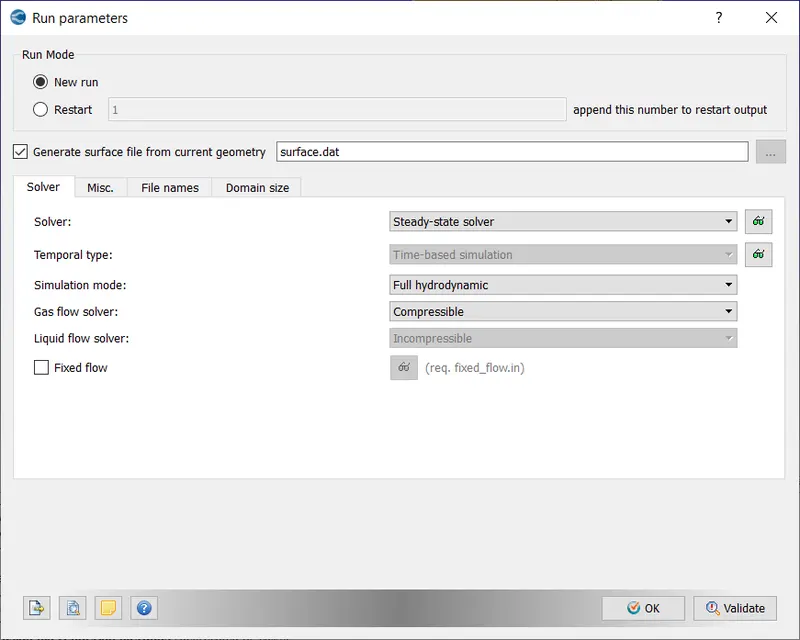
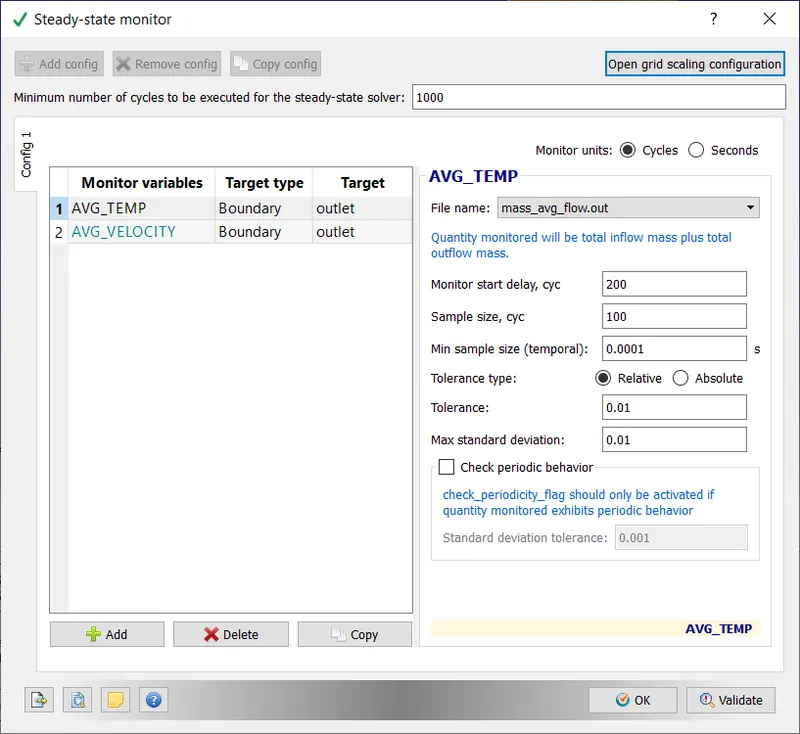
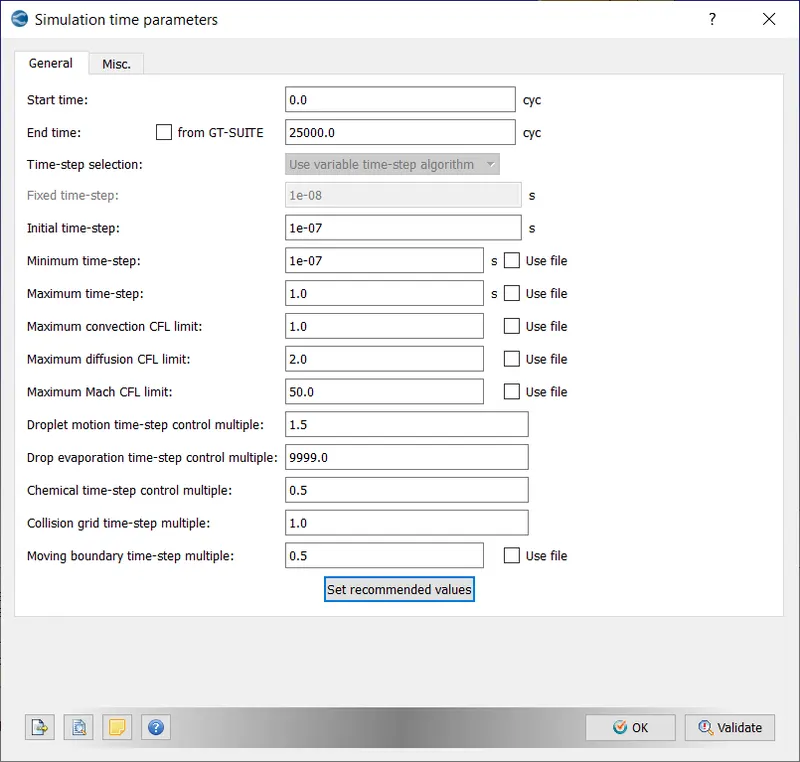
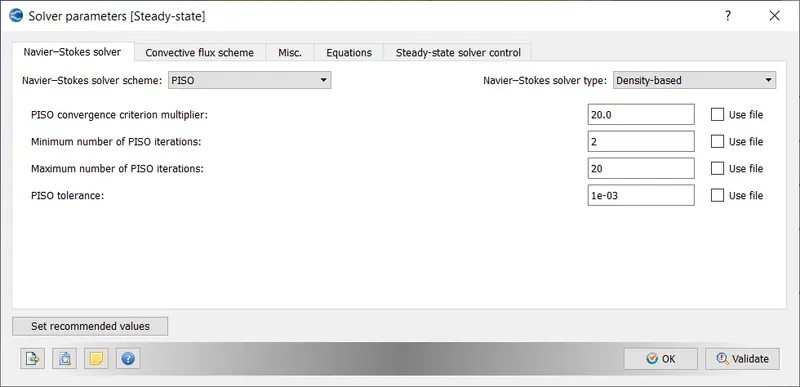
Note: a maximum convection CFL limit is required else the solution will never converge.
Boundary Conditions
Inlet: Velocity of 680m/s in the x axis, Temperature of 286.1K. Mach number is roughly 2, rest were set to zero normal gradient
Outlet: all were set to zero normal gradient
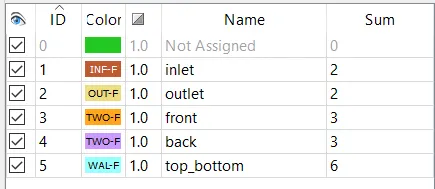
fron and back: TWO_D
top_bottom: wall with slip
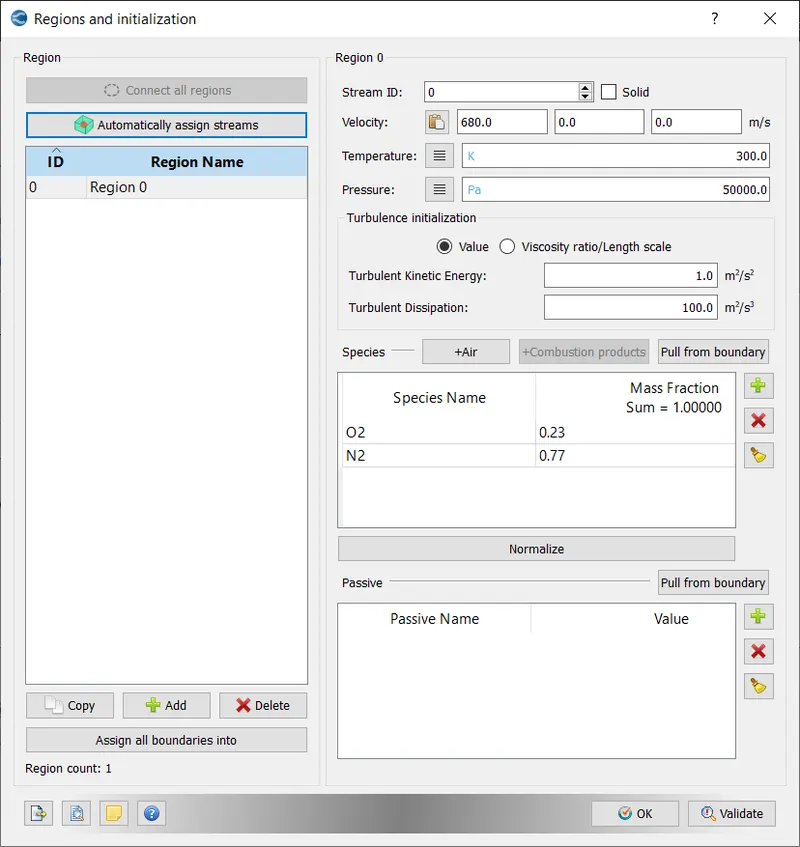
Initial Conditions
Physical Models
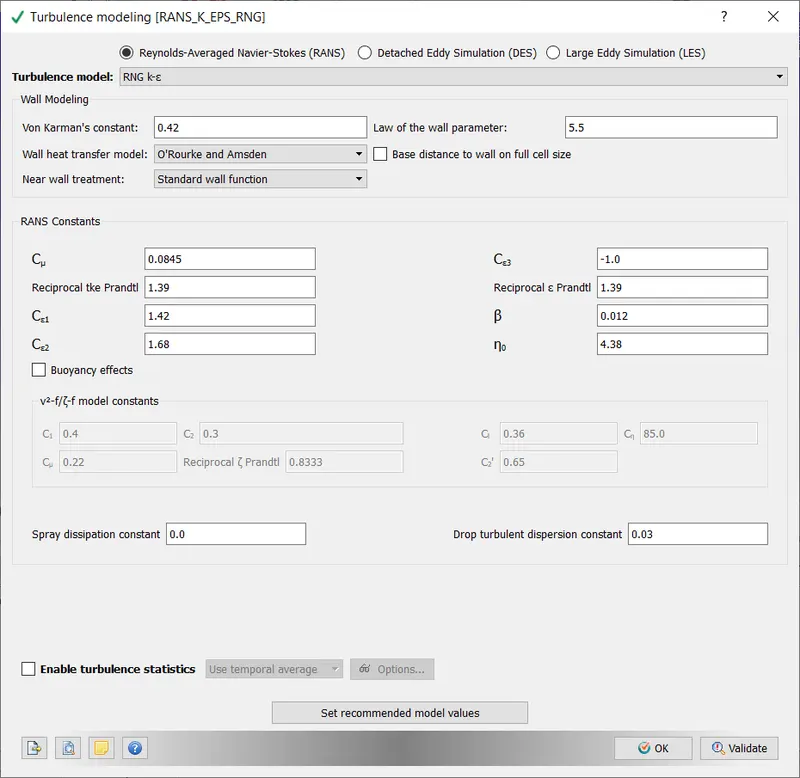
Turbulence was checked flow supersonic and will be turbulent
Grid Control
This is the step were sizes of each element is provided.
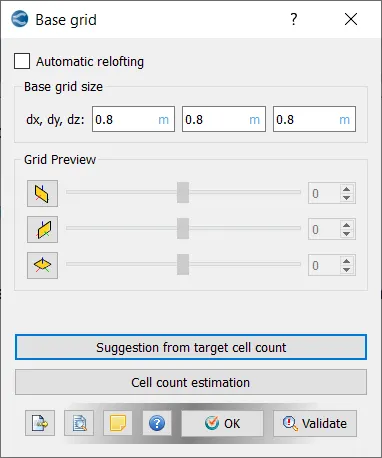
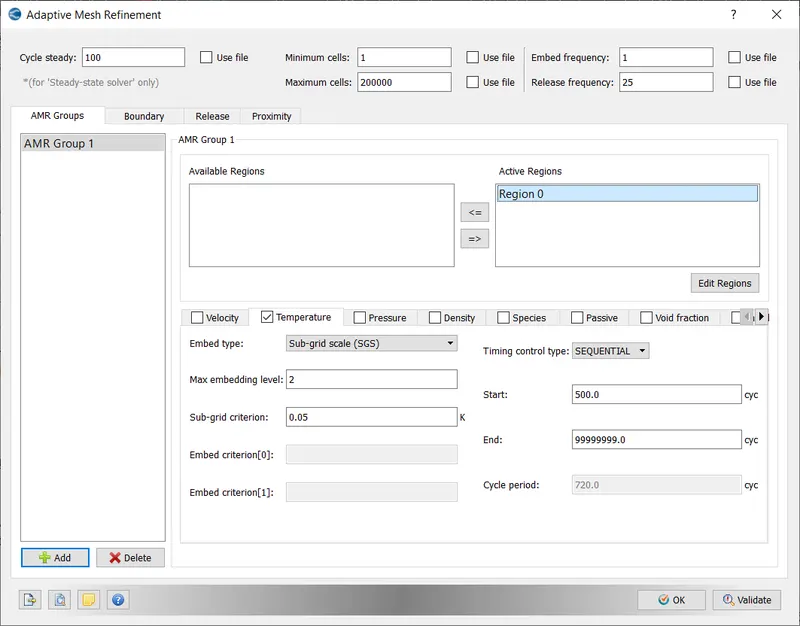
Another option, adaptive mesh refinement was added to ensure that higher resolution of data is obtained in the expansion region
Output/Post Processing
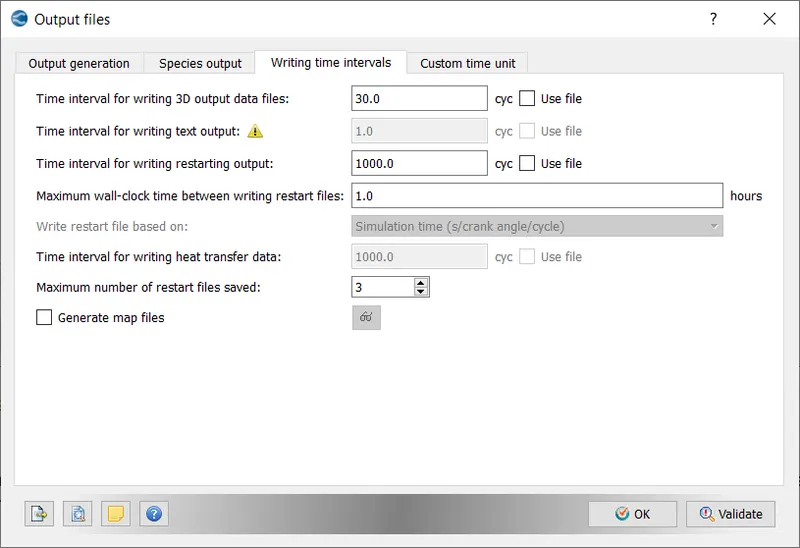
The simulation takes around ~3000 cycles to complete and I need around 100 post files, so time interval was chosen as 30.
Now, our case setup is complete. The files will be exported into a folder using the Files Export tool (File -> Export->Export input files)
In total 13 files were exported, these are:
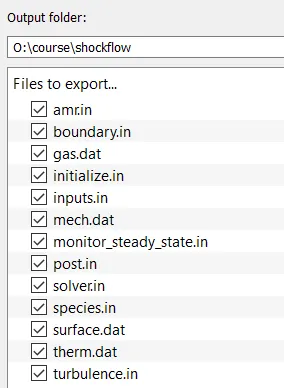
These files contain all the necessary information for the simulation.
Running the Simulation
1. Open cygwin
2. Navigate to directory where case files were exported
3. Run the following command
mpiexec.exe -n 4 "C:\Program Files\Convergent_Science\CONVERGE\3.0.16\bin\intelmpi\converge.exe" restricted </dev/null> logfile.txt &This will take a while, you can view the progress in task manager. CPU usage is usually maxed out.
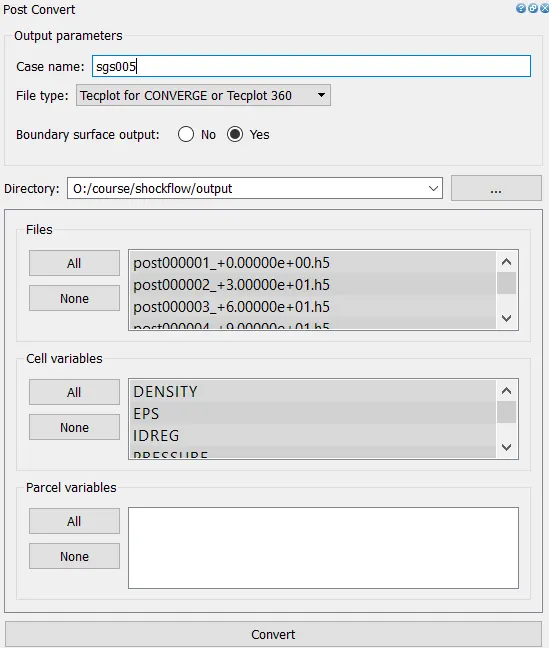
Once CPU usage drops from 100%, the output files are generated. To view them in paraview, we must export them to a format which is supported by paraview.
Go to 3D-post processing in converge,
Post-Processing
In Paraview
Import these files into paraview
The required plots/animation are generated
In converge
Go to Line plotting, select the case folder and plots can be viewed
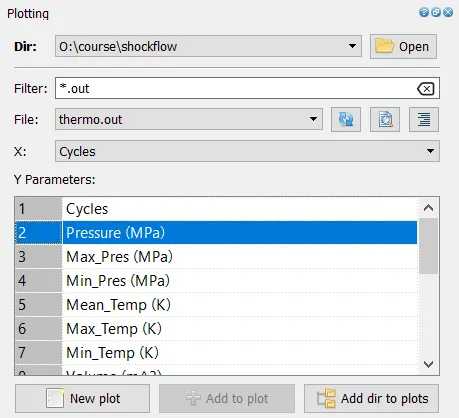
Outputs and Plots with explanations
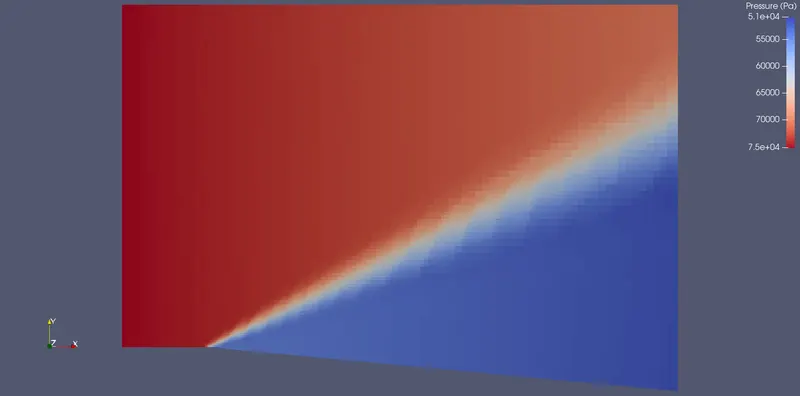
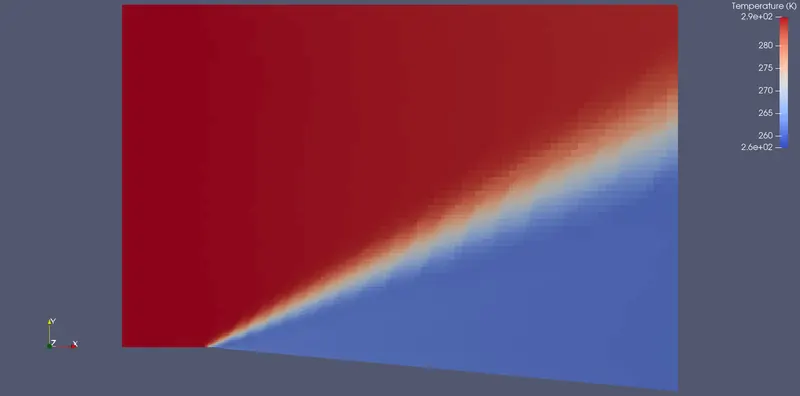
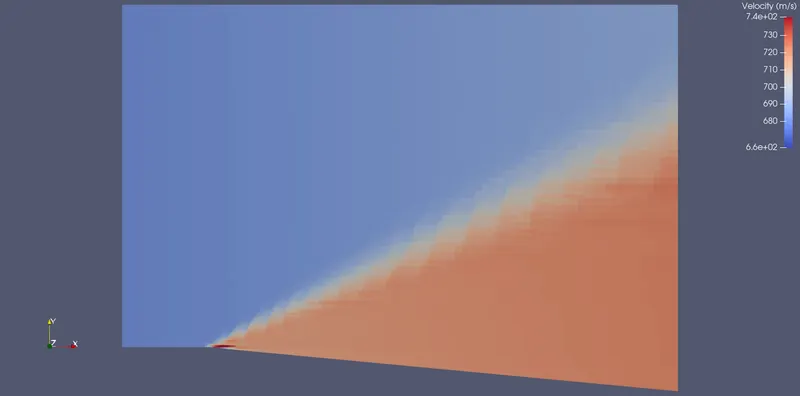
1. Pressure, Temperature and Velocity Contours
These were taken in paraview.
2. Mesh
This was taken in paraview.
As expected,when adaptive mesh refining is enabled, the mesh around the expansion fan is immediately resized upto a factor of 2. Orginal mesh size was 0.8m for all elements and new mesh sizes are 0.8m, 0.4m and 0.2m.
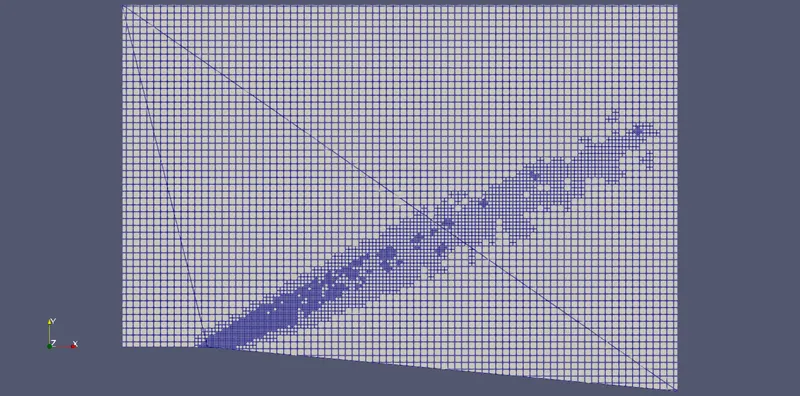
This is the mesh at the final cycle. The adaptive/smaller mesh does not extend to the right boundary/outlet
3. Velocity, Pressure, MassFlowRate and Cell Count Plots
This was taken in converge -> Line plotting
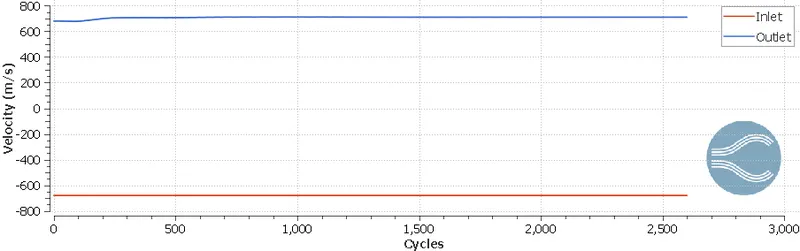
Velocity at the inlet is negative since flow enters the domain is considered negative, while velocity at the outlet is positive. Inlet velocity is constant because of the boundary condition, while outlet varies until it reaches steady state.
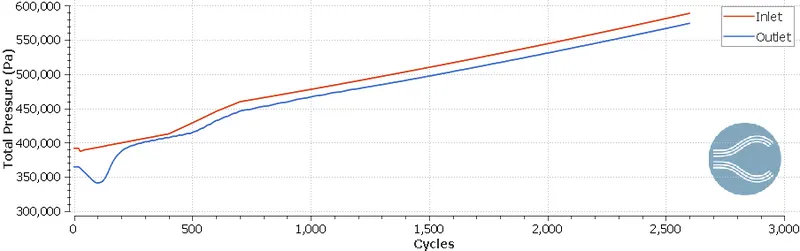
Pressure does not stay constant for a shock flow problem due to the inherent nature of flow, the pressure difference is constant towards the later stages of the simulation.
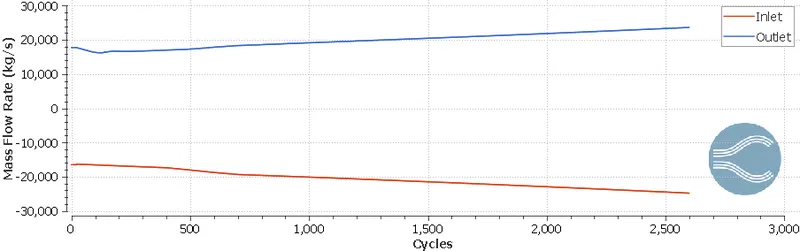
Mass flow rate at the inlet is negative since flow enters the domain is considered negative, while mass flow rate at the outlet is positive. Both masses' abosolute values are roughly the same throughout the simulation showing that mass conservation is followed.
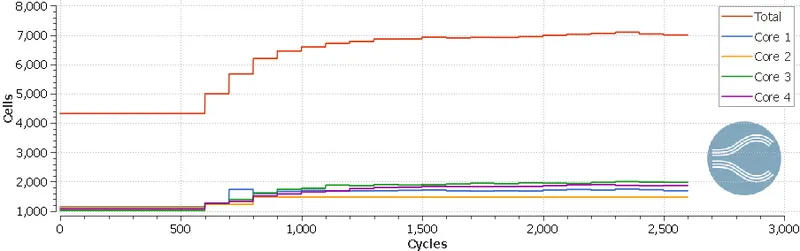
Cellcount, does not remain constant in this case, as the mesh is generated individually for each timestep. We can notice the cell count stays constant for the first ~600 cycles, after 600 cycles adaptive mesh refining is enabled. The cell count also stabilises towards the end when steady state happens. Total Cell count is always roughly 4 times the value for each Core.
5. Animation
We can notice a sharp decrease in the size of the expansion fan when adaptive meshes are generated, this is due to more precision gained when calculating the solution with adaptive mesh refining.
Effect of variation of sub-grid criterion on the simulation
To assess the effect of the sub-grid criterion for temperature (SGS), I changed the values to 0.01 and 0.1 and ran the simulation, here are the results:
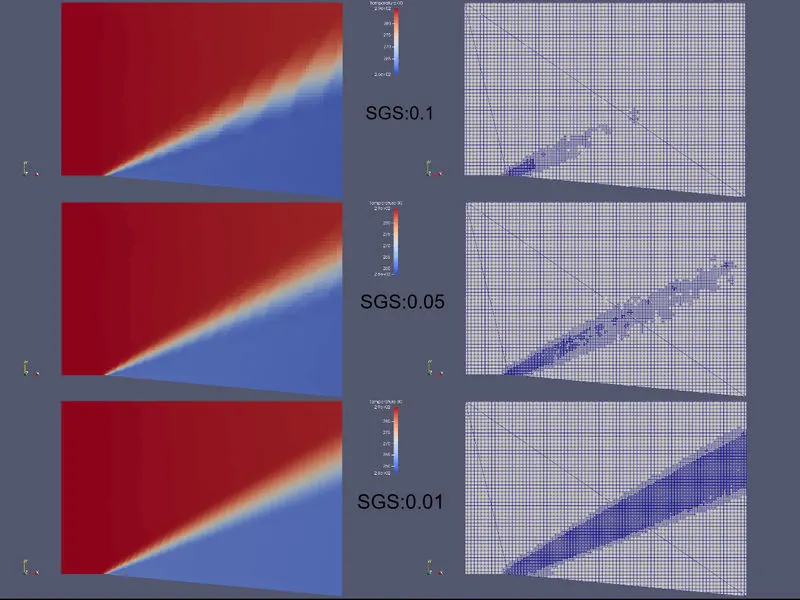
For a larger value of SGS, we can notice the mesh adaptive refining process covers a lot less cells in the mesh. For an SGS value of 0.01, we can see the entire expansion fan is covered in 0.2m mesh elements. This is the effect of SGS on the mesh.
For a smaller value of SGS, we can notice the expansion fan is more narrow for the same parameters, this is because of the presense of more elements if the SGS value is lower, more elements mean the calculations are more precise.
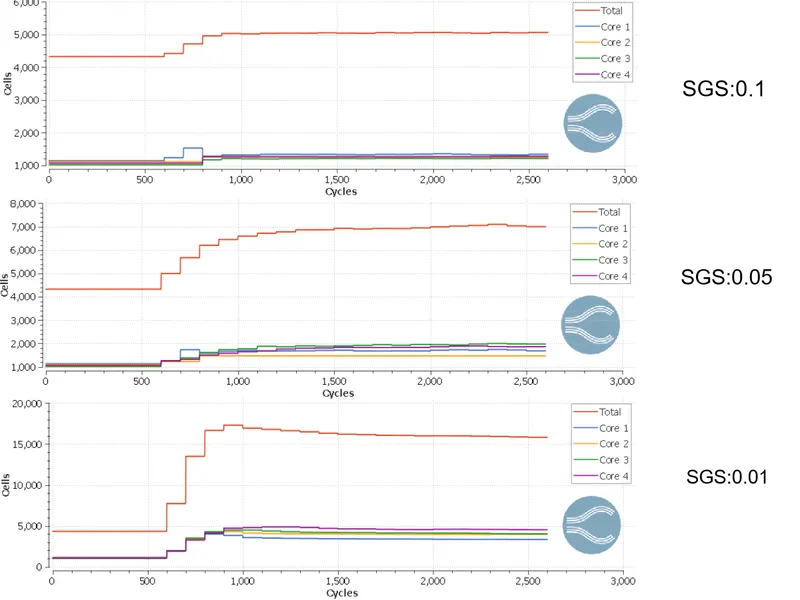
For cells, a smaller SGS value results in more cells being generated. This is expected as smaller cells = more cells.
Is the same phenomenon observed when the flow is subsonic?
For this, all the other values were kept the same except:
- Inlet boundary condition: inlet velocity is 100m/s in the x direction
- Initial Condition for region 0: 100m/s velocity in the x direction
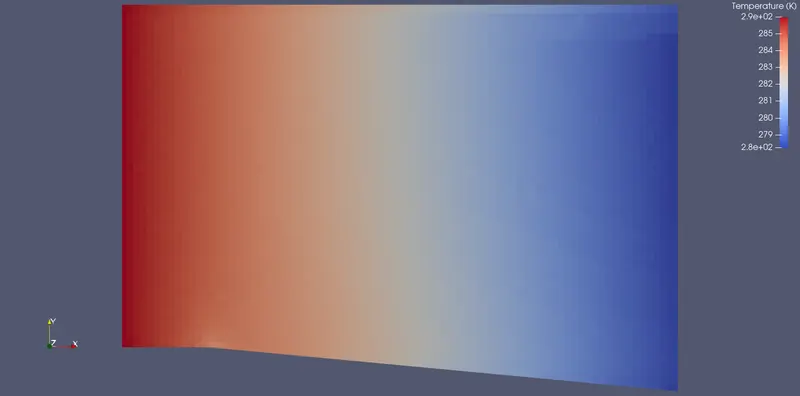
As we can see, no such phenomenon occurs, this is just a normal channel flow problem now.
Sources:
1. By myth - Own work This raster image was created with Microsoft Paint., Public Domain, https://commons.wikimedia.org/w/index.php?curid=52937826