Week 4.1: Project Steady state simulation of flow over a throttle body
In this project, a steady state analysis of flow over a throttle body will be performed in converge.
Geometry Creation
The geometry can either be created manually using converge or it can also be imported from another CAD software, in my case I imported the simple geometry.
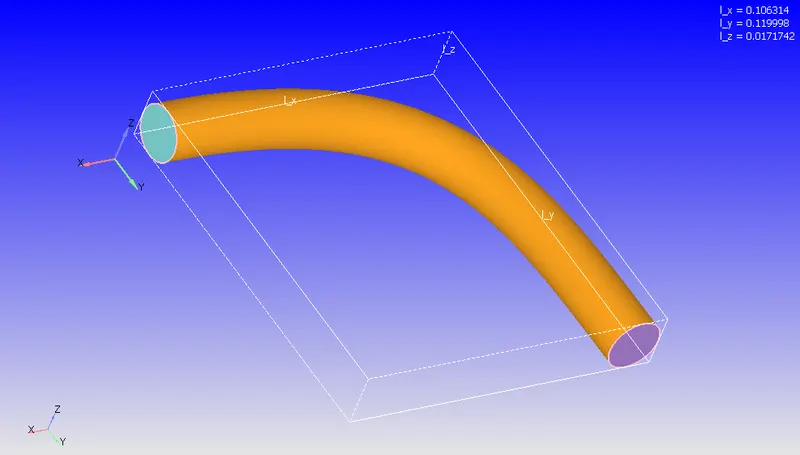
Do note that converge requires all geometry to be in metres, hence transformation may be required if the geometry was exported as millimetres (mm). This is the final geometry seen in converge.
Boundary
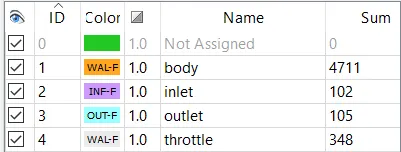
The inlet, outlet and body were given their separate boundaries as usual, and the throttle was given a separate boundary as well. In this case, the throttle does not move so its a static boundary.
Case Setup
Now, on to the case setup tab:
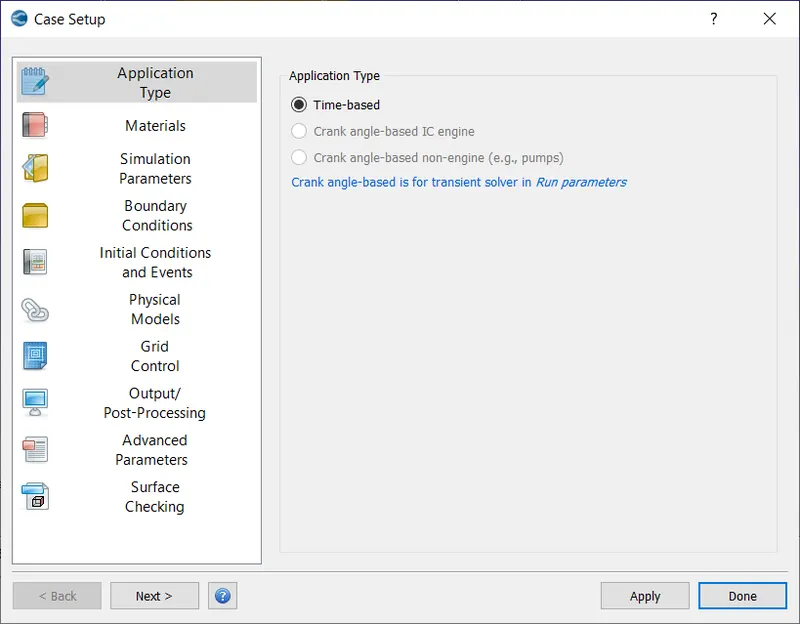
Application Type
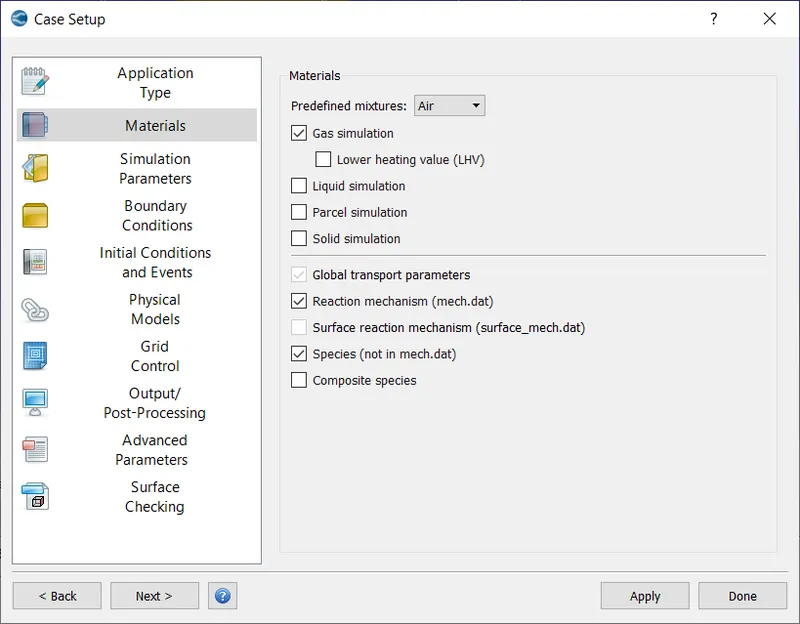
Materials: Gas Simulation, Global Transport Parameters and Reaction Mechanisms were set to default. In species, O2 and N2 were added.
Simulation Parameters
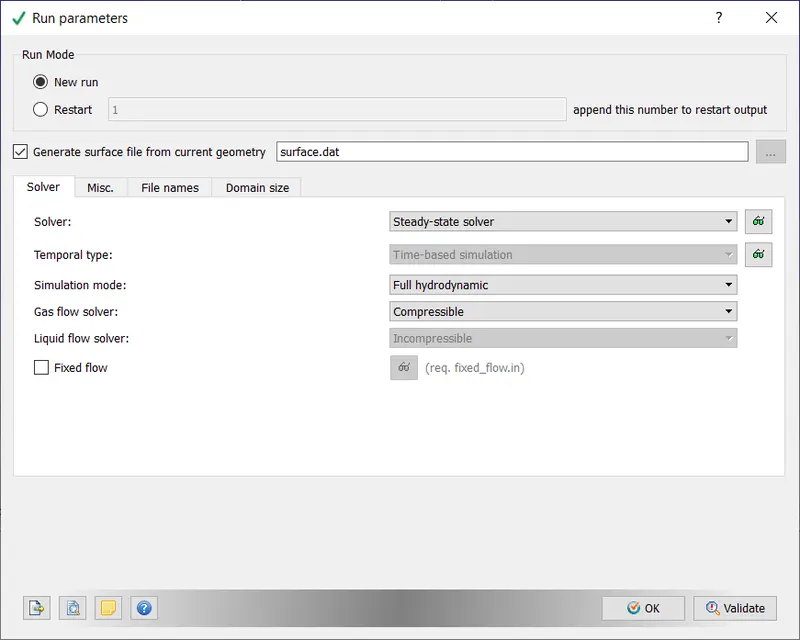
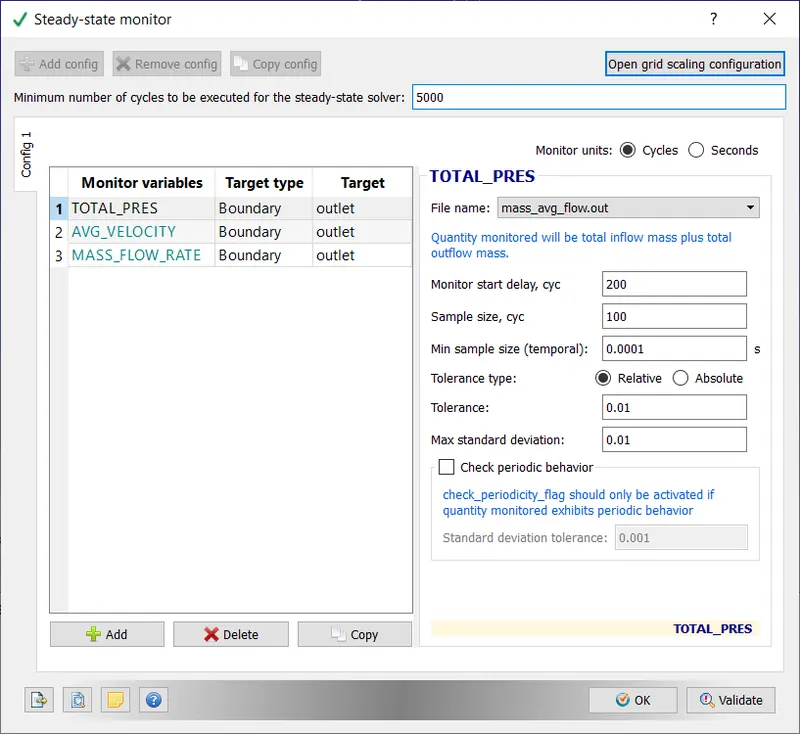
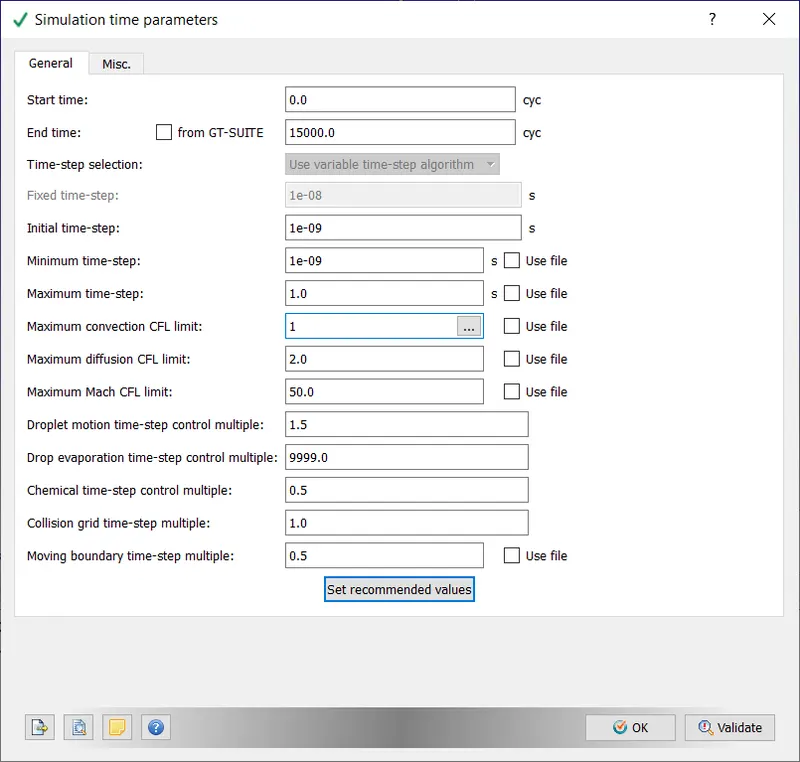
Note: a maximum convection CFL limit is required else the solution will never materialise.
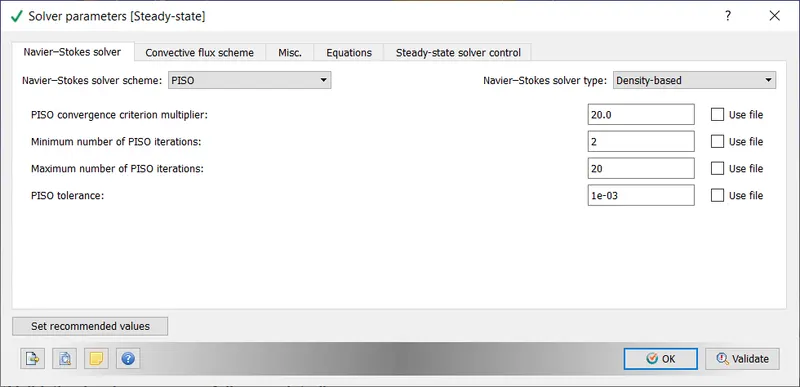
Boundary Conditions
Inlet: 150000 Pa (1.5 bar)
Outlet: 100000 Pa (1 bar)
Body: No-Slip
Throttle: No-Slip
Initial Conditions
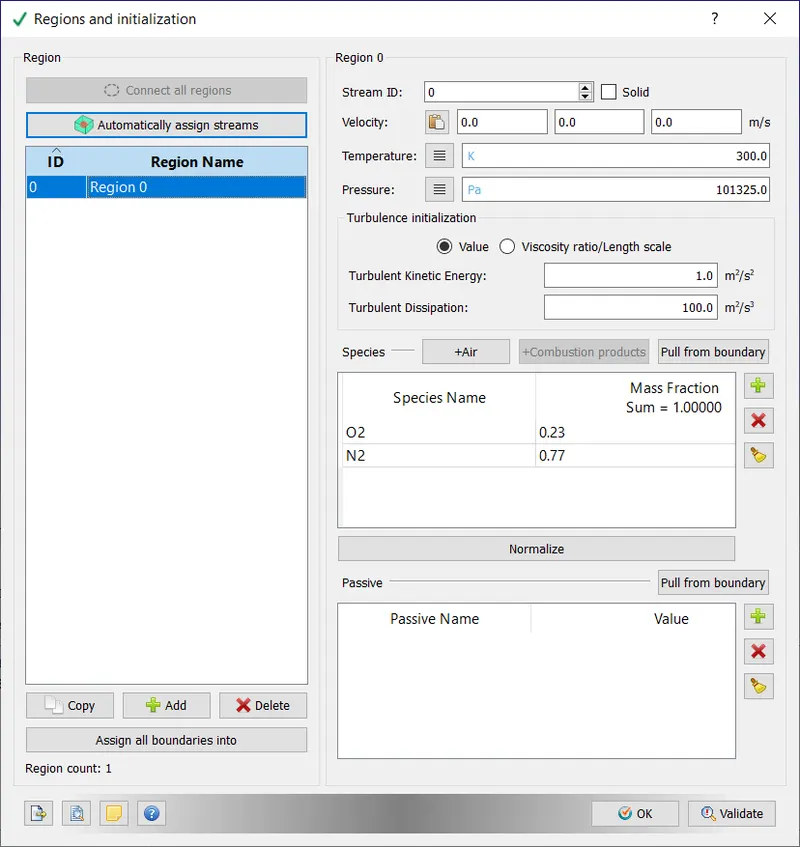
Physical Models
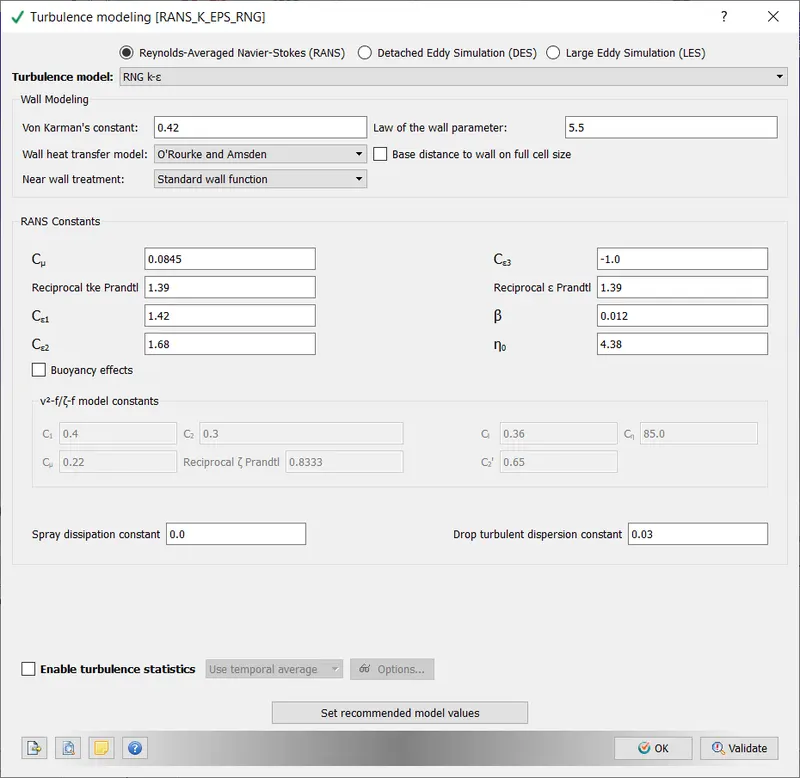
Turbulence was checked as vortices near the throttle are formed due to turbulence, also RNG k-epsilon was chosen as the model since this is a simple simulation.
Grid Control
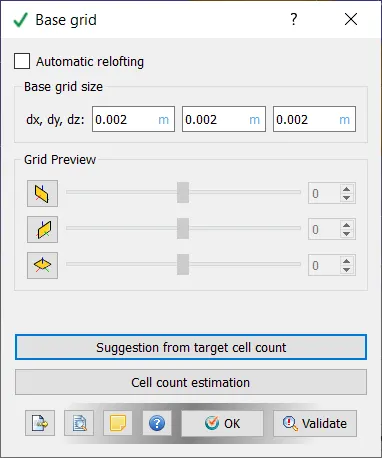
This is the step were sizes of each element is provided.
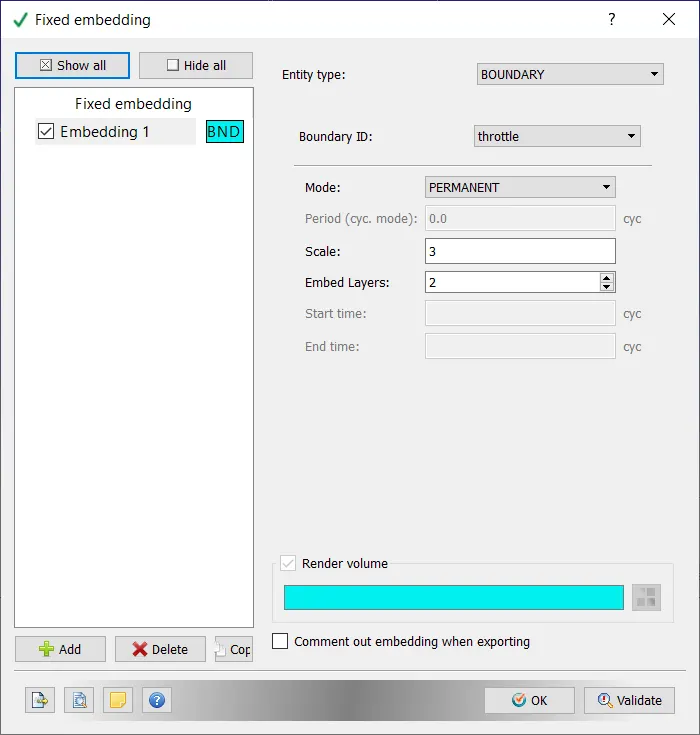
Another option, fixed embedding was enabled for this simulation to ensure more cells are used for processing near the throttle.
Output/Post Processing
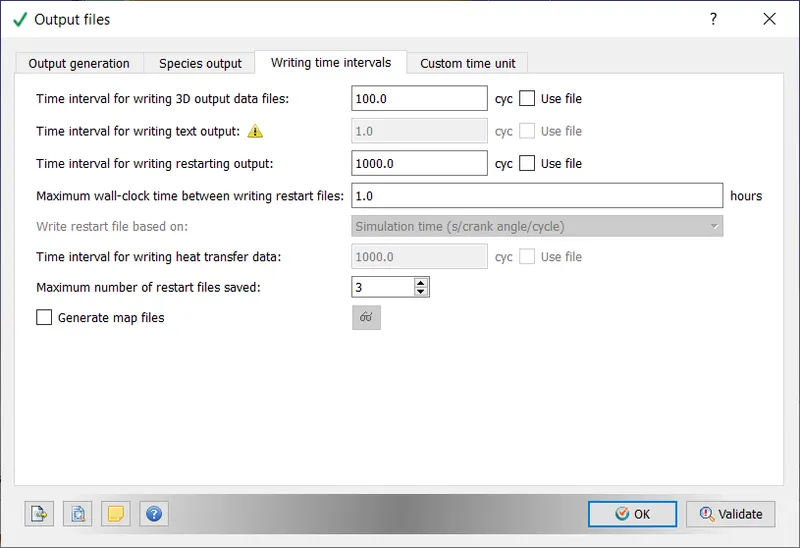
The time interval for writing 3D input files can be changed later on to obtain atleast 100 files, depeneding on when the solution converges.
Now, our case setup is complete. The files will be exported into a folder using the Files Export tool (File -> Export->Export input files)
In total 13 files were exported, these are:
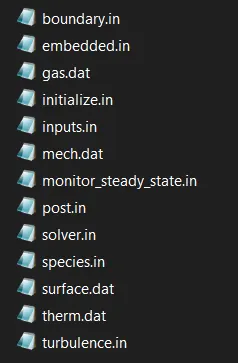
These files contain all the necessary information for the simulation.
Running the Simulation
1. Open cygwin
2. Navigate to directory where case files were exported
3. Run the following command
mpiexec.exe -n 4 "C:\Program Files\Convergent_Science\CONVERGE\3.0.16\bin\intelmpi\converge.exe" restricted </dev/null> logfile.txt &This will take a while, you can view the progress in task manager. CPU usage is usually maxed out.
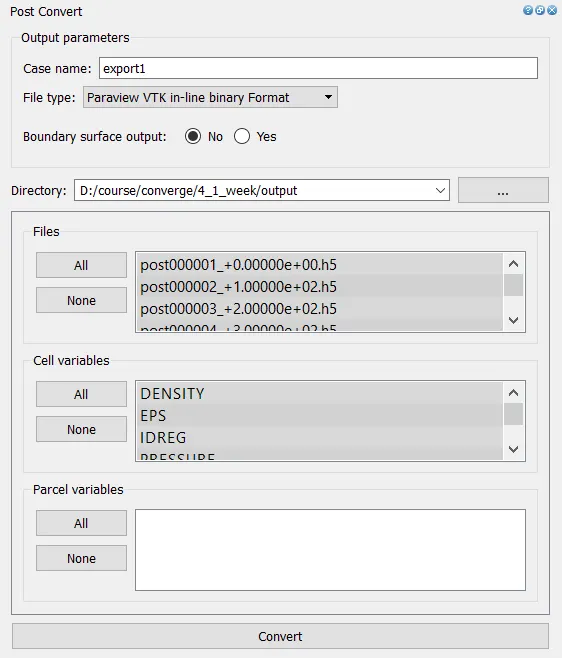
Once CPU usage drops from 100%, the output files are generated. To view them in paraview, we must export them to a format which is supported by paraview.
Go to 3D-post processing in converge,
Post-Processing
In Paraview
Import these files into paraview
The required plots/animation are generated
In converge
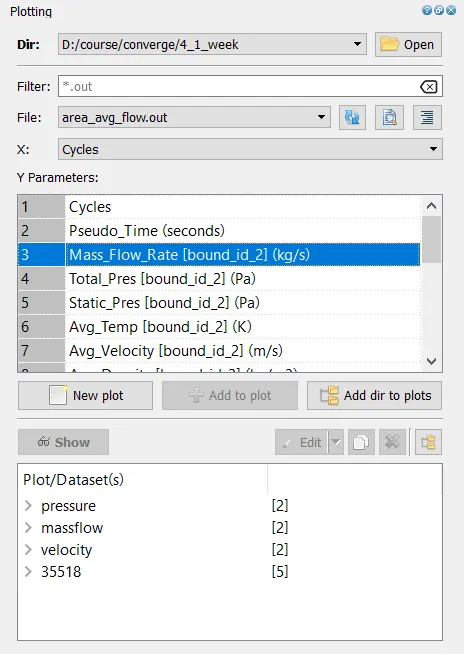
Go to Line plotting, select the case folder and plots can be viewed
Outputs and Plots for each Case
1. Velocity and Pressure Contours
These were taken in paraview.
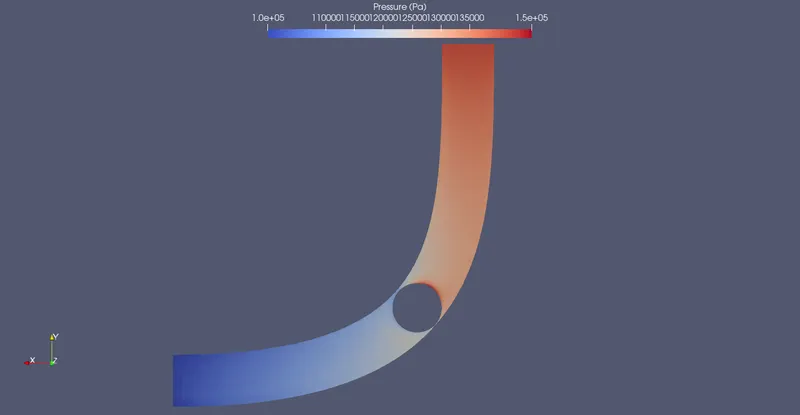
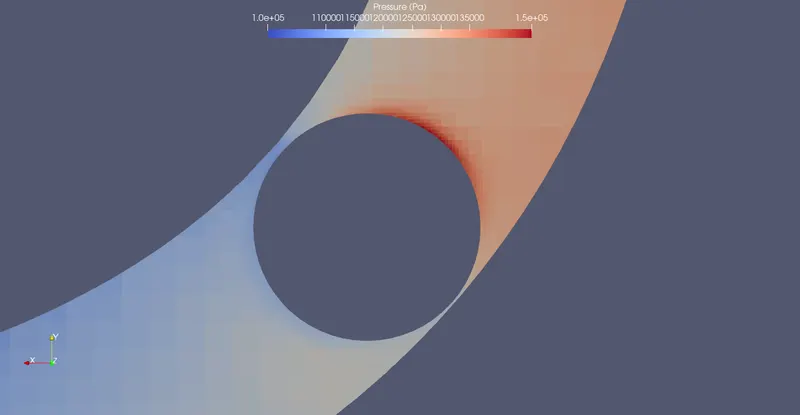
Inlet Pressure is higher at the enterance of the channel, as expected due to the boundary condition. It drops gradually untill the throttle where the pressure is high around the throttle face towards the inlet. After the flow crosses the throttle, the pressure drops to low levels and continues to drop to its lowest level at the outlet of the domain.
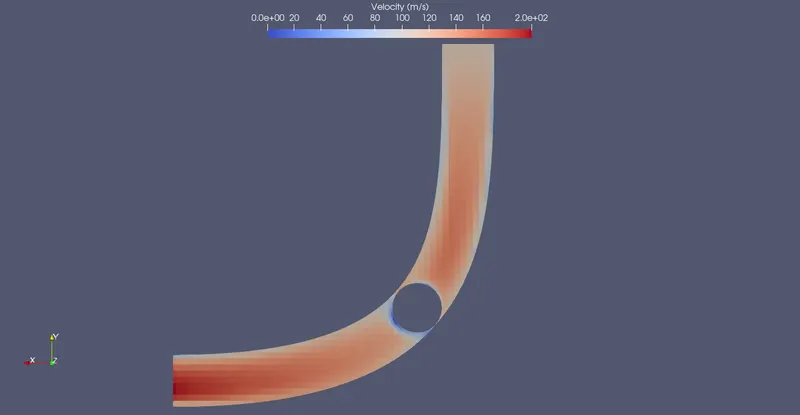
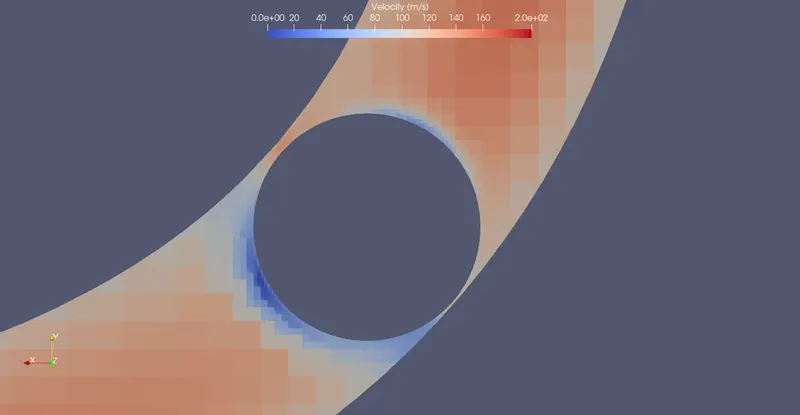
Velocity slowly increases towards the centre of the domain, while the velocity near the walls are low (due to boundary layer effect). On the side of the throttle that faces the inlet, the velocity is low while the velocity is high around the gaps between the throttle and elbow walls. On the side of the throttle that faces the outlet, there is a small region of very low velocity due to flow combining from 2 sides.
We can also notice that how the flow slows down and picks up speed again after the obstruction (throttle)
2. Mesh
This was taken in paraview.
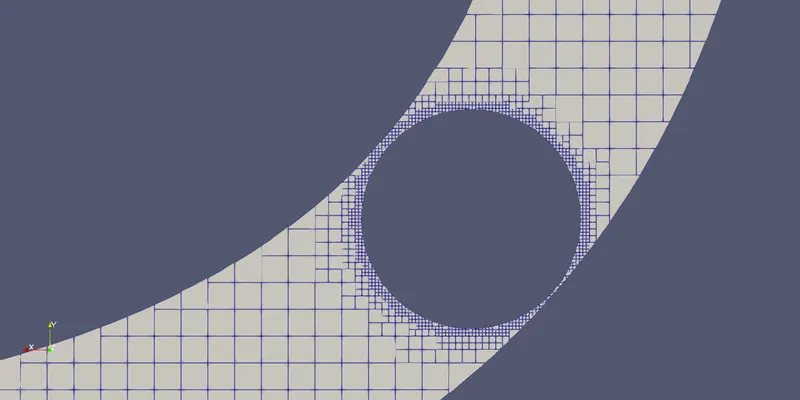
The mesh is finer around the throttle because of the fixed embedding option around the throttle's boundary.
3. Velocity, Pressure, MassFlowRate and Cell Count Plots
This was taken in converge -> Line plotting
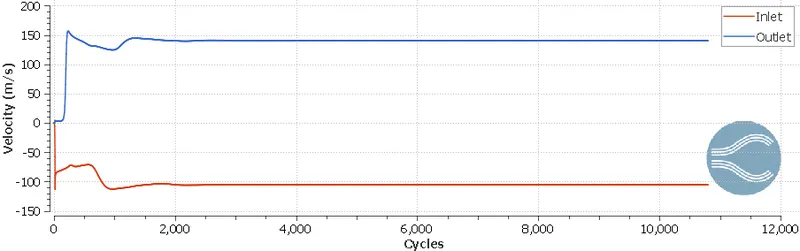
Velocity at the inlet is negative since flow enters the domain is considered negative, while velocity at the outlet is positive. The abosolute values of the velocities differ so much because, there is a change in density at the inlet vs outlet. The velocities initially start from 0 and slowly approach the true value as the solution nears the true value.
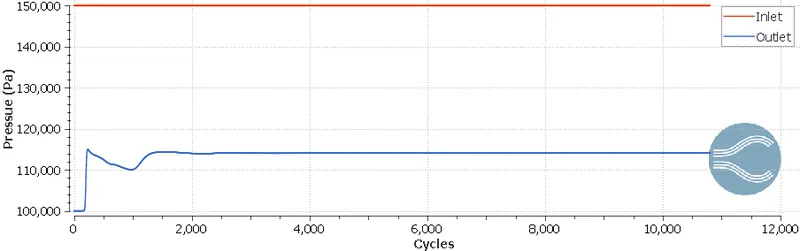
Pressure at the inlet stays constant because of the boundary condition, and outlet pressure actually increases slightly to compensate for mass conservation.
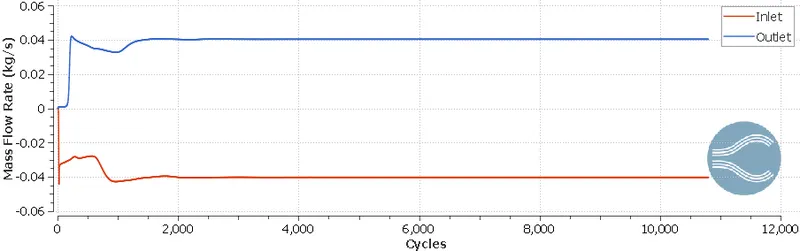
Mass flow rate at the inlet is negative since flow enters the domain is considered negative, while mass flow rate at the outlet is positive. Both masses' abosolute values are roughly the same throughout the simulation showing that mass conservation is followed. The masses initially start from 0 and slowly approach the true value as the solution nears the true value.
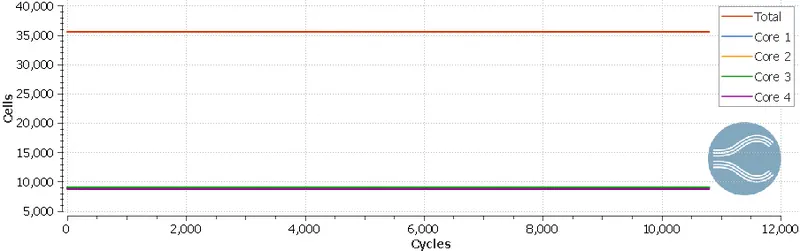
Cellcount, all values remain constant as expected, the total cell count is 35518, and number of cells solved by each core is also seen. The number of cells solved by each core is also roughly 35518 / 4 ~= 8900.
5. Animation
This shows how the solution forms from the initial conditions given, the velocities initially fluctuate but they eventually stabilise to form the true solution.