Project 2 - Rankine cycle Simulator
In this project, I will be writing code in MATLAB to simulate a Rankine Cycle for the given parameters.
A Rankine Cycle is an ideal thermodynamic heat cycle where mechanical work is extracted from the working fluid as it passes between a heat source and heat sink. This cycle or its derivatives is used in steam engines and steam-based power plants. This cycle consists of four processes, they are:
Process 1 - 2: Constant Pressure Heat Addition: the fluid is passed through a boiler, where heat is transferred to it. Ideally, this process occurs at constant pressure. The exiting fluid's vapour is dry or superheated. The boiler is the heat source.
Process 2 - 3: Isentropic Expansion: the fluid is passed through a turbine, where mechanical work is extracted from the fluid. Ideally, this process is isentropic.
Process 3 - 4: Constant Pressure Heat Rejection: the fluid is condensed to a saturated liquid through a condenser. Ideally, this process occurs at constant pressure.
Process 4 - 1: Isentropic Compression: the fluid is fed through a pump, where it is compressed. Ideally, this process is isentropic.
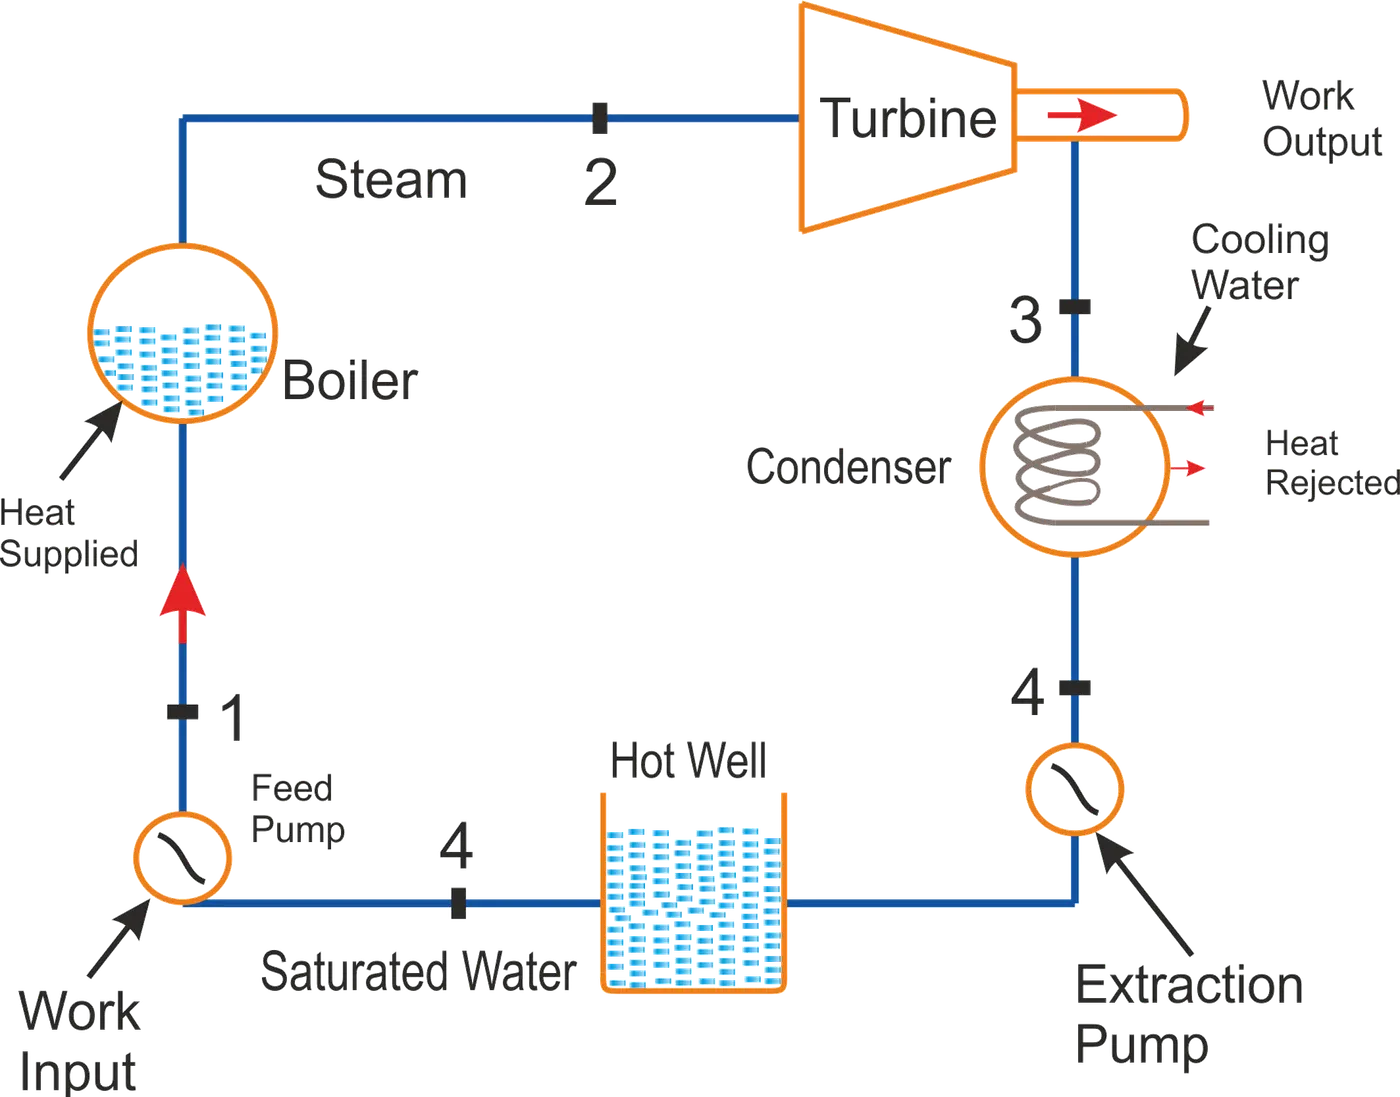
There are multiple variations to this closed loop version of the rankine cycle.
From the above assumptions,
From process 1 - 2
`p_1 = p_2`
`h_(fg1) = h_(fg2)`
`x_2 = 1` (saturated steam)
From process 2 - 3
`s_2 = s_3`
From process 3 - 4
`p_3 = p_4`
`h_4 = h_(f3)`
From process 4 - 1
`s_1 = s_4`
Where `S` is the specific entropy (`J//mol`) at the specified stage, `p` is the pressure (`Pa`) at the specified stage, `h` is the specific enthalpy (`J//kg`) at the specified stage and `x` is the dryness factor.
In this project, since it is impractical to calculate these parameters for each timestep using steam tables/mollier chart, an external library henceforth referred to as XSteam will be used.
The library can be found here: https://drive.google.com/open?id=1RK_fvrOj38CIaQvmLT1S3daqHnxKCGU
Code (with explanation)
Functions
constant_pressure_plotter : this function calculates temperature and enthalpy for different entropy values and constant pressure using the xsteam library. The output parameters are entropy, temperature and enthalpy.
filename: constant_pressure_plotter.m

function [t,h,s] = constant_pressure_plotter (s1,s2,p)
% this function calculates t and h for different entropy values and
% constant pressure values using xsteam library
    s = linspace (s1,s2,100);
    for i=1:length(s)
        t(i) = XSteam ('T_ps',p,s(i));
        h(i) = XSteam ('h_ps',p,s(i));
    end
end
isentropic_plotter : this function calculates temperature and enthalpy for different pressure values and constant entropy using the xsteam library. The output parameters are entropy, temperature and enthalpy.
filename: isentropic_plotter.m

function [t,h,s] = isentropic_plotter (p1,p2,s)
% this function calculates t and h for different pressure values and
% constant entropy values using xsteam library
    p = linspace (p1,p2,100);
    for i=1:length(p)
        t(i) = XSteam ('T_ps',p(i),s);
        h(i) = XSteam ('h_ps',p(i),s);
    end
    s = ones(1,length(p)) .* s;
    % converting s into an array to make it easier for plotting
end
Main Program
clear all
close all
clc

% Rankine Cycle
% -> 1 -> boiler -> 2 -> turbine -> 3 -> condenser -> 4 -> pump -> 1 ->
fprintf ('\t\tRANKINE CYCLE - SIMPLE\n\n')
fprintf ('Process 1 - 2: Constant Pressure Heat Addition by Boiler')
fprintf ('\nProcess 2 - 3: Isentropic Expansion in Turbine')
fprintf ('\nProcess 3 - 4: Constant Pressure Heat Rejection  by Condenser')
fprintf ('\nProcess 4 - 1: Isentropic Compression in Pump\n\n')

% accepting input data from user
fprintf ('INPUT DATA\n')
p2 = input ('Enter Pressure at turbine inlet (bar): ');
t2 = input ('Enter Temperature at turbine inlet (°C): ');
p3 = input ('Enter Pressure at turbine outlet (bar): ');

% calculating state 2 parameters

% finding enthalpy and entropy at p2 and t2
h2 = XSteam('h_pT',p2,t2);
s2 = XSteam('s_pT',p2,t2);

% calculating state 3 parameters

% finding vapour and liquid enthalpy and entropy at p3
% calculating liquid-vapour enthalpy/entropy using vapour = liquid + liquid-vapour
h3_f = XSteam('hL_p',p3);
h3_fg = XSteam('hV_p',p3) - h3_f;

s3_f = XSteam('sL_p',p3);
s3_fg = XSteam('sV_p',p3) - s3_f;

% we know s3 = s2 (isentropic, and s3 = sf3 + x3 * sfg3
% s3 = sf3 + x3 * sfg3
% x3 = (s3 - sf3)/sfg3
s3 = s2;
x3 = (s3 - s3_f)/s3_fg;

% now we know x3, so we can find h3 = hf3 + x3*hfg3
h3 = h3_f + x3 * h3_fg;

% knowing p3 and h3, we can find t3
t3 = XSteam('T_ph',p3,h3);

% calculating state 4 parameters
p4 = p3; % constant pressure process
s4 = s3_f; % condensation process
h4 = h3_f; % condensation process

% knowing h4 and s4 we can find t4
t4 = XSteam('T_hs',h4,s4);

% calculating state 1 parameters
p1 = p2; % constant pressure process
s1 = s4; % isentropic process

% knowing p1 and s1, we can find h1 and t1
h1 = XSteam('h_ps',p1,s1);
t1 = XSteam('T_ps',p1,s1);

% net work ratio = work done by turbine - work done by pump
% back work ratio = work done by turbine / work done by pump
net_work_done = abs (h3-h2) - abs (h4-h1);
back_work_ratio = (h3-h2)/(h4-h1);


% generating t-s and h-s plots
[t_1_2,h_1_2,s_1_2] = constant_pressure_plotter (s1,s2,p1);
[t_2_3,h_2_3,s_2_3] = isentropic_plotter (p2,p3,s2);
[t_3_4,h_3_4,s_3_4] = constant_pressure_plotter (s3,s4,p3);
[t_4_1,h_4_1,s_4_1] = isentropic_plotter (p4,p1,s4);
% these functions generate values to be plotted
% merging those values for ease of use
t = [t_1_2 t_2_3 t_3_4 t_4_1];
s = [s_1_2 s_2_3 s_3_4 s_4_1];
h = [h_1_2 h_2_3 h_3_4 h_4_1];

% plotting t-s plot
figure (1)
plot (s,t,'LineWidth',1,'Color','b')
hold on
plot (s1,t1,s2,t2,s3,t3,s4,t4,'Color','r','Marker','o')
title ("Temperature vs Entropy for Simple Rankine Cycle")
xlabel ('Entropy (J/(kg.mol))')
ylabel ('Temperature (°C')

% plotting h-s plot
figure (2)
plot (s,h,'LineWidth',1,'Color','b')
hold on
plot (s1,h1,s2,h2,s3,h3,s4,h4,'Color','r','Marker','o')
title ("Enthalpy vs Entropy for Simple Rankine Cycle")
xlabel ('Entropy (J/(kg.mol))')
ylabel ('Enthalpy (J/kg)')

fprintf ('\nOUTPUT DATA\n')
% printing output data
% state 1
fprintf('At State Point 1:\n')
disp(['Temperature (T): ',num2str(t1),'°C'])
disp(['Pressure (P): ',num2str(p1),' bar'])
disp(['Enthapy (H/Q): ',num2str(h1),' J/kg'])
disp(['Entropy (S): ',num2str(s1),' J/(kg.mol)'])

% state 2
fprintf('\nAt State Point 2:\n')
disp(['Temperature (T): ',num2str(t2),'°C'])
disp(['Pressure (P): ',num2str(p2),' bar'])
disp(['Enthapy (H/Q): ',num2str(h2),' J/kg'])
disp(['Entropy (S): ',num2str(s2),' J/(kg.mol)'])

% state 3
fprintf('\nAt State Point 3:\n')
disp(['Temperature (T): ',num2str(t3),'°C'])
disp(['Pressure (P): ',num2str(p3),' bar'])
disp(['Enthapy (H/Q): ',num2str(h3),' J/kg'])
disp(['Entropy (S): ',num2str(s3),' J/(kg.mol)'])

% state 4
fprintf('\nAt State Point 4:\n')
disp(['Temperature (T): ',num2str(t4),'°C'])
disp(['Pressure (P): ',num2str(p4),' bar'])
disp(['Enthapy (H/Q): ',num2str(h4),' J/kg'])
disp(['Entropy (S): ',num2str(s4),' J/(kg.mol)'])

% net work done and back work ratio
fprintf('\nNet Work Done : %5.5f J/kg',net_work_done)
fprintf('\nBack Work Ratio : %5.5f\n',back_work_ratio)
Output
Command Window
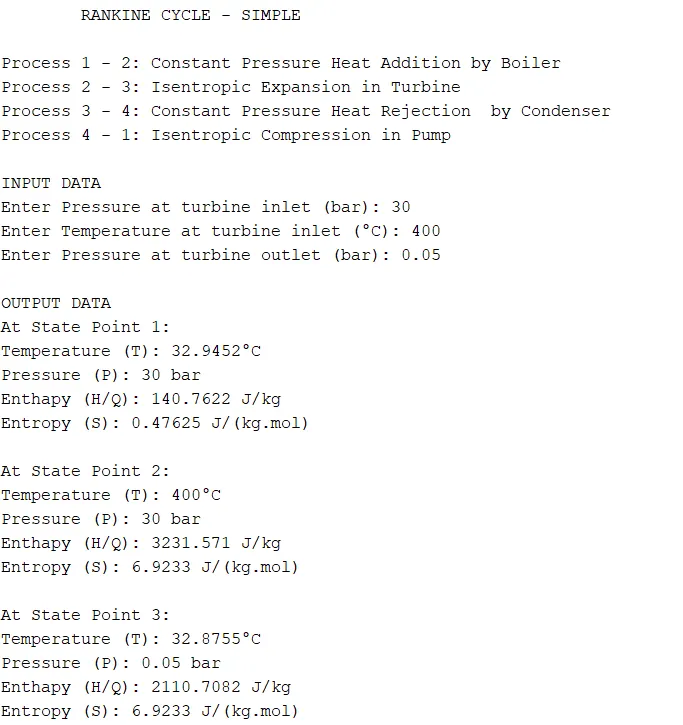
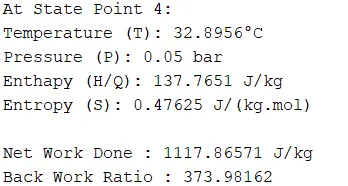
Plots Generated
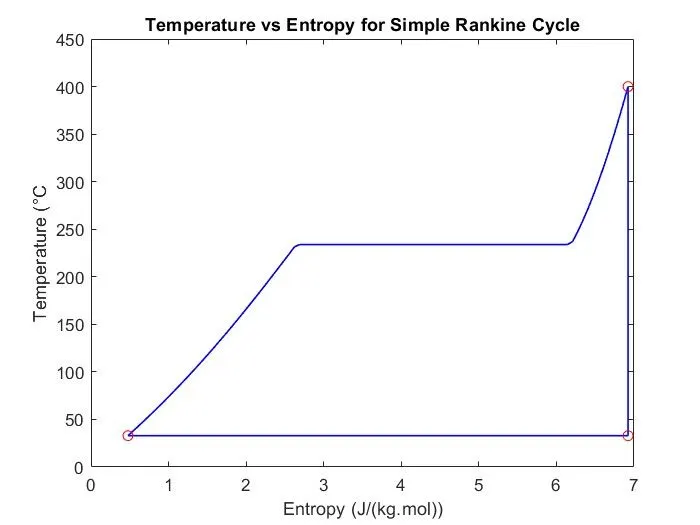
Temperature vs Entropy
Enthalpy vs Entropy
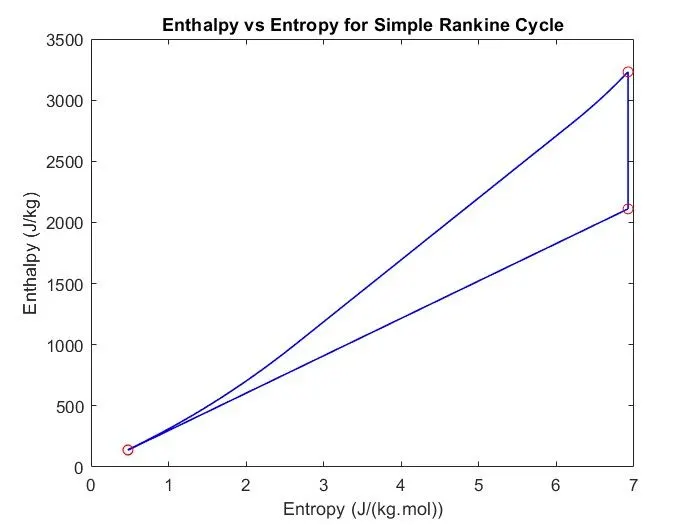
Straight vertical lines indicate constant entropy/isentropic processes, as expected. The temperature graph flatlines after a while, this is due to latent heat of evaporation of water.
Note: it may seem that the two points on the left side of the graph are coincident, but upon zooming in, we can see that they aren't coincident.
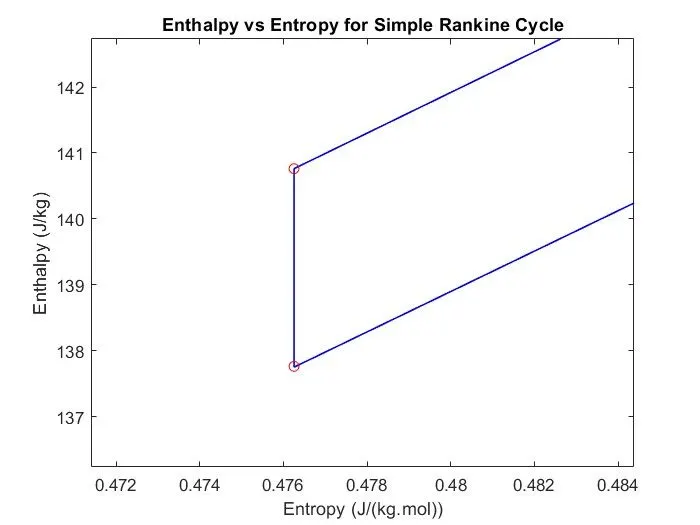
This shows the scale at which the turbine produces work and how little work the pump consumes.
Errors Faced during Programming
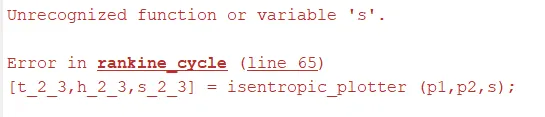
Steps Taken to fix the error
Instead of passing "s" as a parameter, "s1" was passed.
References
1. Rankine Cycle Gif from https://www.mechanicaltutorial.com/rankine-cycle-efficiency
2. Chapter 7, R. S. Khurmi and J. K. Gupta - A Textbook of Thermal Engineering-S. Chand and Company Limited (2020). ISBN: 978-81-219-2573-0.
3. https://in.mathworks.com/help/matlab/matlab_prog/combine-cell-arrays.html