Simulating a Simple Crash Scenario of a Crash Box with Two Thicknesses using LS DYNA and Comparing the Results
Objective:
- To simulate a crash test for a crash box for which the mesh model is given.
- The crashbox should crash into a rigidwall created using *RIGIDWALL_ keyword. Check the manual to understand and create a rigidwall.
- Material for the crashbox is steel. The simulation needs to be started using elastic material to verify its correctness and later a nonlinear material card data will be provided. Thickness of the crashbox is 1.2mm.
- Initial velocity for the crashbox should be around 50 kmph
- The units system to be used is gm-mm-ms
- The simulation should satisfy either of the two situations -
- It crashes on the rigidwall and rebounces completely
- It buckles and folds in the axial direction so as to come in self-contact.
- Once the simulation is completed and results as asked for below is collected, run another simulation by increasing the thickness of the crashbox from 1.2 to 1.5mm.
- Input .k file and output files (d3plot, glstat, sleout, rcforc)
- Animation of the final simulation
- Cross-sectional force generated in the middle of the crashbox (along its length)
- Acceleration plot of a node in the middle of the crashbox (along its length)
- Maximum directional stress and strain along the length of the crashbox (X strain, Y strain etc)
- Plot of all energies (total, internal, kinetic, hourglass, sliding)
- Compare the accelerations and stress/strain plots of 1.2/1.5mm crashboxes.
Procedure:
1. Open the given Keyword file into LS Prepost.
2. We first start by creating a Rigid Wall.
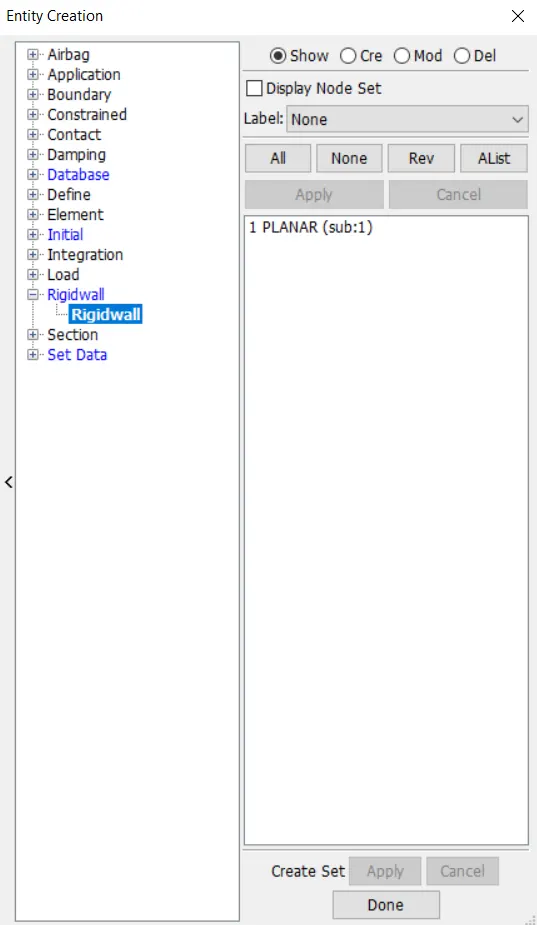
3. The Rigid Wall is created by going to Create -> RigidWall and selecting the Rigidwall type as shown below:
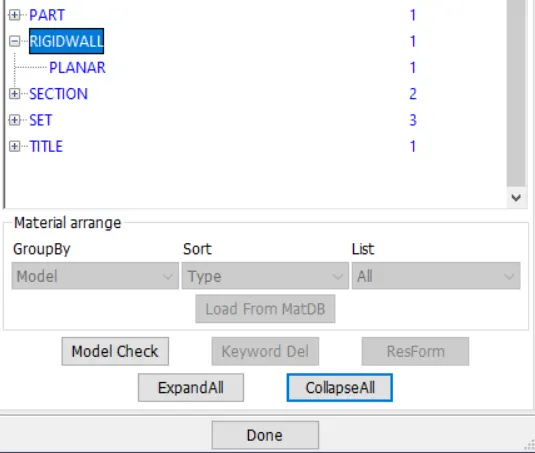
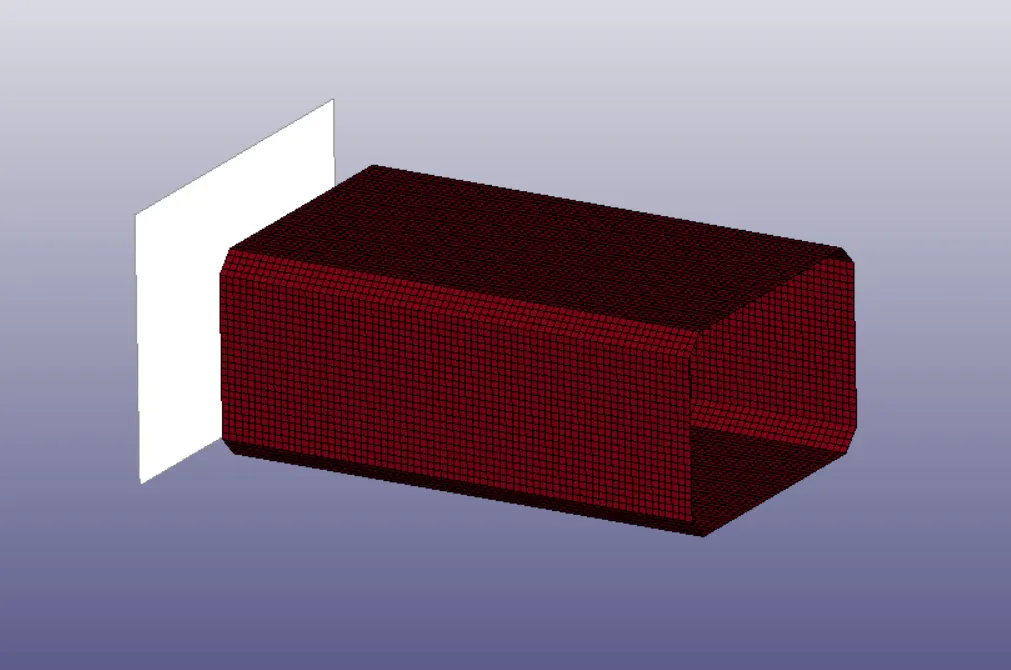
4. Set the Cordinates to obtain the Rigidwall as shown below:
Velocity:
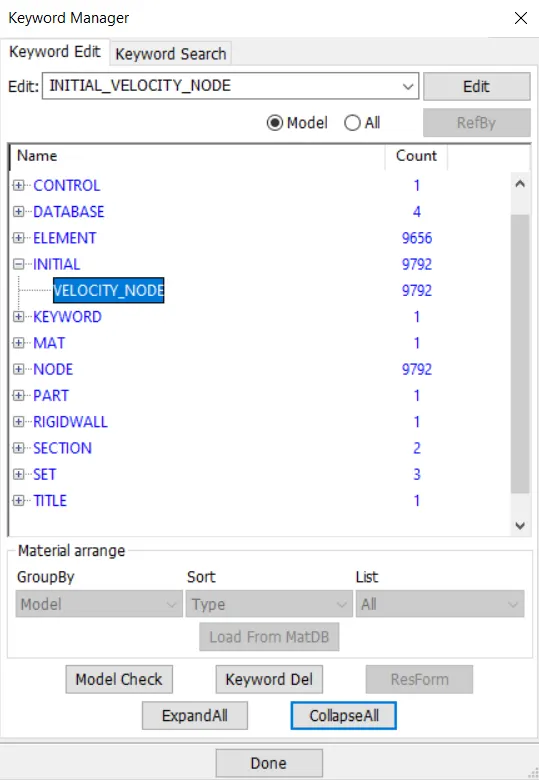
5. Next we apply a velocity to all the nodes of the part.
6. This is done by going to the Keyword manager and adding an initial velocity of 50kmph = 13.8889 mm/ms.
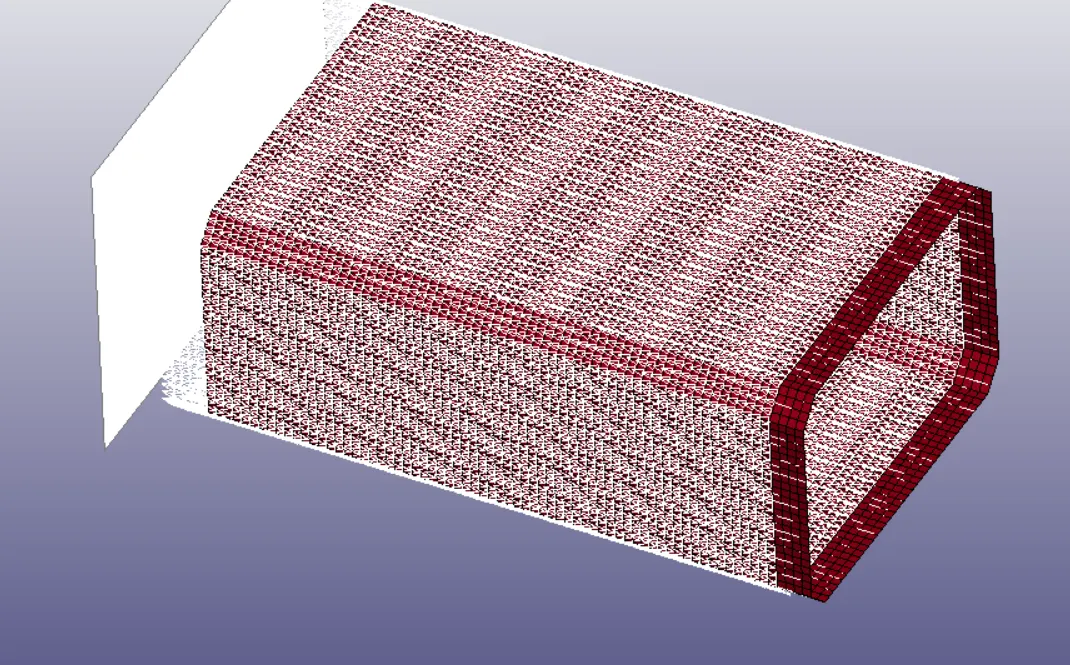
7. The model will now look as shown below:
Section:
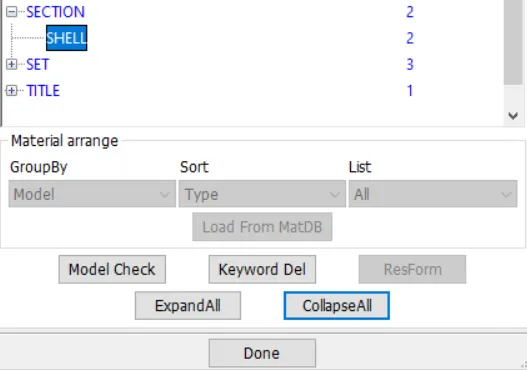
8. Next we move into defining a section with thickness of 1.2mm and 1.5mm for both the simulations that need to be done.
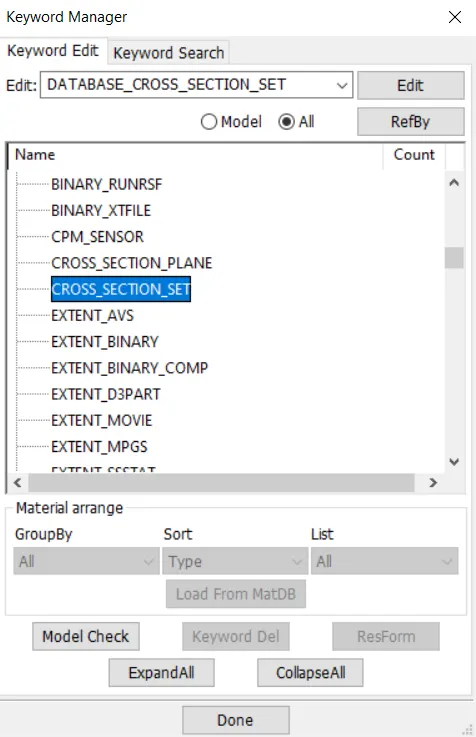
9. Since the Cross sectional forces need to be captured while post processing, we define the cross sectional area by the keyword CROSS_SECTION_SET as shown below:
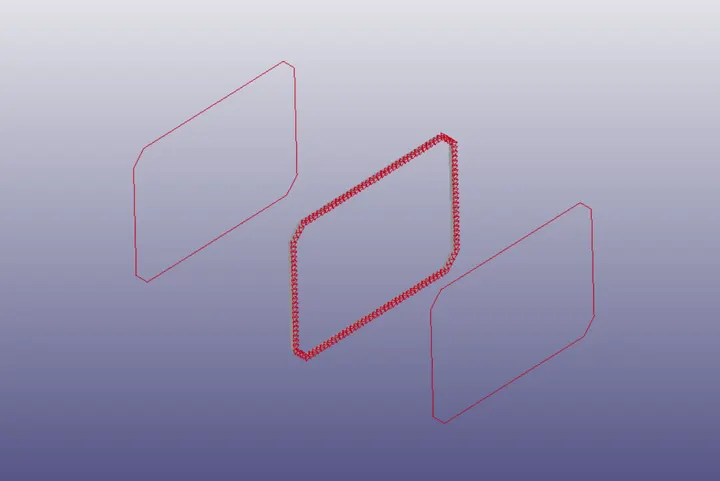
10. The nodes and element rows are selected as shown below:
Control:
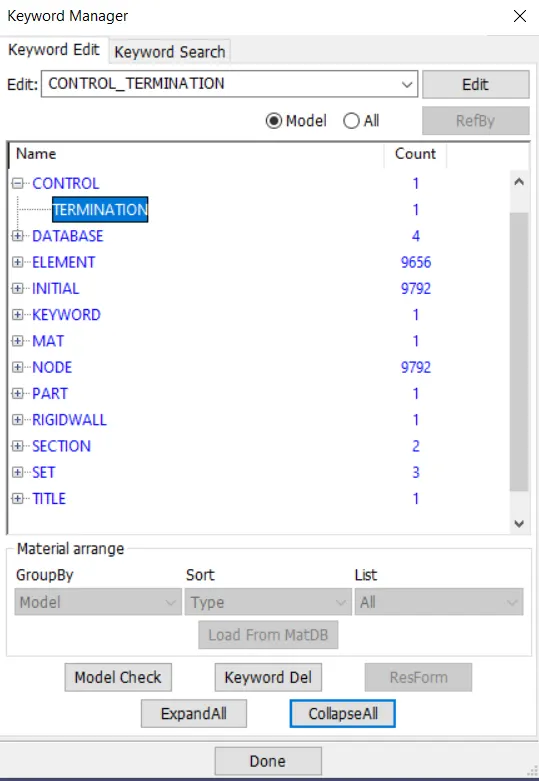
11. We define the Control termination in the CONTROL Keyword.
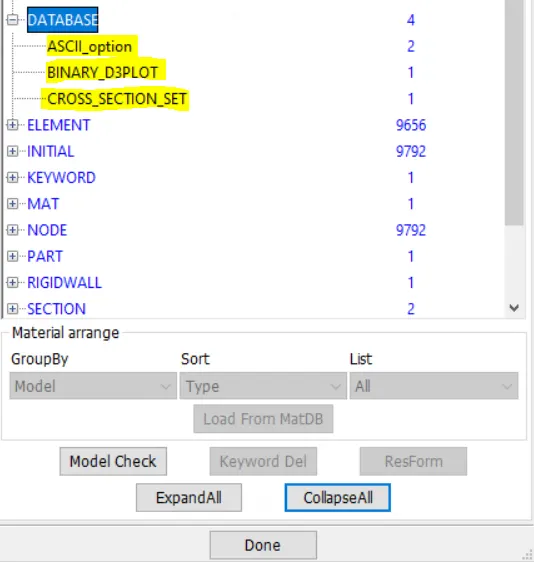
12. The outputs that are necessary are defined in the DATABASE Keyword.
13. ASCII, D3PLOT gives us the required graphs and Animations that are necessary.
Material:
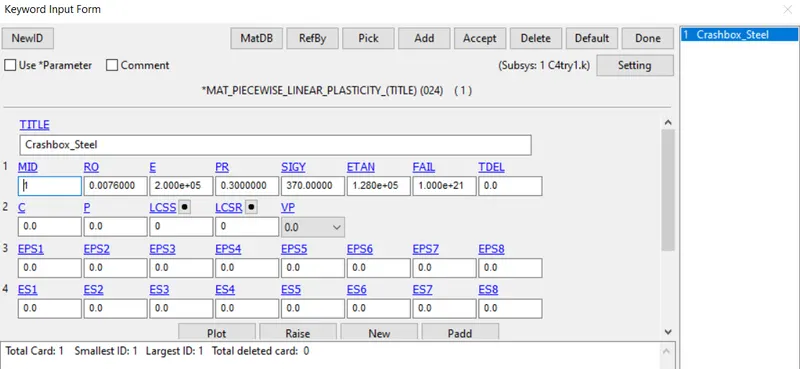
14. Next we define the material of the crash box. 024 Piecewise Linear Plasticity is used with the following values:
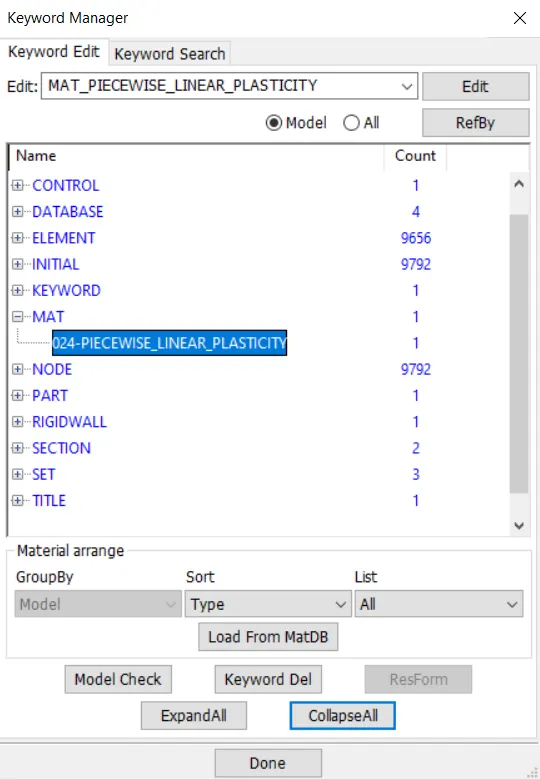
15. The MAT and SEC properties are assigned to the part and saved as a keyword file and the SEC properties with Thickness 1.5mm is saved as another Keyword file.
Outputs and Observations:
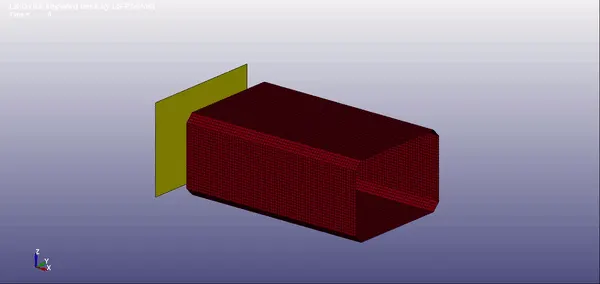
Animation:
Von Mises (1.2 mm):
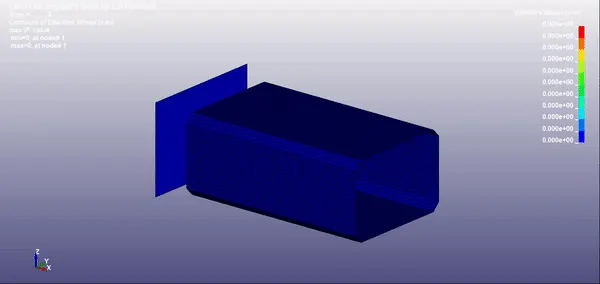
- The Maximum Von Mises Stress value is coming upto 415.9 g/(mm.ms^2) at 10 ms of simulation time.
Von Mises (1.5mm):
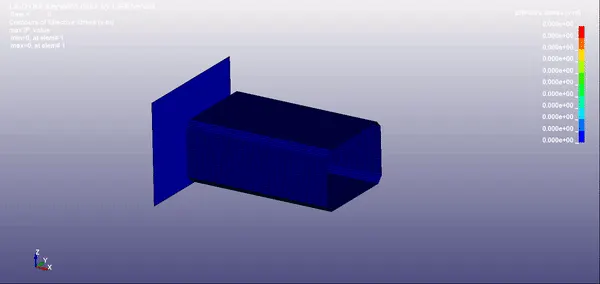
- The Maximum Von Mises Stress value is coming upto 468.7 g/(mm.ms^2) at 9 ms of simulation time.
Graphs for Thickness = 1.2mm :
Sectional Forces at the Middle of the Crash Box:
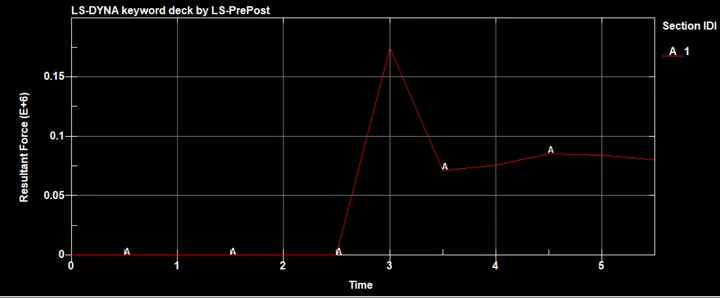
- The Sectional Force peaks at 3ms to a value of 0.175 E+6 g.mm/ms^2
Energy Values:
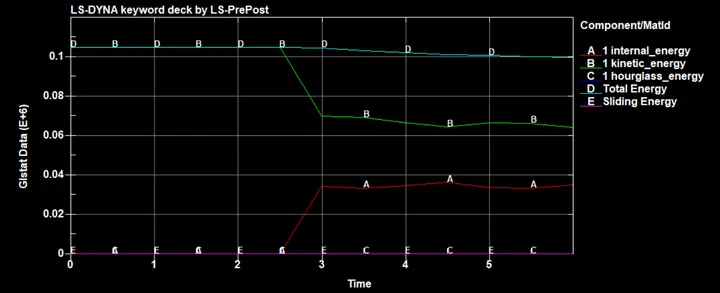
- The Simulation shows proper values according to the Law of energy conservation.
- The Total Energy is reduces slightly through the simulation.
- Kinetic Energy decreases at 3ms to a value of 0.07 E+6 g.mm^2/ms^2
- Internal Energy increases to around 0.0375 E+6 g.mm^2/ms^2 owing to the Kinetic energy getting absorbed and being converted into Internal Energy
- Hourglass and Sliding Energy remains 0 through the Simulation.
Next we plot the acceleration along x for a node at the middle of the Crash box.
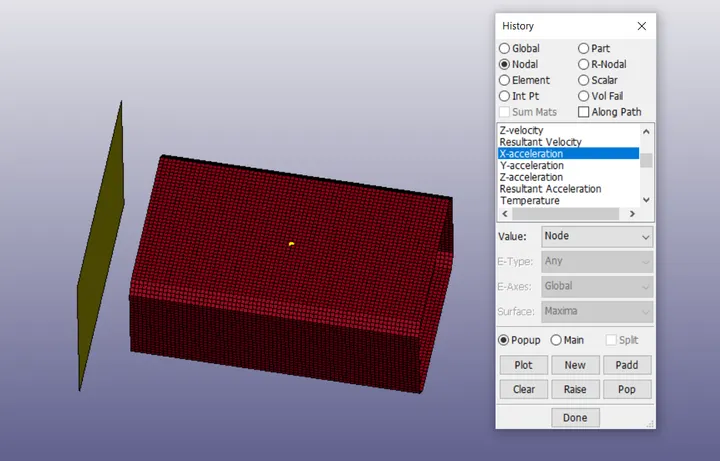
Acceleration Plot:
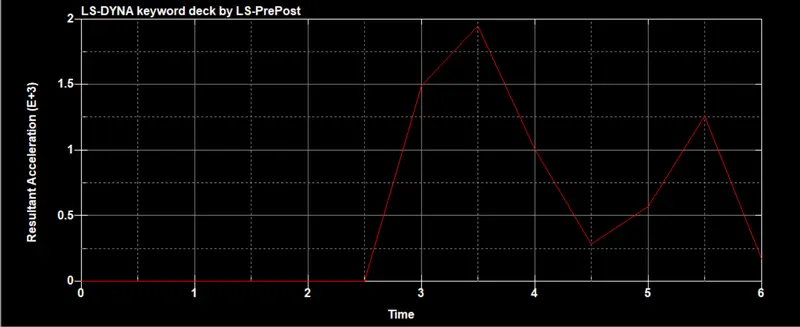
- The Acceleration reaches a maximum value of ~1.9 mm/ms^2 at 3.5 ms and reaches another peak of 1.25 mm/ms^2 at 5.5 ms after which is reduces.
X Stress:
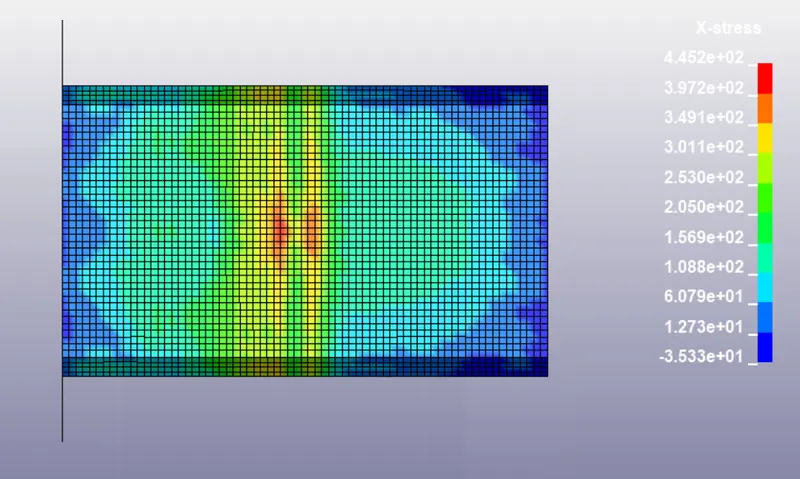
- The Maximum values of Directional Stress along X is found to be 4.452 E+2 g/mm.ms^2 at the red regions shown in the contour plot.
Y Stress:
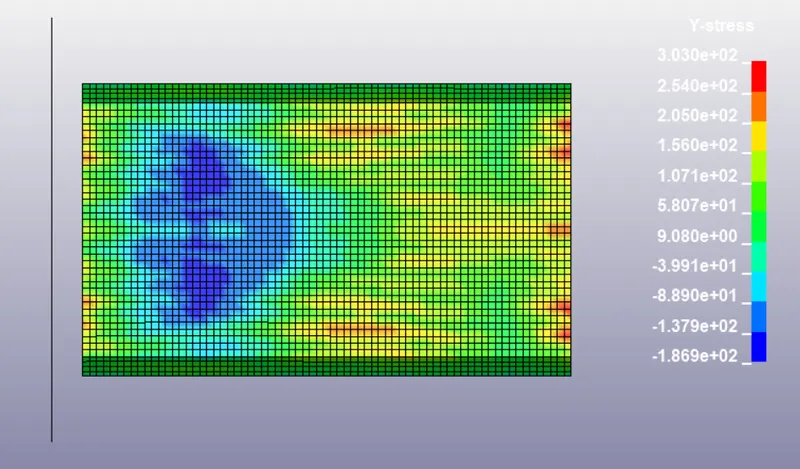
- The Maximum values of Directional Stress along Y is found to be 3.030 E+2 g/mm.ms^2 at the red regions shown in the contour plot.
X Strain:
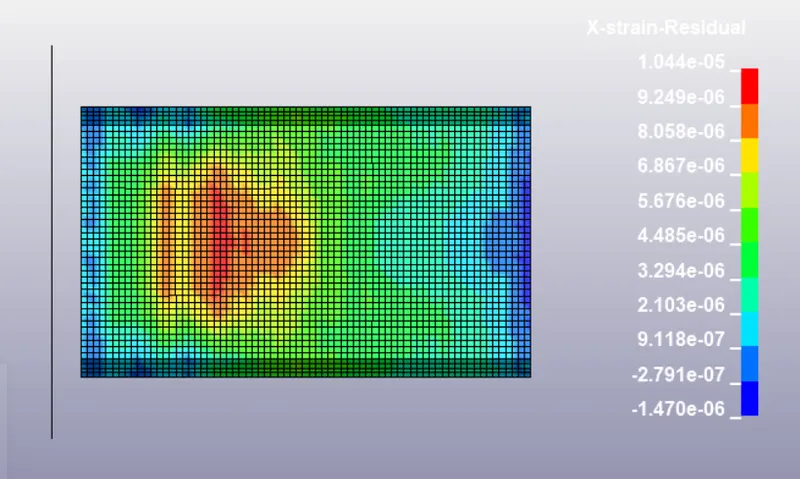
- The Maximum values of Directional Strain along X is found to be 1.044 E-5 at the red regions shown in the contour plot.
Y Strain:
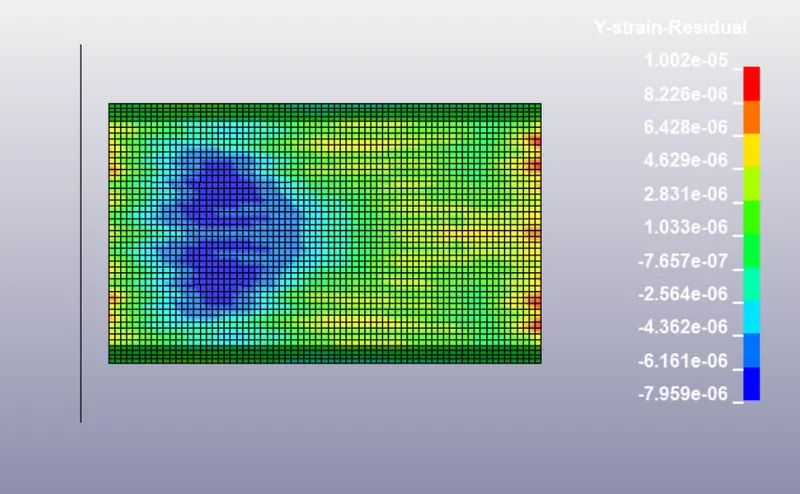
- The Maximum values of Directional Strain along Y is found to be 1.002 E-5 at the red regions shown in the contour plot.
Graphs for Thickness = 1.5mm
Sectional Force:
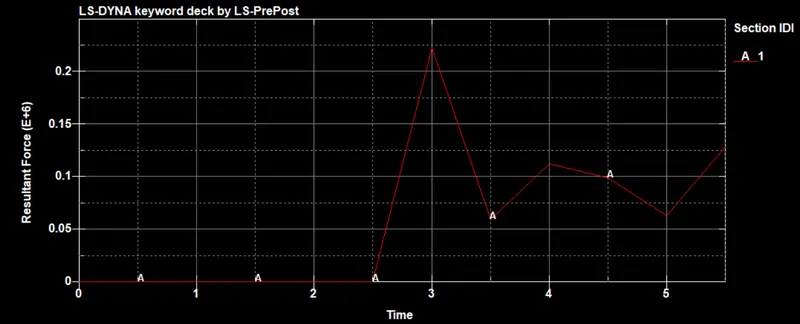
- The Sectional Force peaks at 3ms to a value of 0.25 E+6 g.mm/ms^2
Energies:
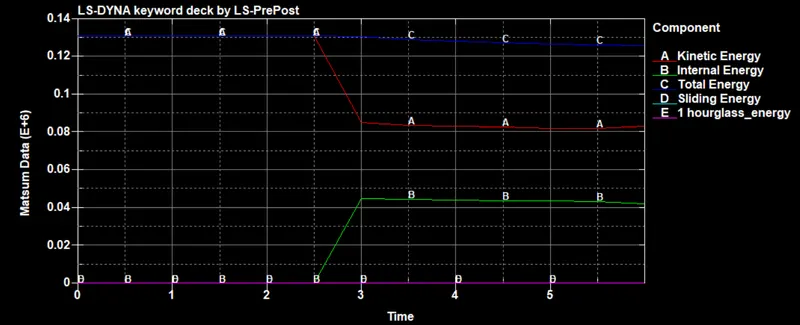
- The Simulation shows proper values according to the Law of energy conservation.
- The Total Energy is reduces slightly through the simulation.
- Kinetic Energy decreases at 3ms to a value of 0.085 E+6 g.mm^2/ms^2
- Internal Energy increases to around 0.045 E+6 g.mm^2/ms^2 owing to the Kinetic energy getting absorbed and being converted into Internal Energy
- Hourglass and Sliding Energy remains 0 through the Simulation.
Resultant Nodal Acceleration:
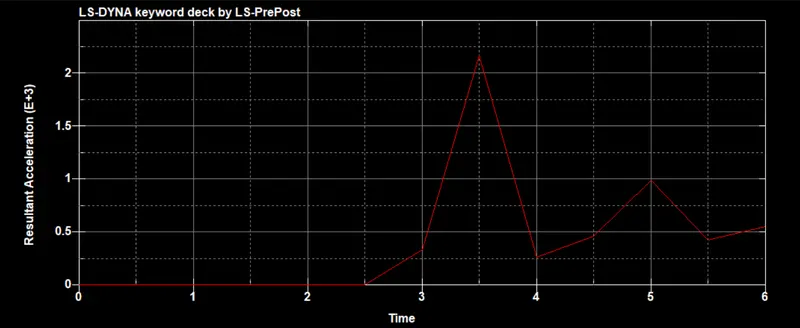
- The Acceleration reaches a maximum value of ~2.2 mm/ms^2 at 3.5 ms and reaches another peak of 1mm/ms^2 at 5.5 ms after which is reduces.
X Stress:
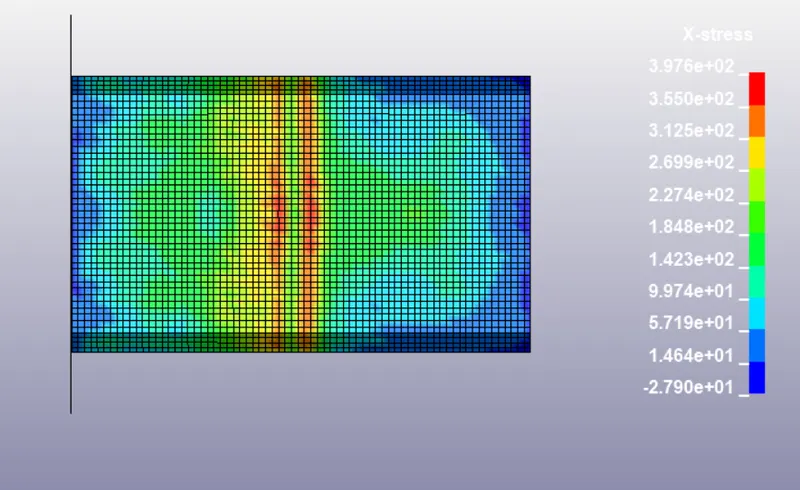
- The Maximum values of Directional Stress along X is found to be 3.976 E+2 g/mm.ms^2 at the red regions shown in the contour plot.
Y Stress:
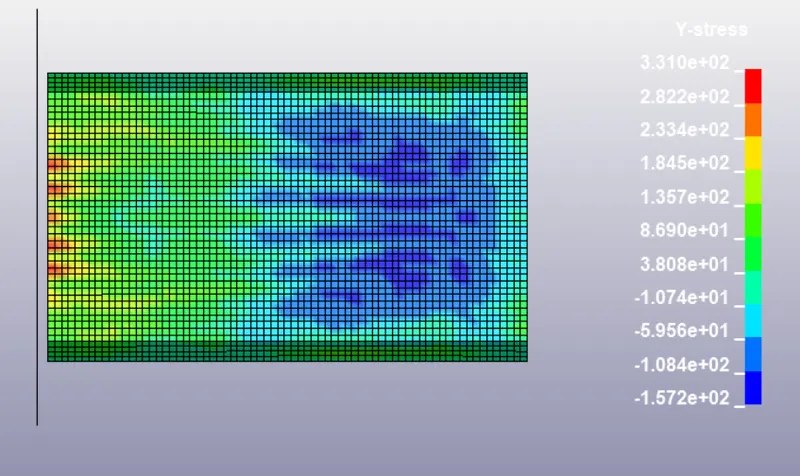
- The Maximum values of Directional Stress along Y is found to be 3.310 E+2 g/mm.ms^2 at the red regions shown in the contour plot.
X Strain:
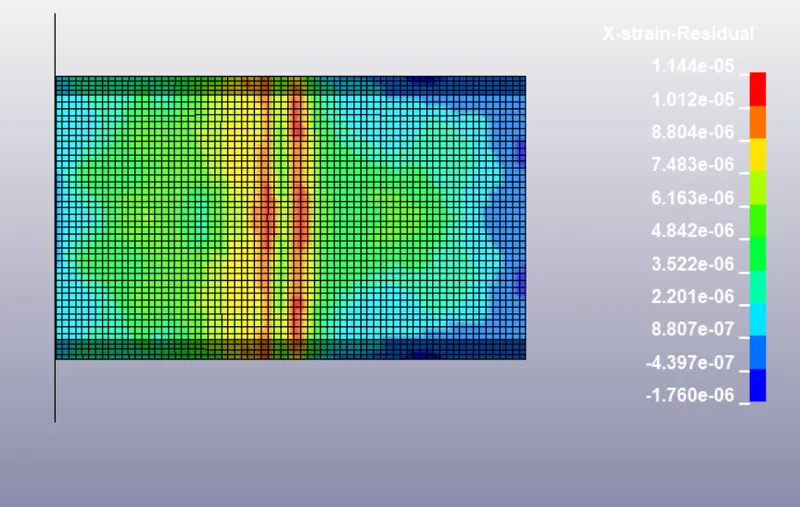
- The Maximum values of Directional Strain along X is found to be 1.144 E-5 at the red regions shown in the contour plot.
Y Strain:
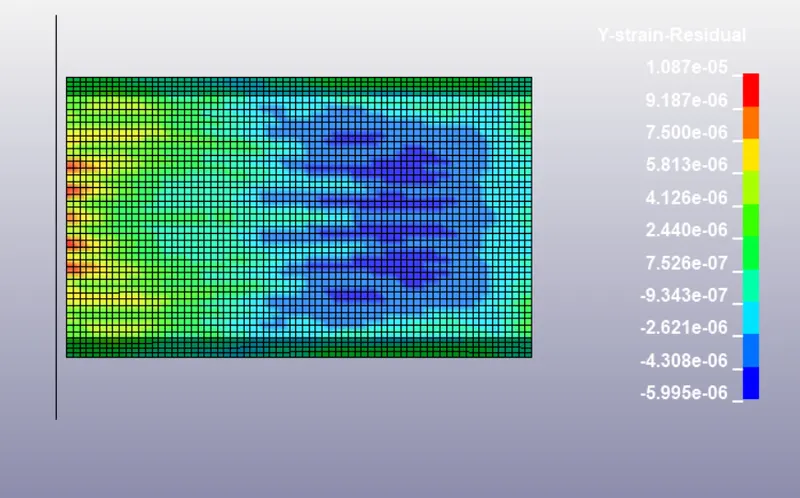
- The Maximum values of Directional Stress along X is found to be 1.087 E-5 at the red regions shown in the contour plot.
Comparison:
| Maximum Values | Thickness = 1.2 mm | Thickness = 1.5 mm |
| Sectional Force | 0.175 E+6 g.mm/ms^2 | 0.25 E+6 g.mm/ms^2 |
| X Stress | 4.452 E+2 g/mm.ms^2 | 3.976 E+2 g/mm.ms^2 |
| Y Stress | 3.030 E+2 g/mm.ms^2 | 3.310 E+2 g/mm.ms^2 |
| X Strain | 1.044 E-5 | 1.144 E-5 |
| Y Strain | 1.002 E-5 | 1.087 E-5 |
| Acceleration | 1.9 mm/ms^2 | 2.2 mm/ms^2 |
Result:
The given Crash Box Model was simulated for a simple crash test and the following outputs were obtained:
- Input .k file and output files (d3plot, glstat, sleout, rcforc)
- Animation of the final simulation
- Cross-sectional force generated in the middle of the crashbox (along its length)
- Acceleration plot of a node in the middle of the crashbox (along its length)
- Maximum directional stress and strain along the length of the crashbox (X strain, Y strain etc)
- Plot of all energies (total, internal, kinetic, hourglass, sliding)
- Compare the accelerations and stress/strain plots of 1.2/1.5mm crashboxes