Week 1- Mixing Tee
Objective;
Here we have to set up a steady state simulation to compare mixing effectiveness when hot inlet temperature is 36 C and cold inlet temperature is 19C.
Procedure:
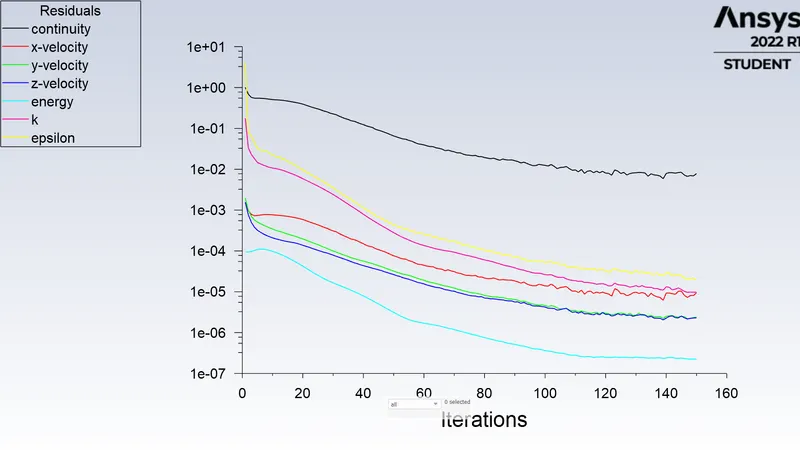
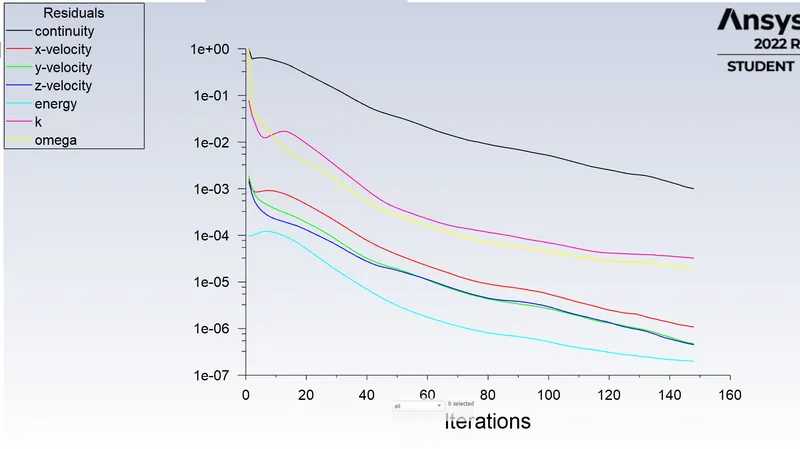
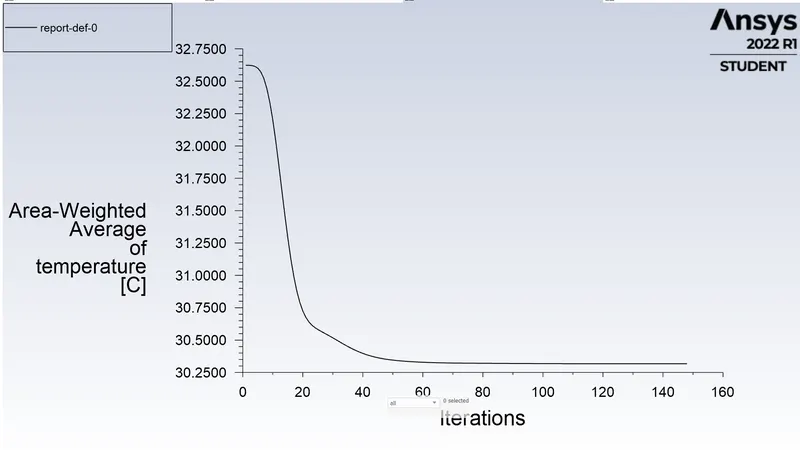
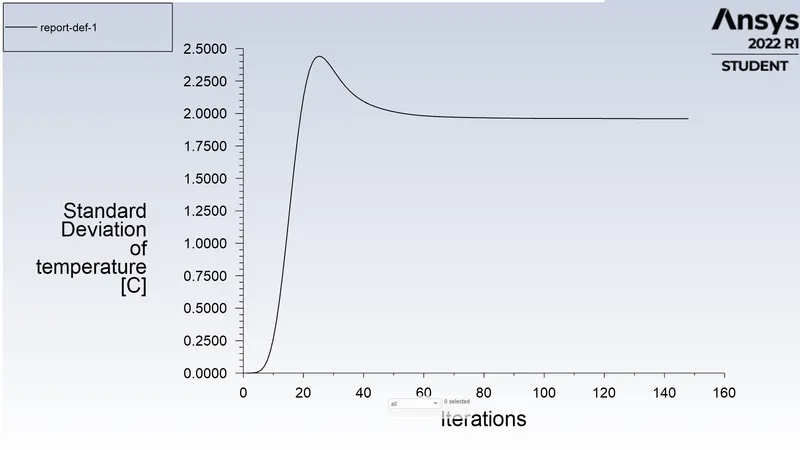
In these 2 cases we will use the k-omega model is used as it converged after a given number of iterations, this was not observed in the condition of k-epsilon.
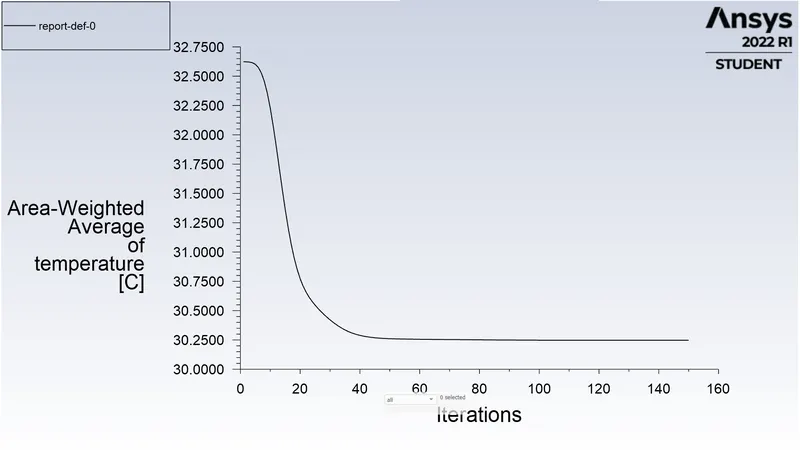
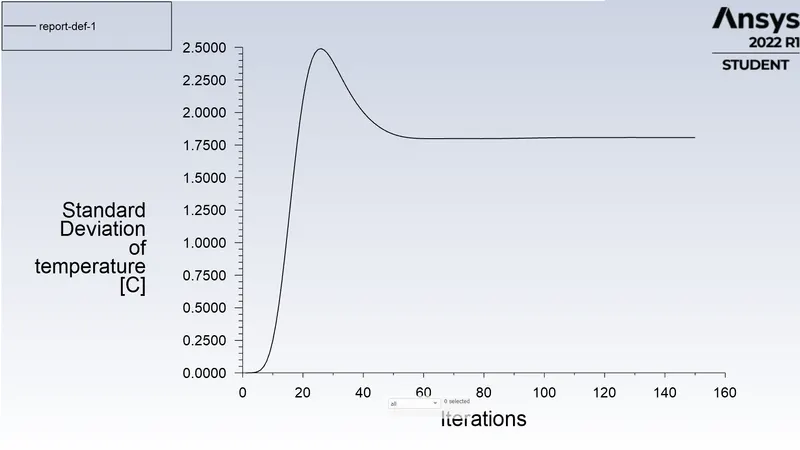
Plots of k-epsilon model
Plots of k-omega model
Case 1: Condition 1
1.a)Using k-epsilon , Momentum Ratio of 2
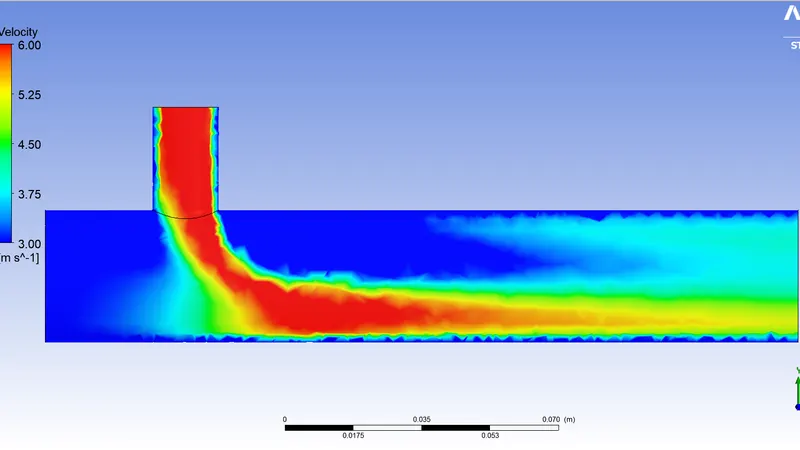
Velocity contour plot along the pipe
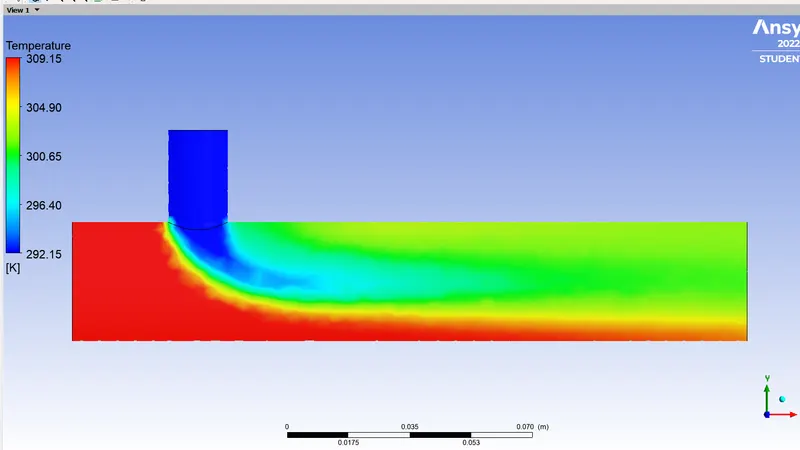
Temperature contour along the pipe
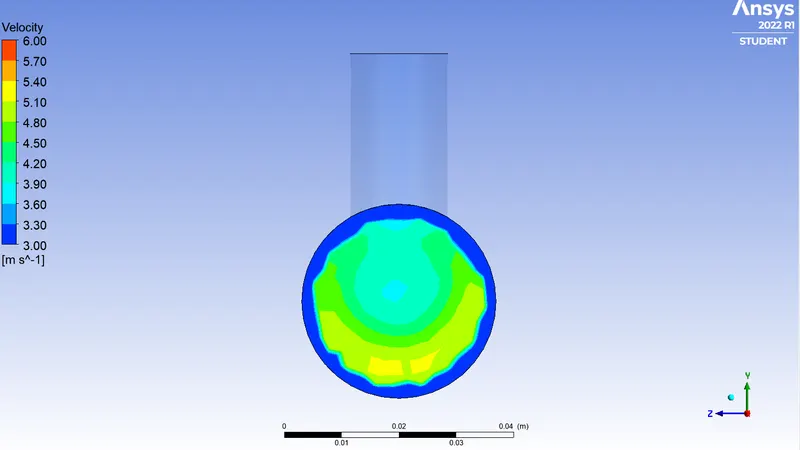
Velocity contour across the pipe
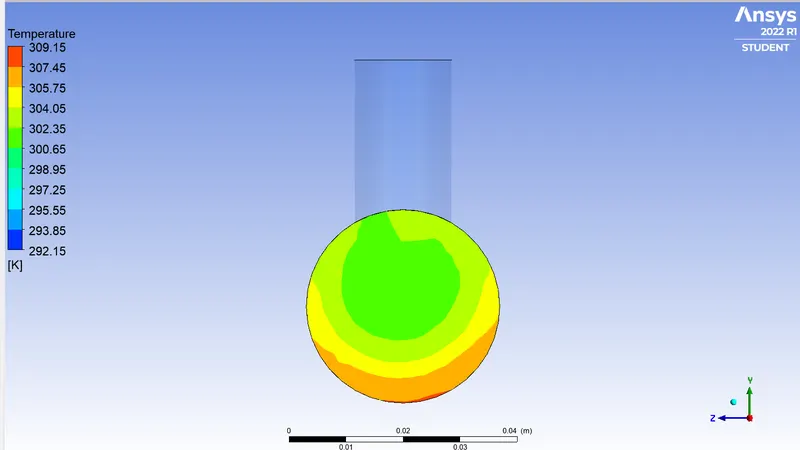
Temperature contour acorss the pipe
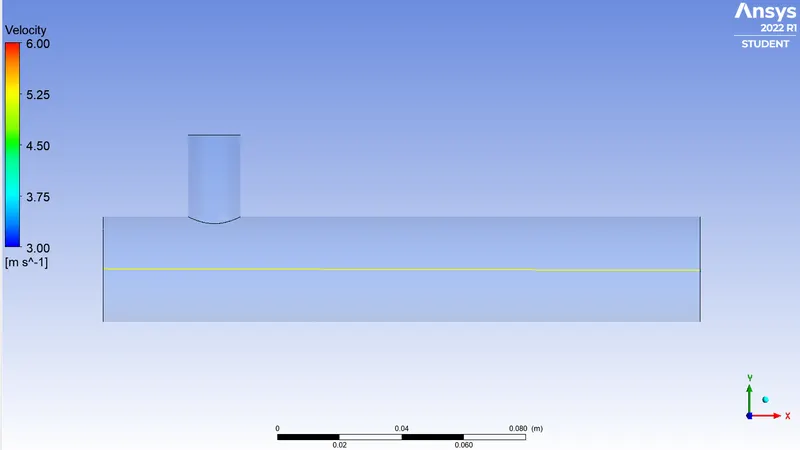
Velocity line plot along the pipe
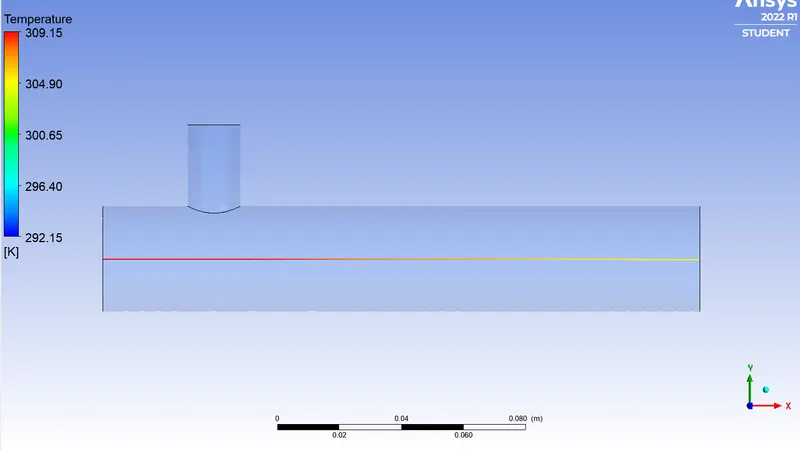
Temperature line plot along the pipe
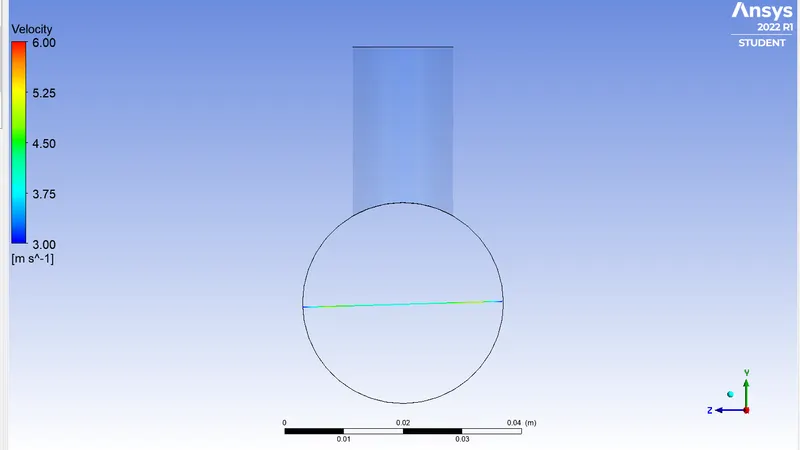
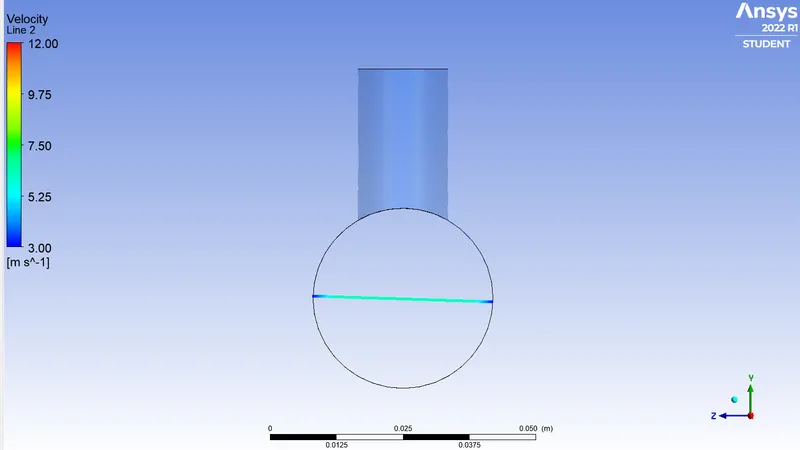
Velocity line plot across the pipe
 +
+
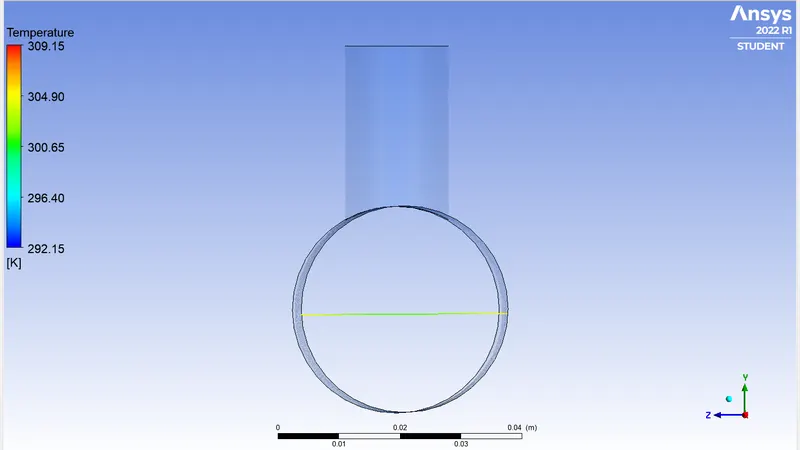
Temperature line plot across the pipe
b) Momentum ratio of 4
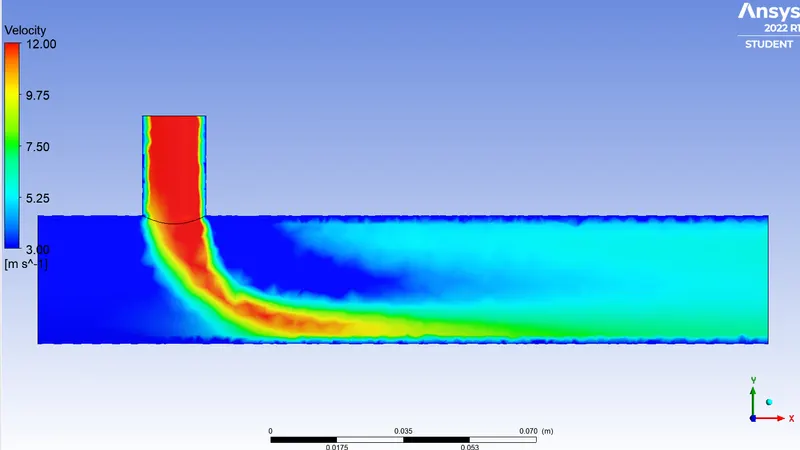
Velocity contour plot along the pipe
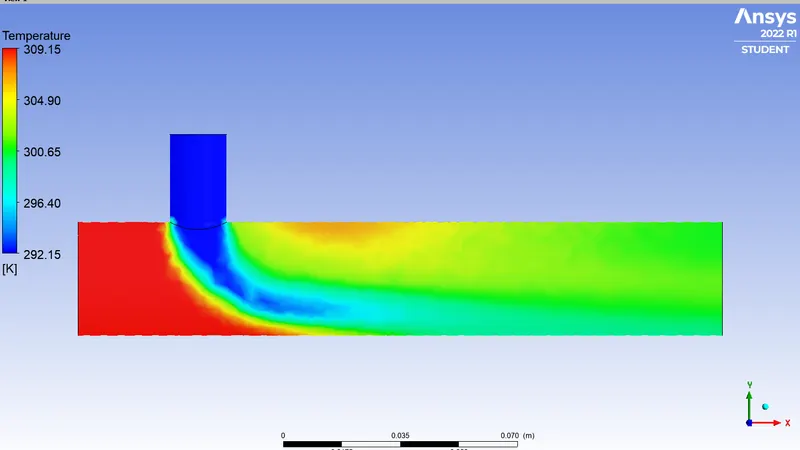
Temperature contour plot along the pipe
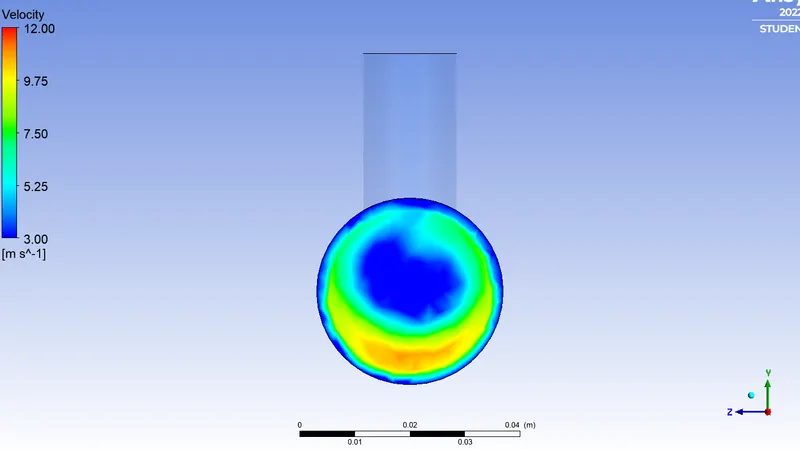
Velocity contour across the pipe
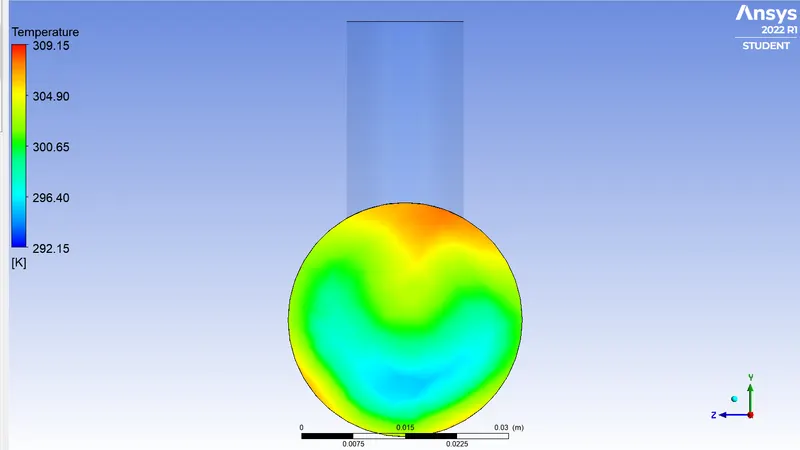
Temperature contour across the pipe
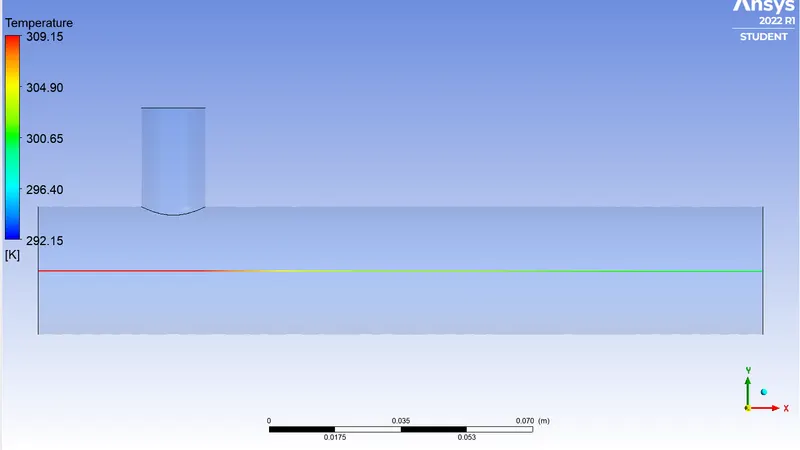
Temperature line plot along the pipe
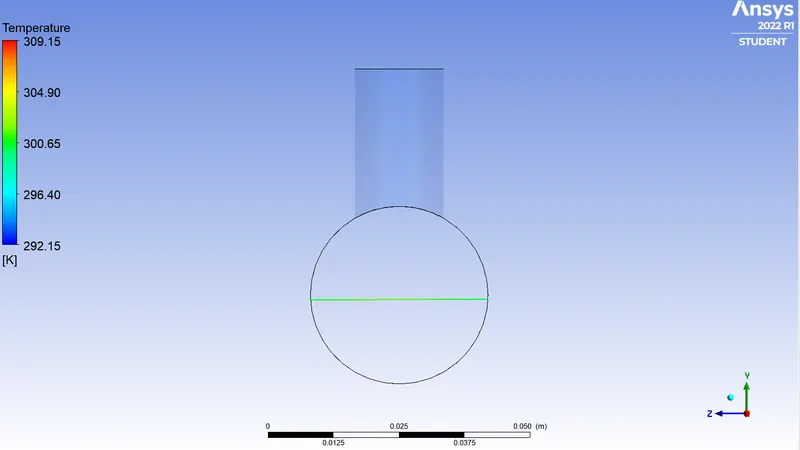
Tepmerature line plot across the pipe
Velocity line plot across the pipe
Case 1: Condition 2
1.a)Using k-omega, momentum ratio 2
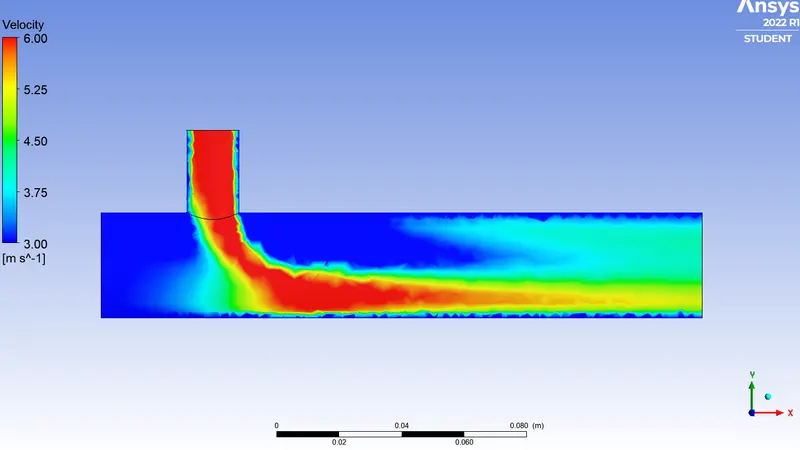
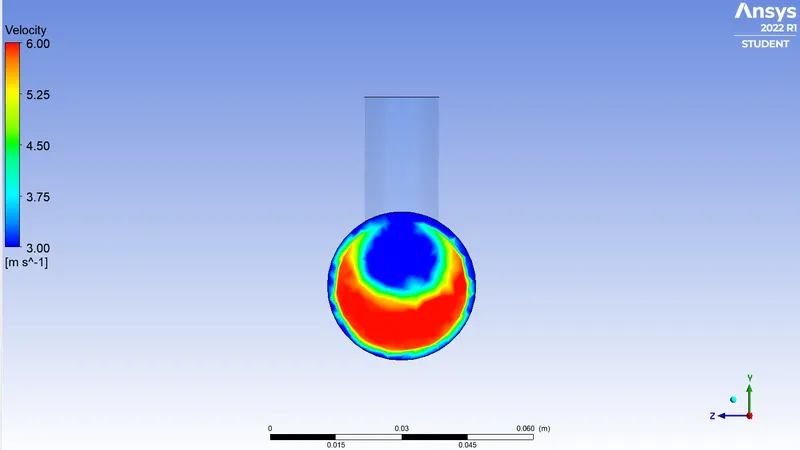
Velocity contour
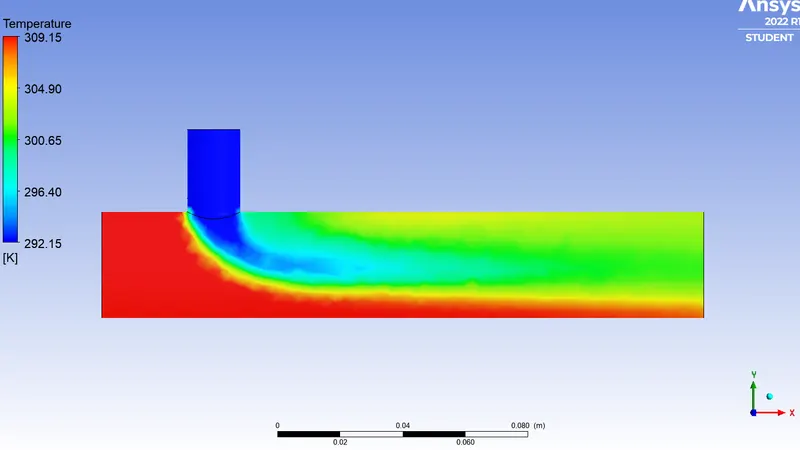
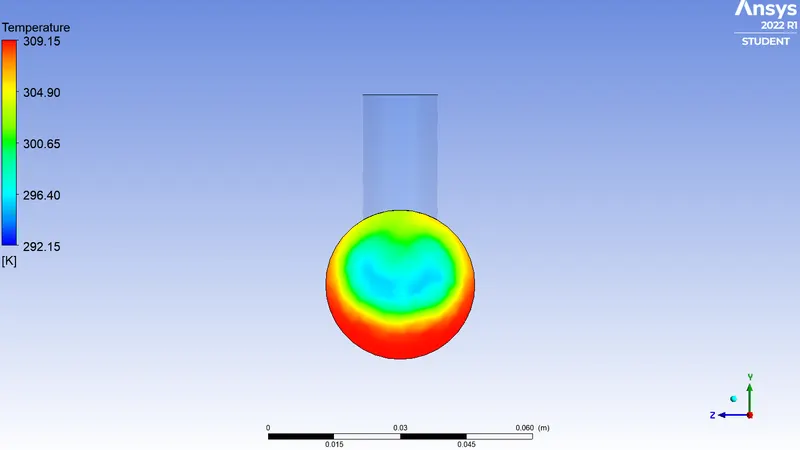
Temperature contour
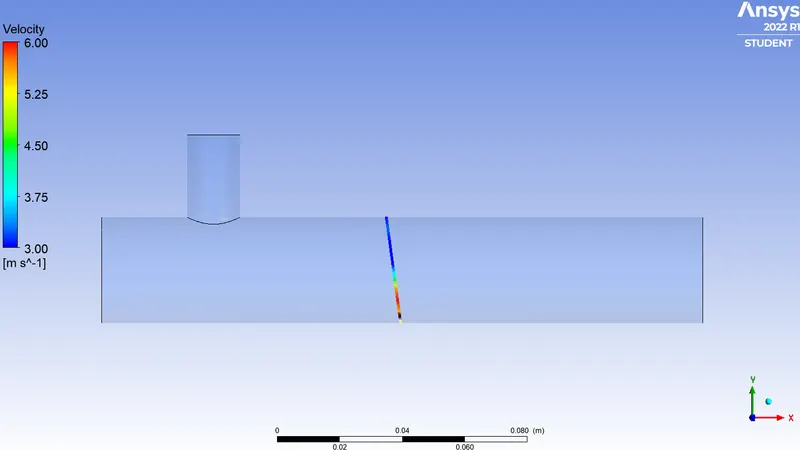
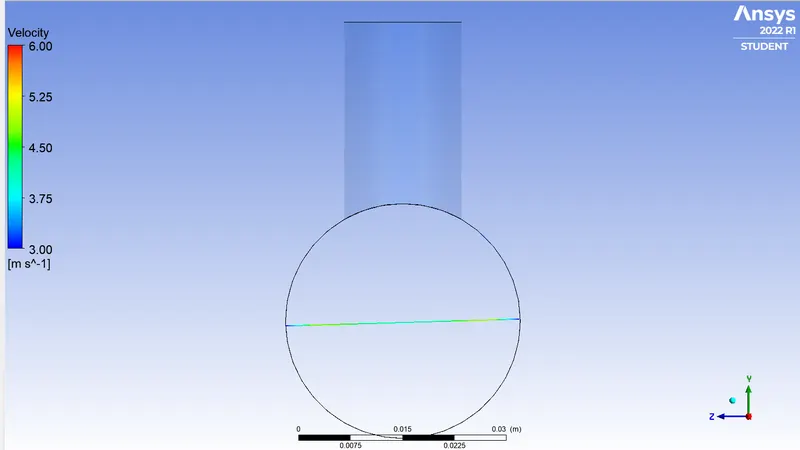
Velocity line contour
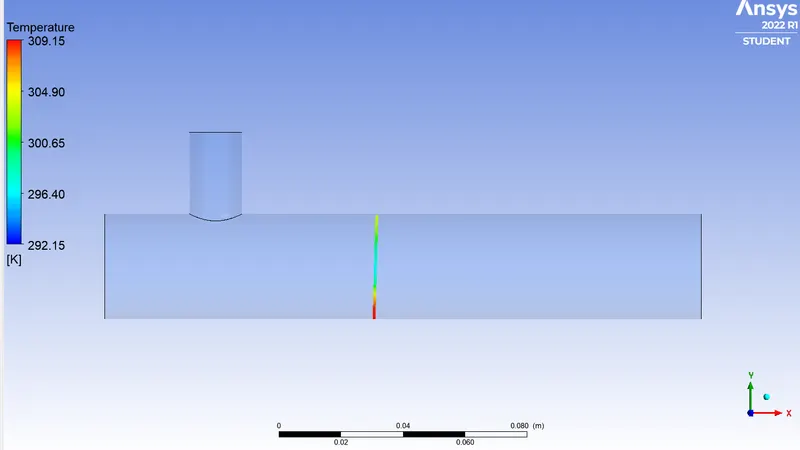
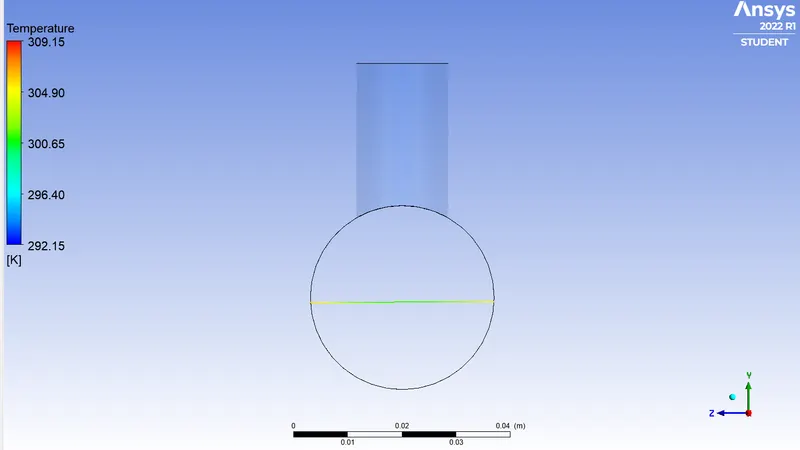
Temperature line plot
b) k-omega, momentum ratio 4
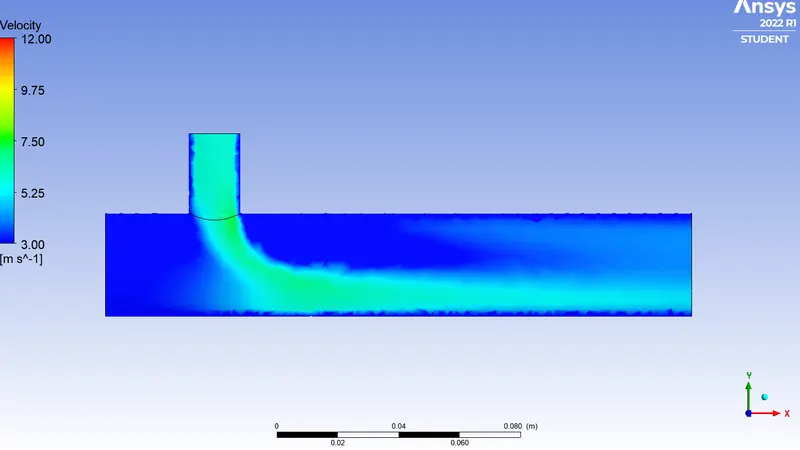
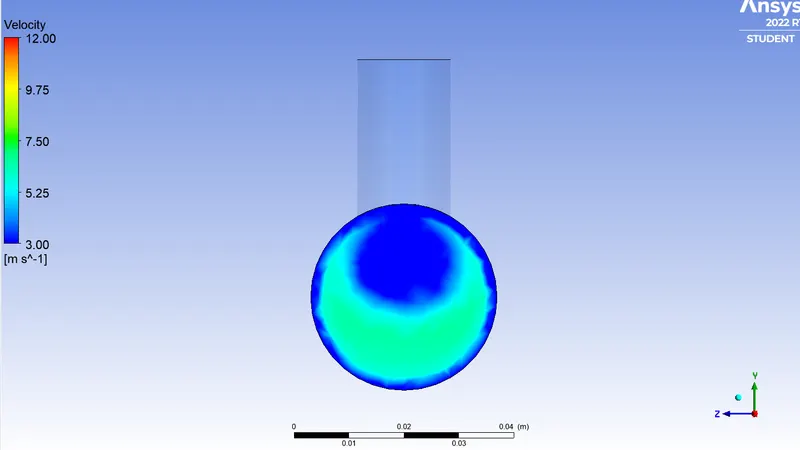
Velocity contor plot
Temperature contour plots
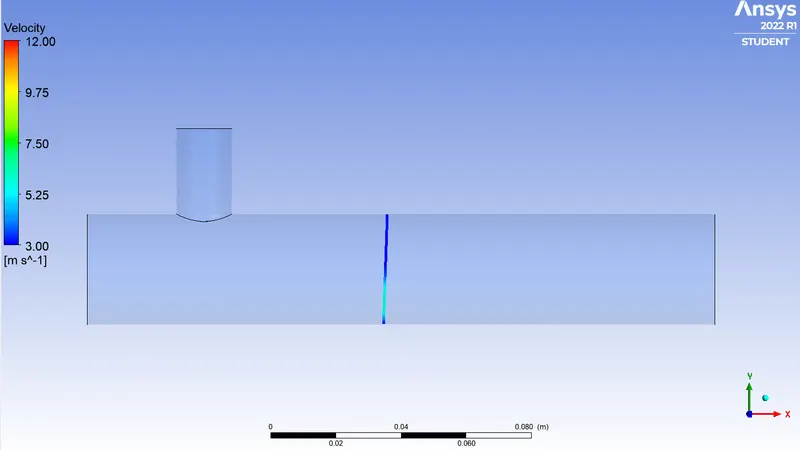
Velocity line plots
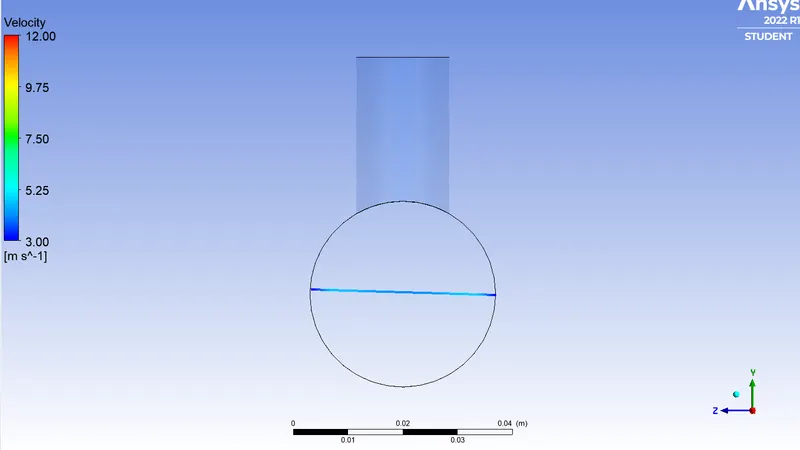
Temperature line plots
Case 2:
Using k-omega, momentum ratio 2
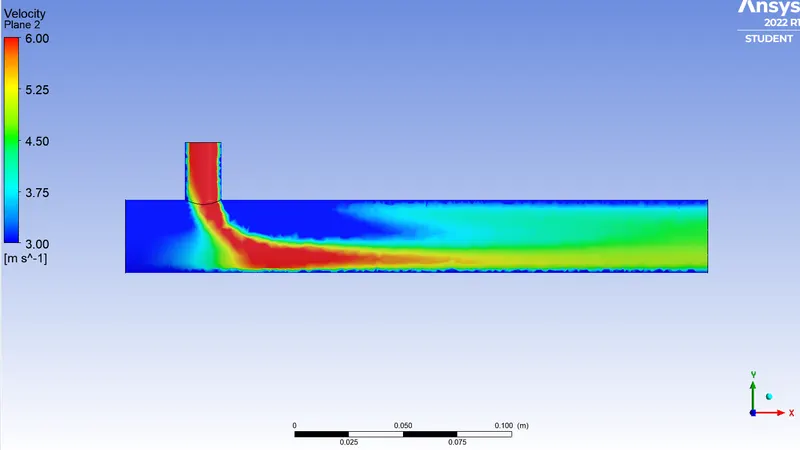
Velocity contour plots
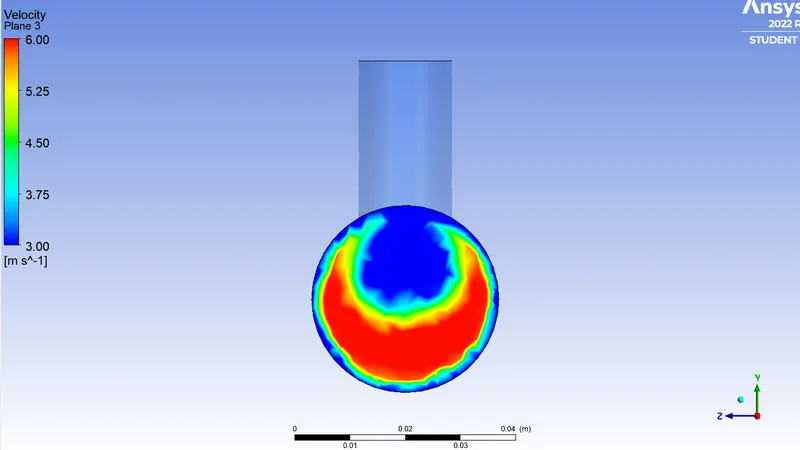
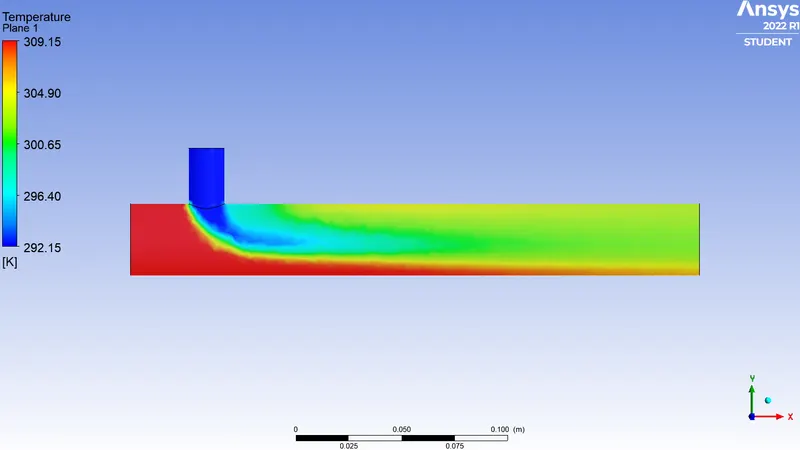
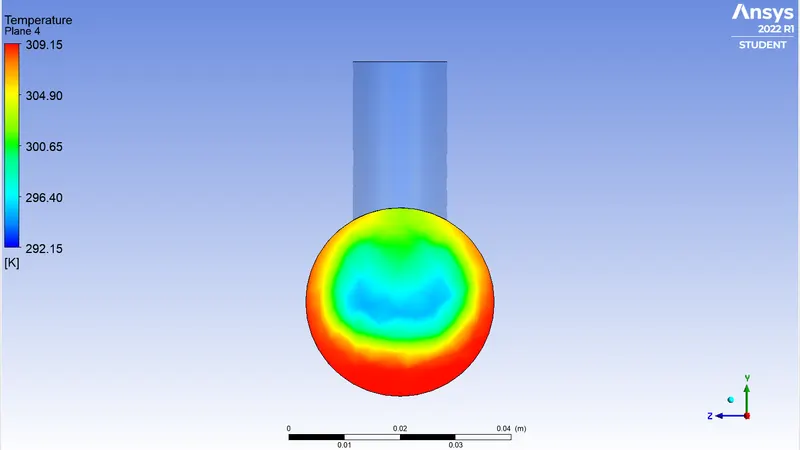
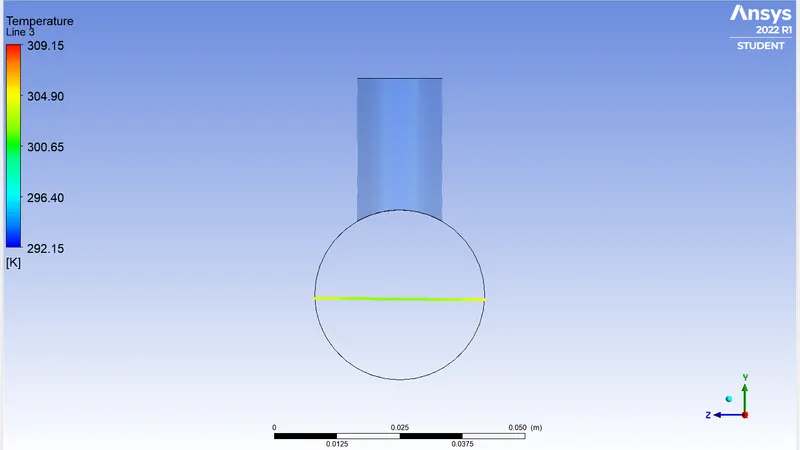
Temperature contour plots
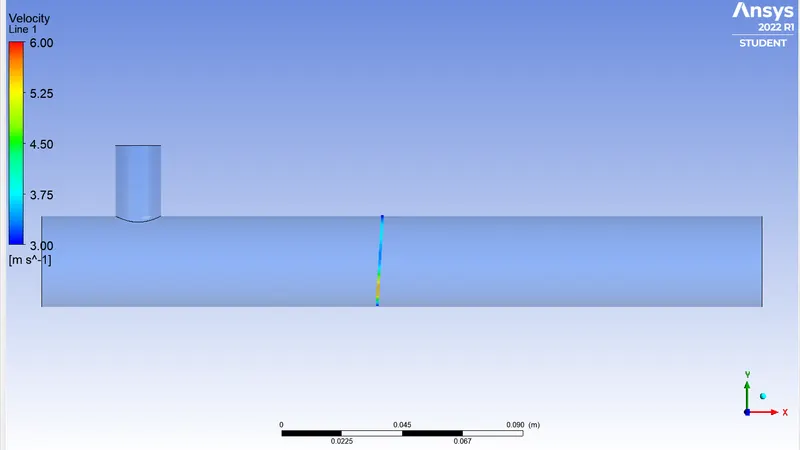
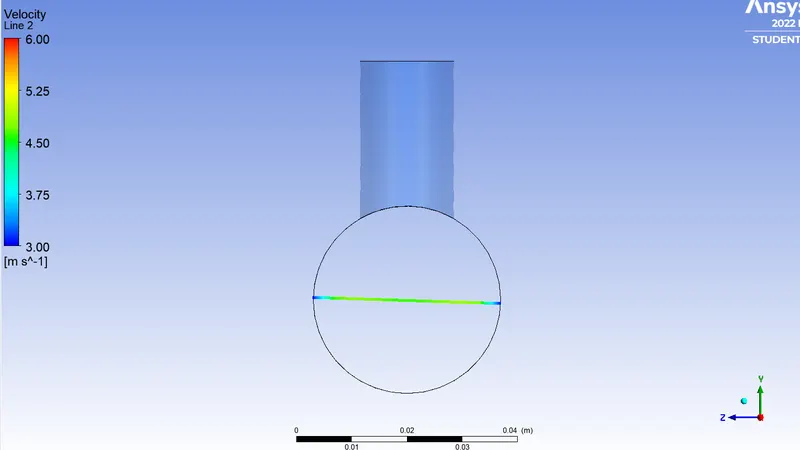
Velocity line plots
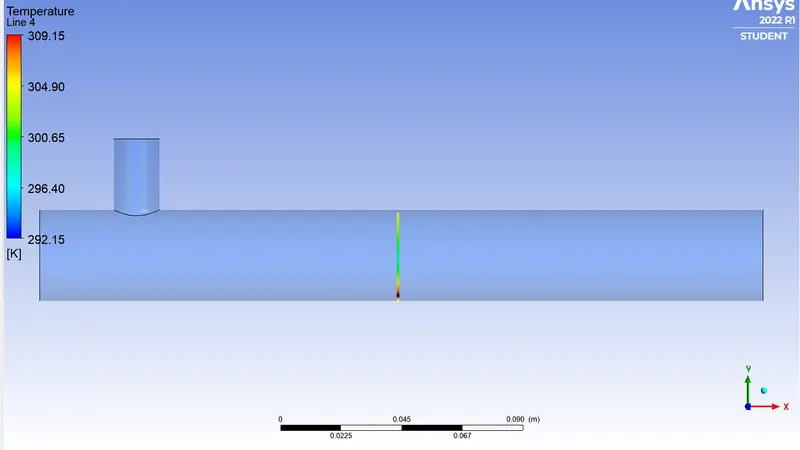
Temperature line plots
b)k-omega,momentum ratio of 4
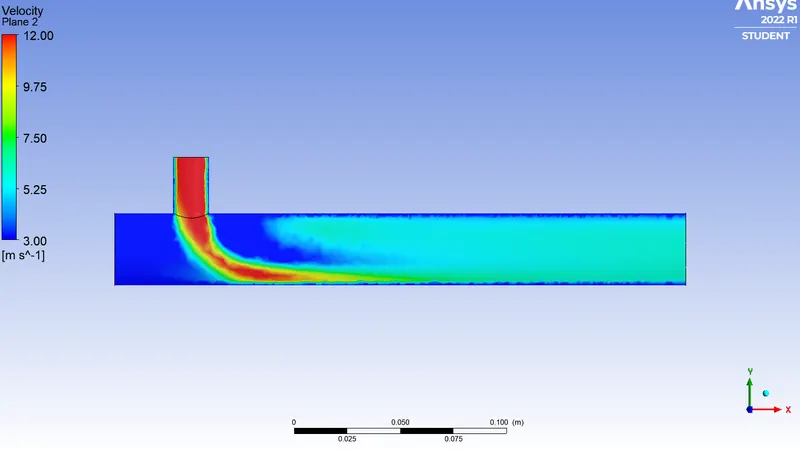
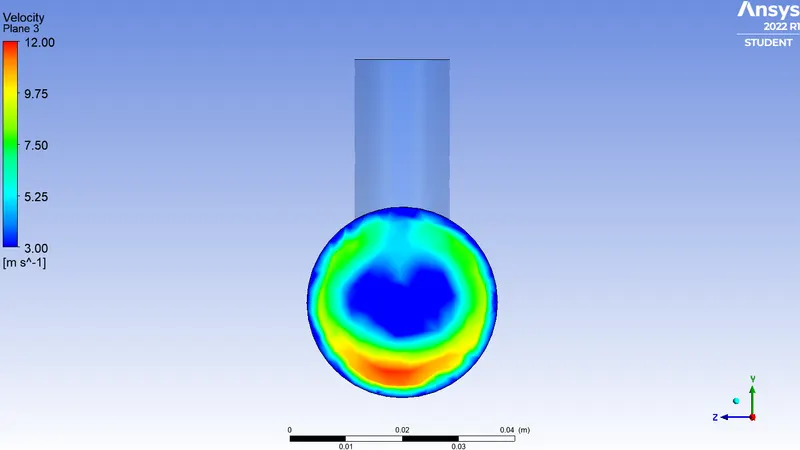
Velocity contour plots
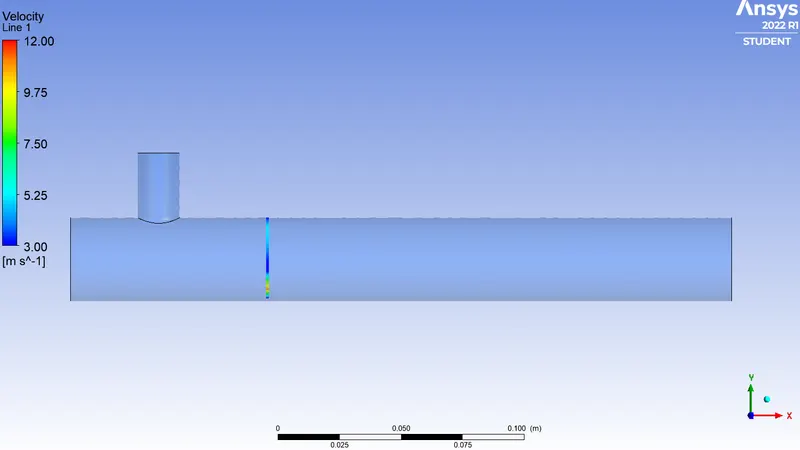
Velocity Line plots
| Cell count | Average outlet temperature | Number of iterations of convergence | |
| Case 1 | 39721 | 30.1 | 148 |
| Case 2 | 56878 | 30.5 | 258 |
Mesh independent study
This allows mesh refinement without effecting results.After some tests we can be ensured by solution that mesh refinement wont effect the result.Due to this we can prepare less number of element mesh also for simulations.the main advantage here is to decrease the computaional time for solving.
Effect of length and momentum ratio
The outletb temperature is independent on the length of the mixing tee.By increasing in momentum ratio the outlet temperature is decreasing.
Conclusion
In this cahllenge we performed the analysis on a mixing tee and concluded by analysing various graphs and contours. We also provided a mesh independent study and discussed the effect of length and momentum ratio on the mixing tee for various values.