Week 8 - Simulating Cyclone separator with Discrete Phase Modelling
Aim
To perform analysis on cyclone separator and calculate the separation efficiency and pressure drop.
Introduction
Cyclones are devices that employ a centrifugal force generated by spinning gas stream to separate particles from the carrier gas. Their simple design, low maintanence costs and adaptability to wide range of operating conditions such as sizes and flow rates makes cyclones one of the most widely used particle removal devices. By using suitable materials and methods of construction, cyclones may be adapted for use in extreme operating conditions. Cyclones are important particle removal in both engineering and process removal.
Ordinarily, the cyclone separator is applicable to separate the non-viscous, nonfiber dry dust greater than 1-3 micrometers. By accurate calculation and appropriate technological structure, it can get supreme separation effect eventually. For large size granules, the separating rate can reach above 97%. The granule in a smaller size or is more light, the more difficult to separate effectively.
Currently, the cyclone separators are widely used in Shini products, they always appear on occasions that need air-solid separation. The products include HCF Cyclone Dust Separator, ACF Cyclone Dust Collector, Blower Conveying & Cyclone Dust Collector of Shini Granulator, and the conveying device of Shini Sound-proof Central Granulator.
Objectives & Results
1.Empirical models used calculate cyclone efficiency
a.Iozia & Leith models
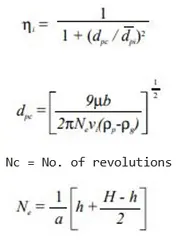
Iozia & Leith models logistic model is a modified version of Barth model which is developed based on force balance. The model assumes that a particle carried by the vortex endures the influence of two forces: a centrifugal force, Z , and a flow resistance, W. Core length, zc, and core diameter, dc , are given as
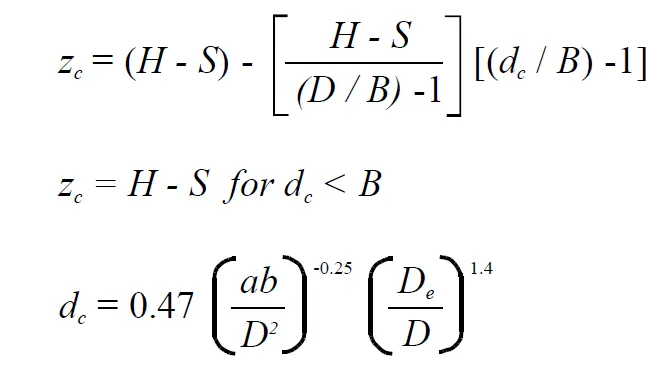
The addition made by Iozia and Leith on the original Barth (1956) model are the core length zc and slope parameter b expression which is derived based on the statistical analysis of experimental data of cyclone with D = 0.25 m. The collection
efficiency hi of particle diameter dpi can be calculated from
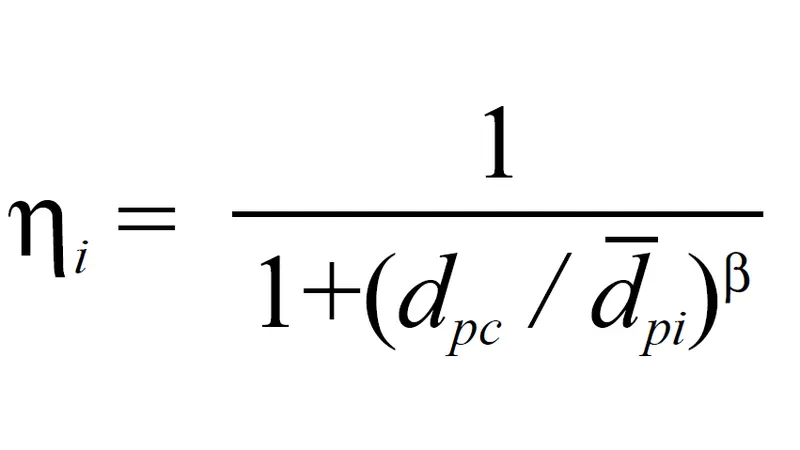
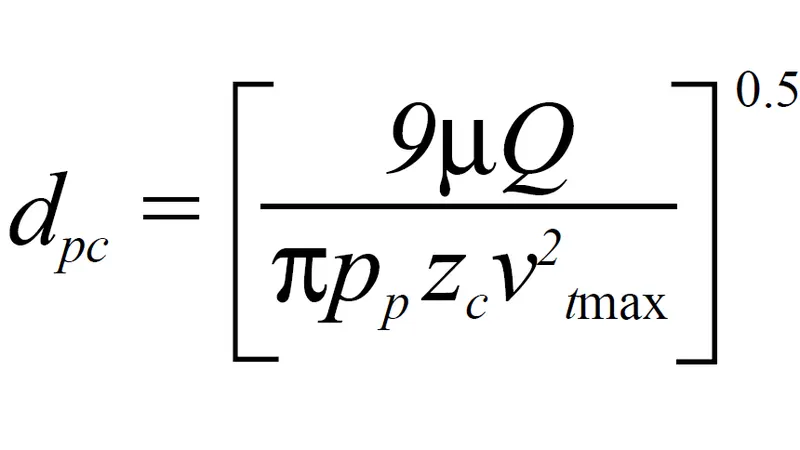
where dpc is the 50% cut size given by Barth (1956)
b.Li & Wang model
The Li and Wang (1989) model includes particle bounce or re-entrainment and turbulent diffusion at the cyclone wall. A two-dimensional analytical expression of particle distribution in the cyclone is obtained. Li and Wang model was developed based on the following assumptions:
• The radial particle velocity and the radial concentration profile are not constant, for uncollected particles within the cyclones.
• Boundary conditions with the consideration of turbulent diffusion coefficient and particle bounce re-entrainment on the cyclone wall are:
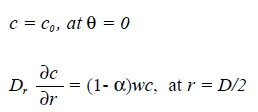
The tangential velocity is related to the radius of cyclone by: uRn = constant.
The concentration distribution in a cyclone is given as:
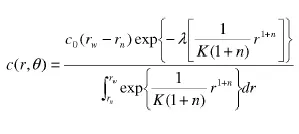
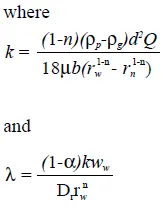
The resultant expression of the collection efficiency for particle of my size is given as,
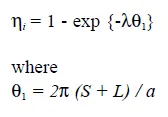
c. Koch & Licht model
Koch and Licht (1977) collection theory recognized the inherently turbulent nature of cyclones and the distribution of gas residence times within the cyclone. Koch and Licht describe particle motion in the entry and collection regions with the additional following assumption:
• The tangential velocity of a particle is equal to the tangential velocity of the gas flow, i.e. there is no slip in the tangential direction between the particle and the gas.
• The tangential velocity is related to the radius of cyclone by: uRn = constant.
A force balance and an equation on the particles collection yields the grade efficiency .
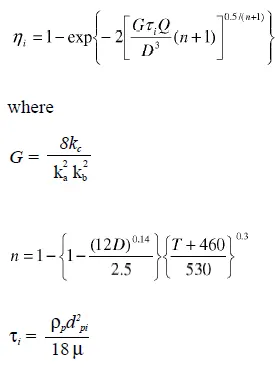
G is a factor related to the configuration of the cyclone, n is related to the vortex and t is the relaxation term.
d. Lapple model
Lapple (1951) model was developed based on force balance without considering the flow resistance. Lapple assumed that a particle entering the cyclone is evenly distributed across the inlet opening. The particle that travels from inlet half width to the wall in the cyclone is collected with 50% efficiency.
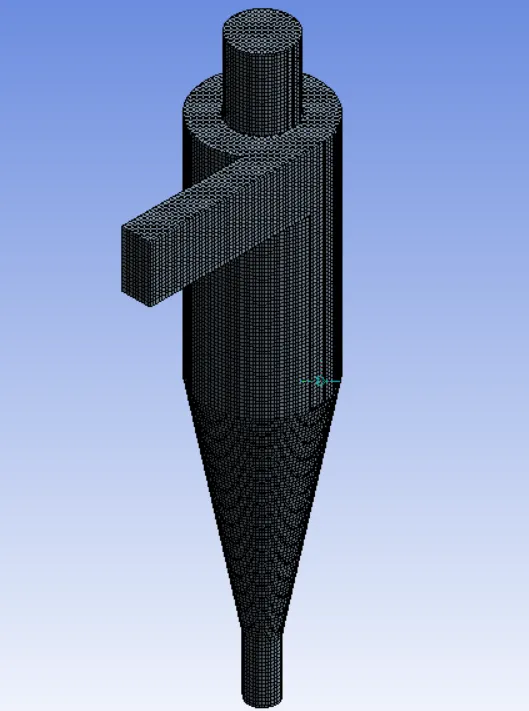
Meshing
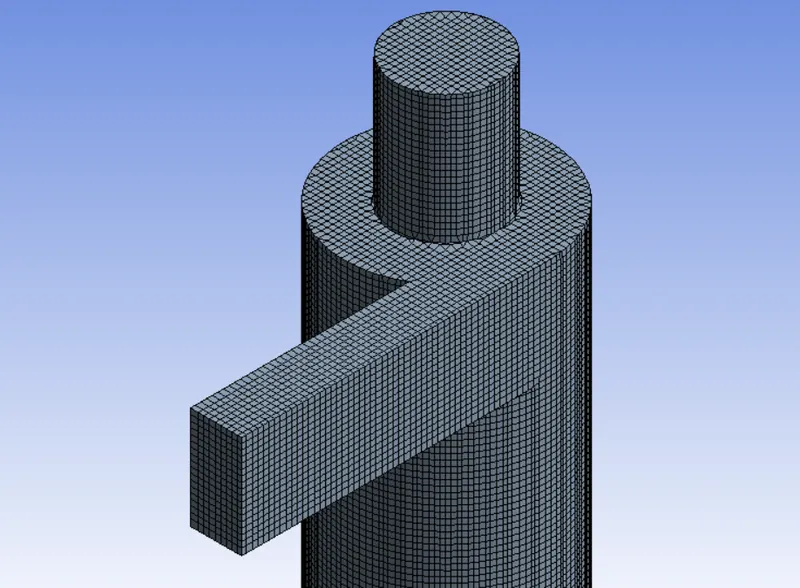
Mesh type - Body fitted cartesian
Mesh size - 5mm
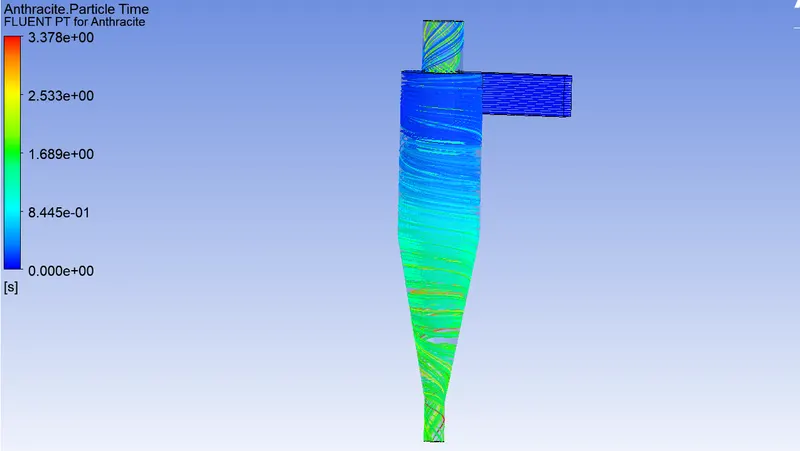
2.Performing an analysis on a given cyclone separator model by varying the particle diameter from 1 μm to 5 μm and calculating the separation efficiency in each case. Keeping the velocity constant at 3m/s.
Separation efficiency η = number of particles trapped/number of particles tracked
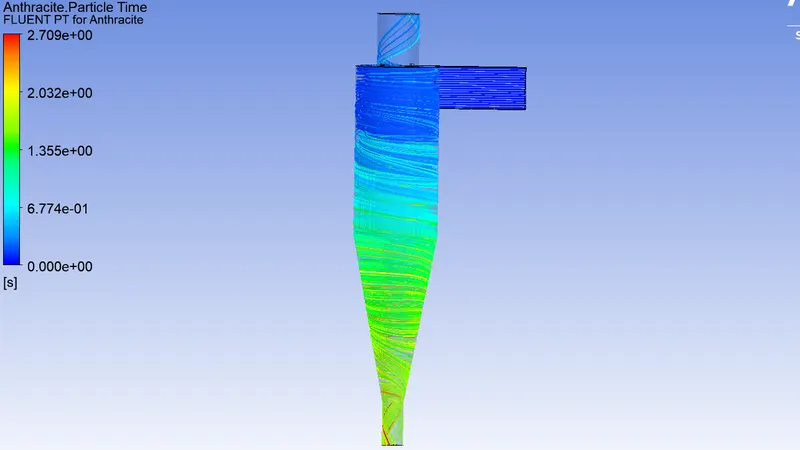
Case 1
`1 mum` at 3m/s
Number of Particles tracked=162
Number of Particles trapped=136
Number of Particles escaped=26
η=84%
Case 2
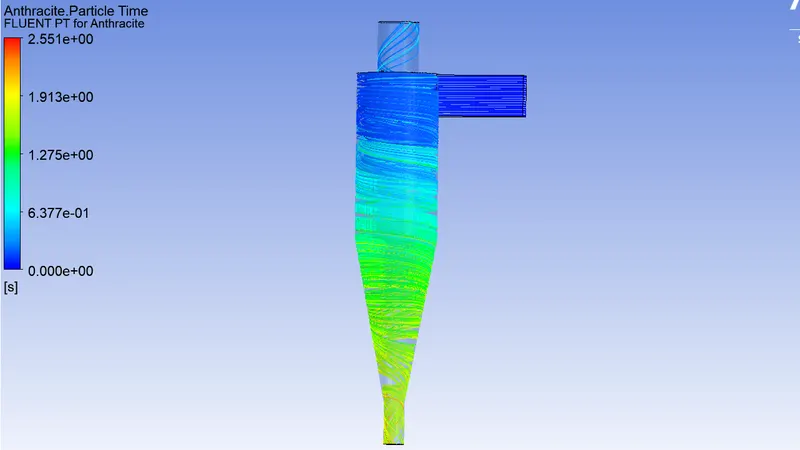
`3 mum` at 3m/s
Number of Particles tracked=162
Number of Particles trapped=135
Number of Particles escaped=27
η=83.33%
Case 3
`5mum` at 3m/s
Number of Particles tracked=162
Number of Particles Trapped=107
Number of Particles escaped=55
η=66.04%
2. Performing an analysis on a given cyclone separator model by varying the particle velocity from 1 m/sec to 5 m/sec and calculating the separation efficiency and pressure drop in each case by keeping the velocity constant.
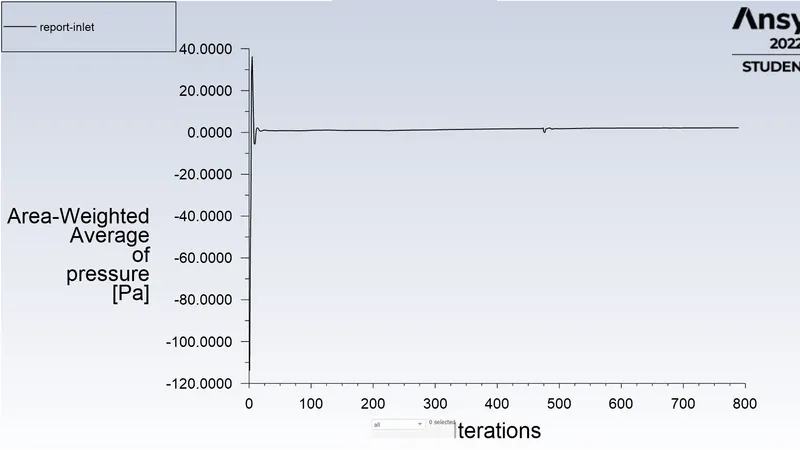
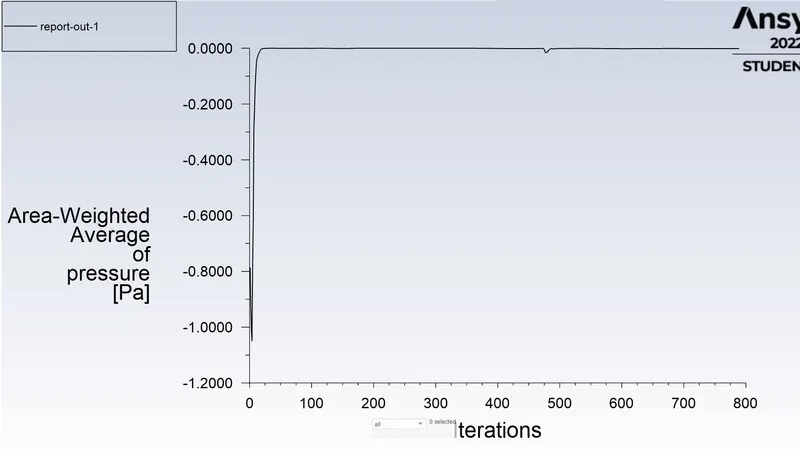
Pressure drop = Total inlet pressure - Total outlet pressure
Case 1
1 m/s with diameter of 5 μm
Number of Particles tracked=162
Number of Particles trapped=143
Number of Particles escaped=19
η=88.27%
Total inlet pressure=2.201 Pa
Total outlet pressure (top) = -0.00103 Pa
Total pressure drop=2.2 Pa
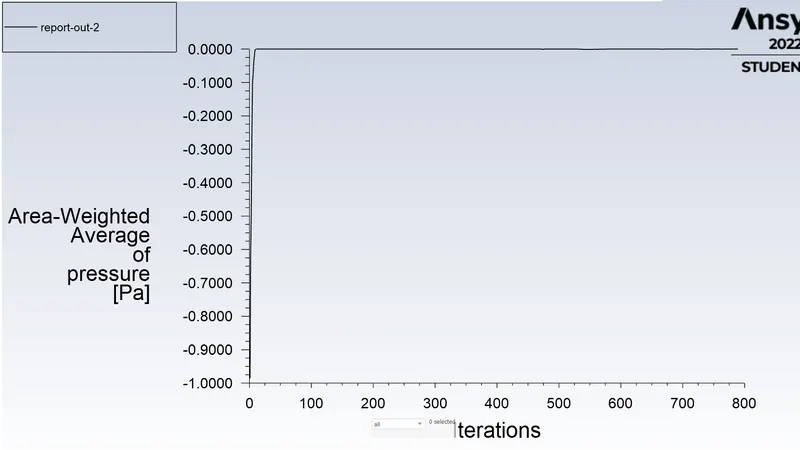
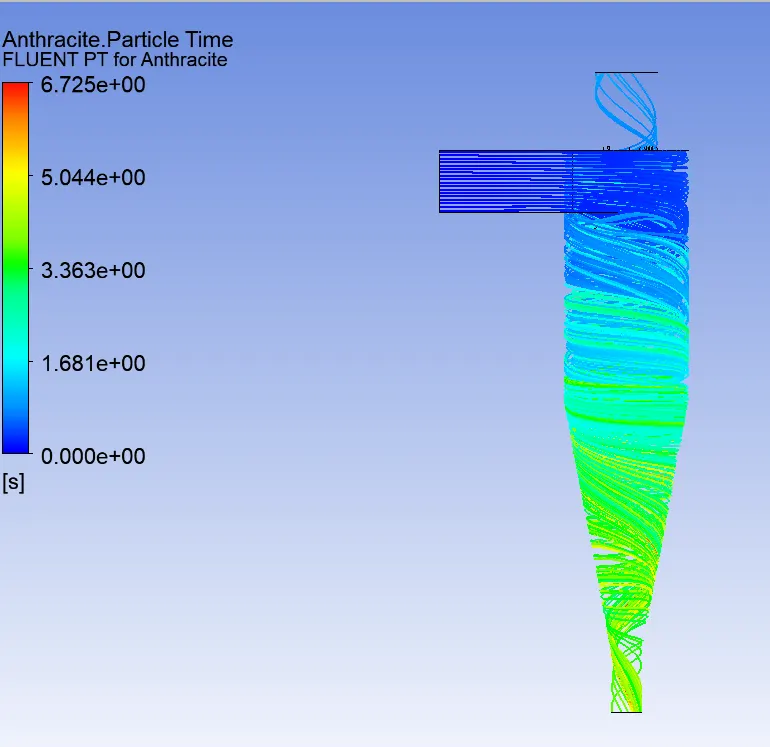
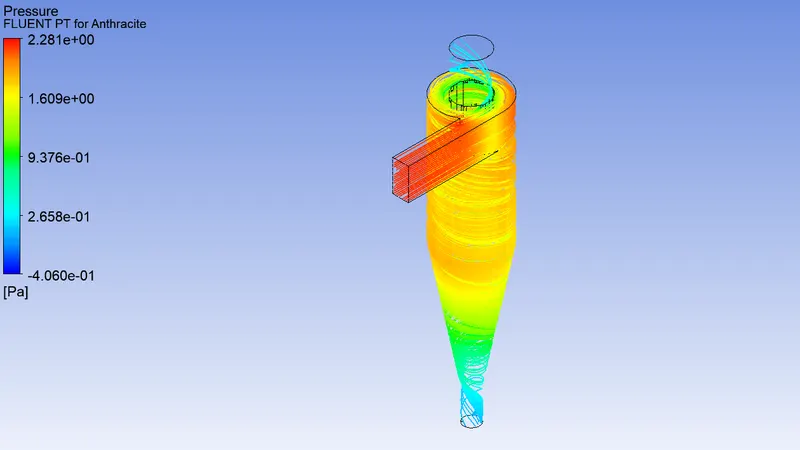
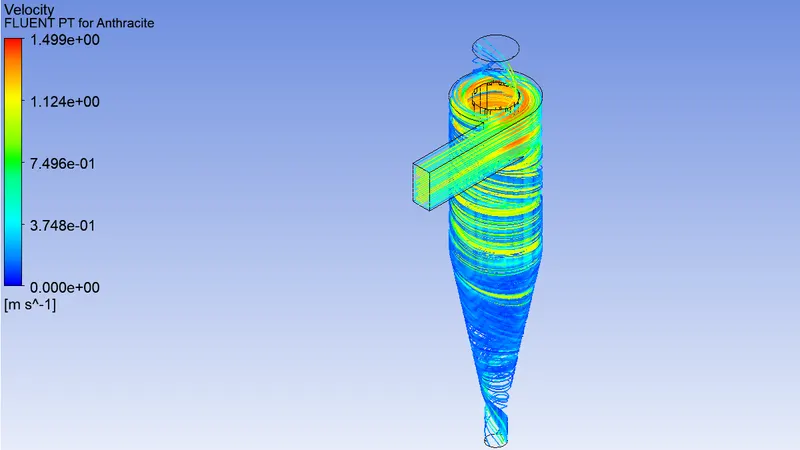
Case 2
3 m/s with diameter of 5 μm
Number of Particles tracked=162
Number of Particles trapped=107
Number of Particles escaped=55
η=66.04%
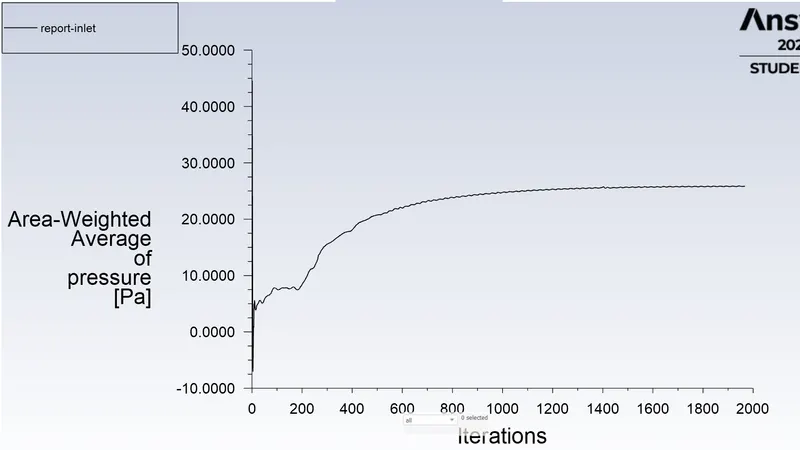
Total inlet pressure=25.88 Pa
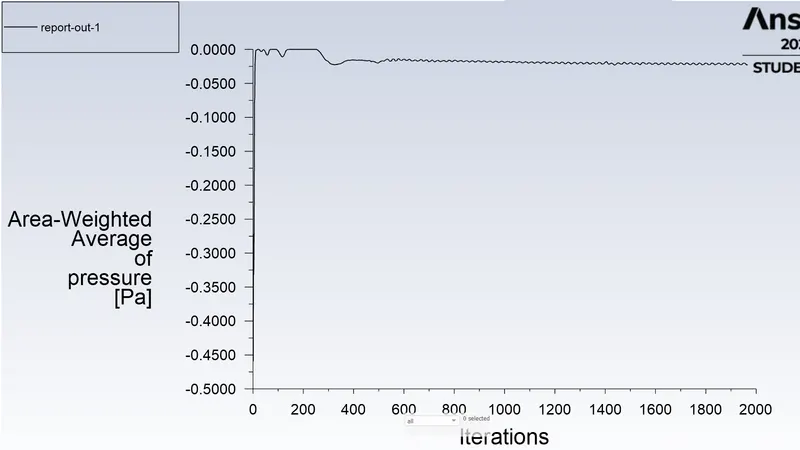
Total outlet pressure (top) = -0.0223 Pa
Total pressure drop=25.86 Pa
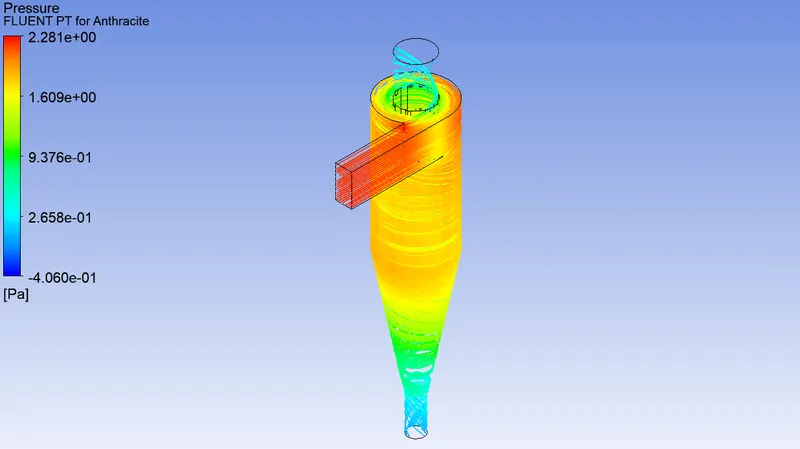
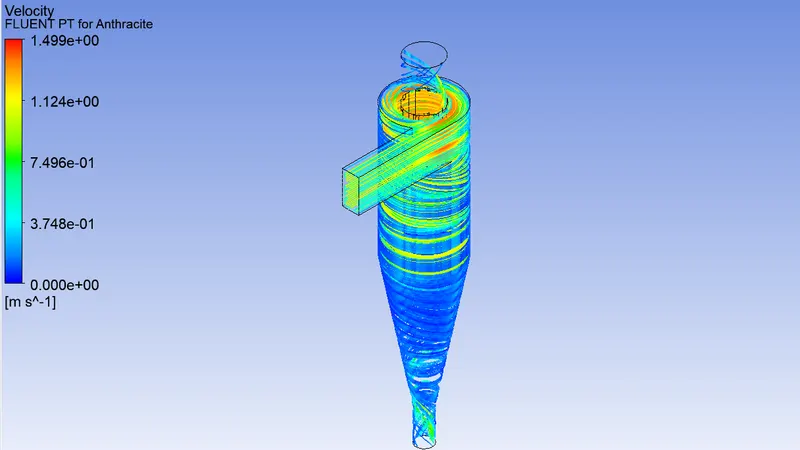
Case 3
5 m/s with diameter of 5 μm
Number of Particles tracked=162
Number of Particles trapped=135
Number of Particles escaped=27
η=83.33%
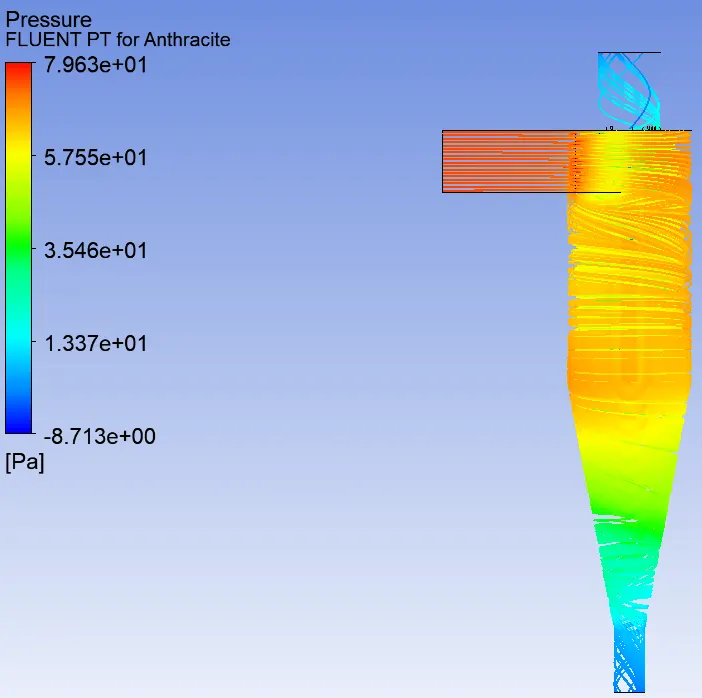
Total inlet pressure=75.67 Pa
Total outlet pressure (top) = -0.0626 Pa
Total pressure drop = 75.66 Pa
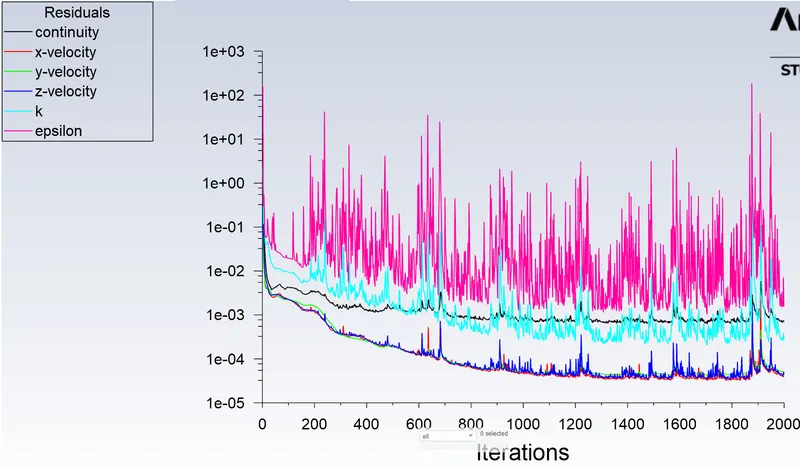
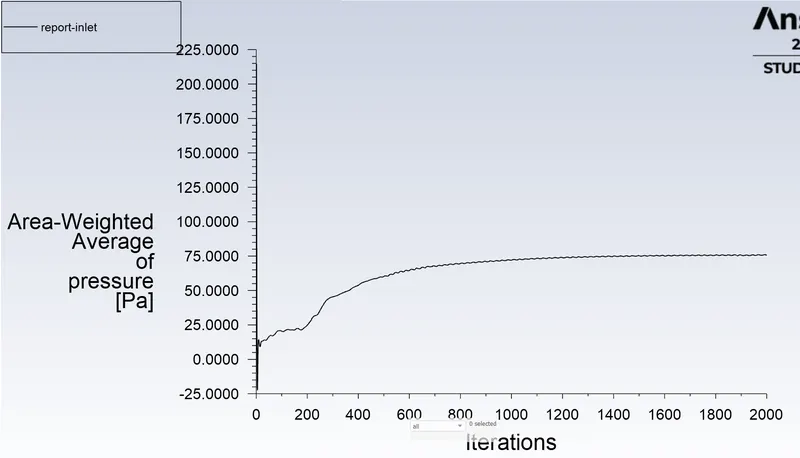
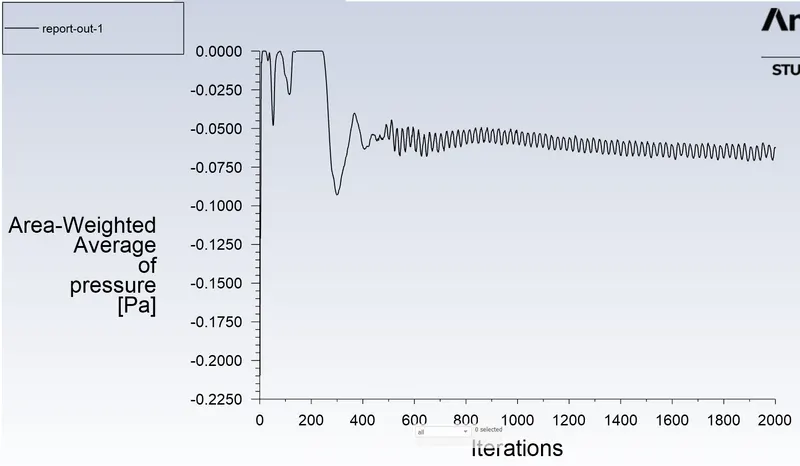
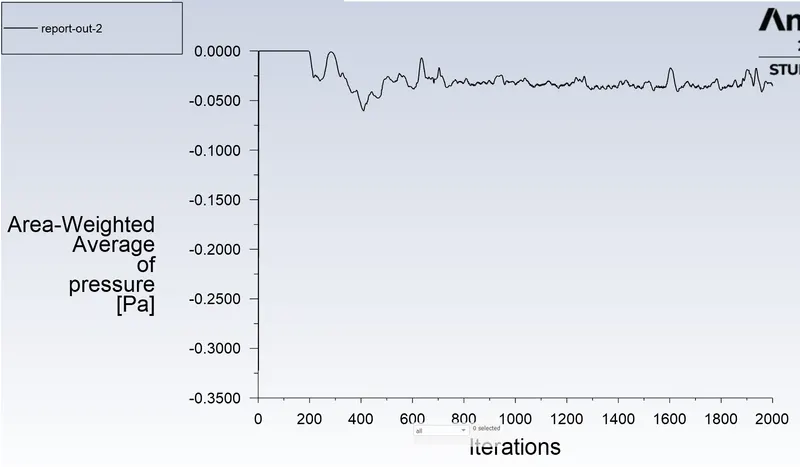
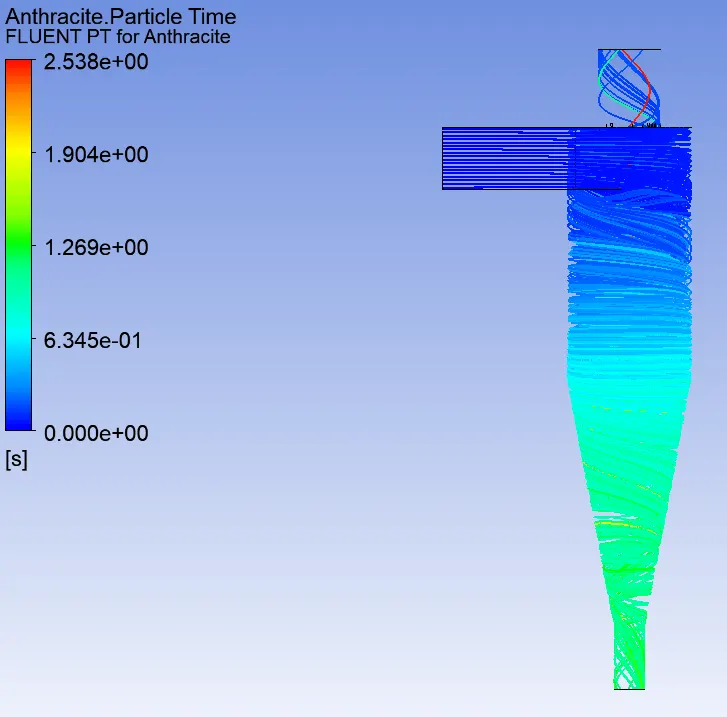
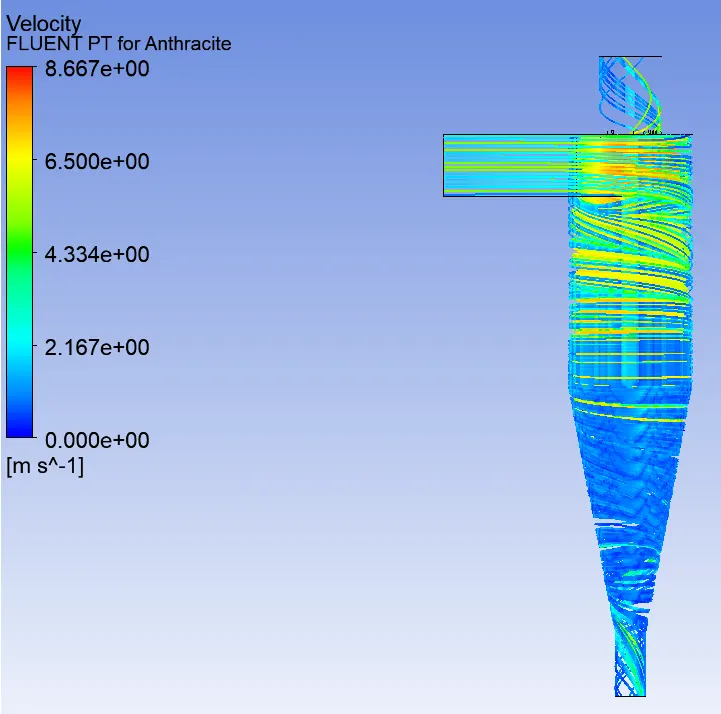
Conclusion
The Analysis was done for the above given objectives -
Case1
Same particle diameter and varying velocities
Case 2
Same particle velocity with different diameter.
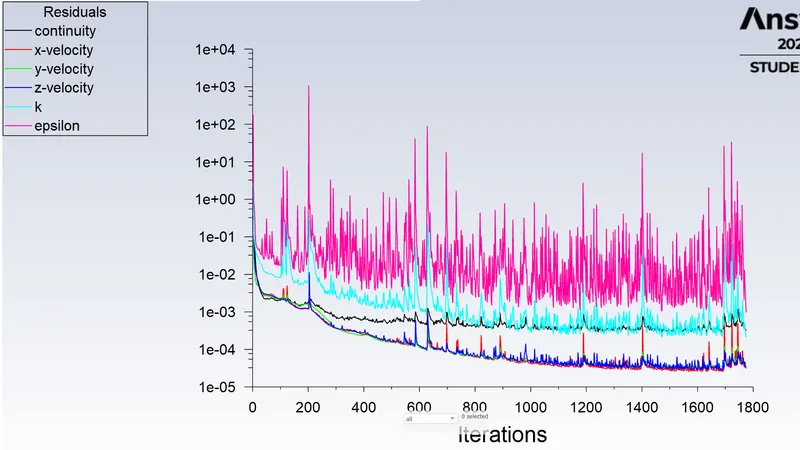
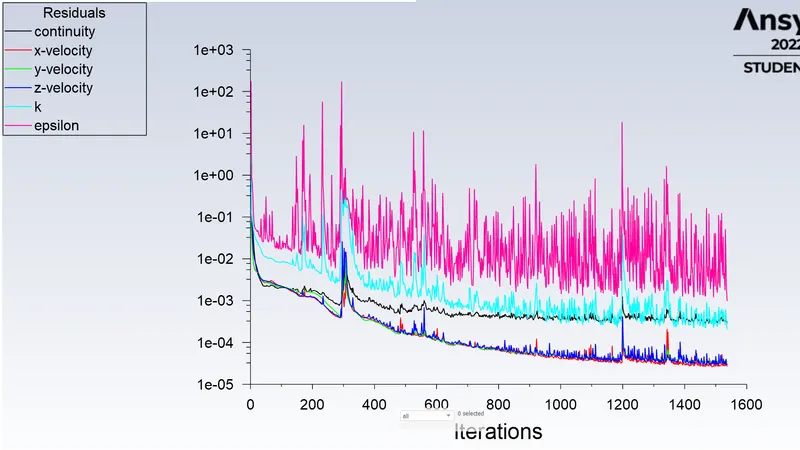
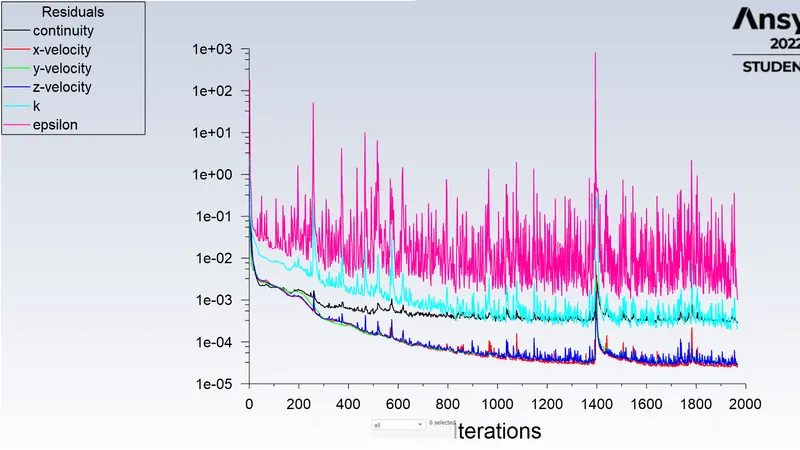
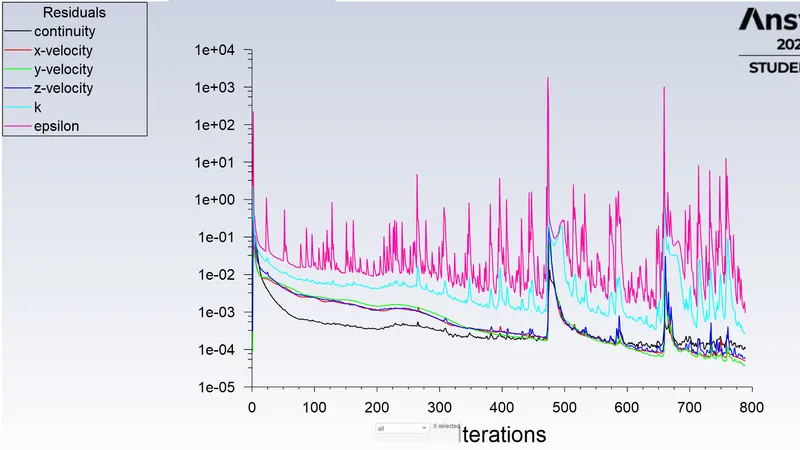
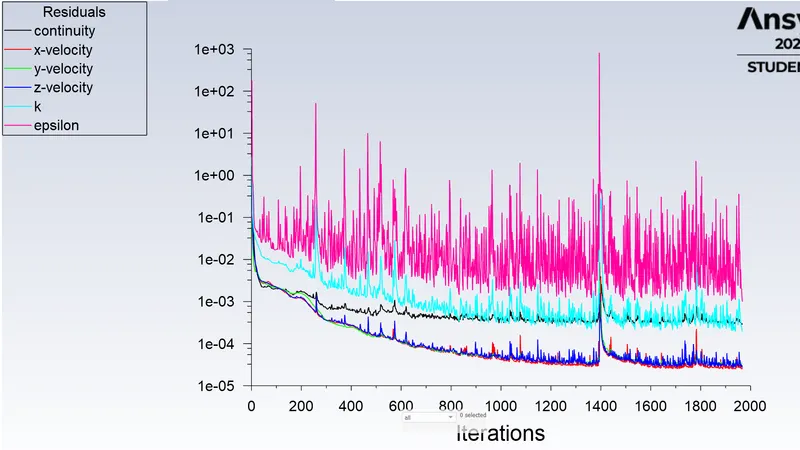
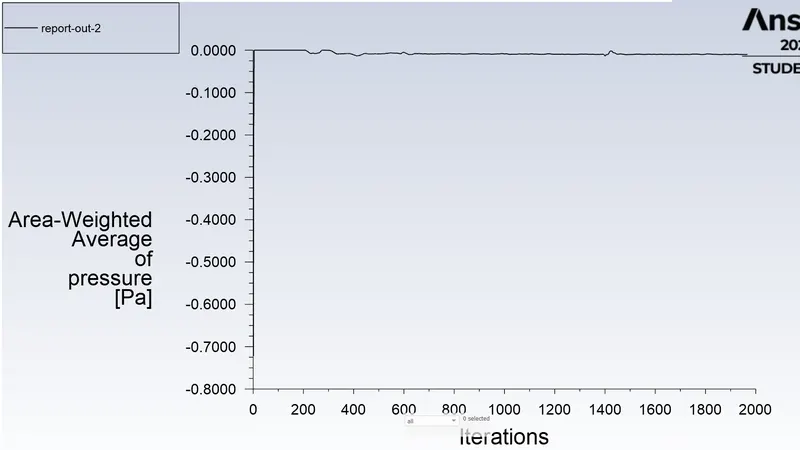
For the analysis the appropriate mesh,contours and the corresponding graphs were plotted as shown above.