Project - Data Handling and Interpolation
1) Answer
MATLABCODE CODE
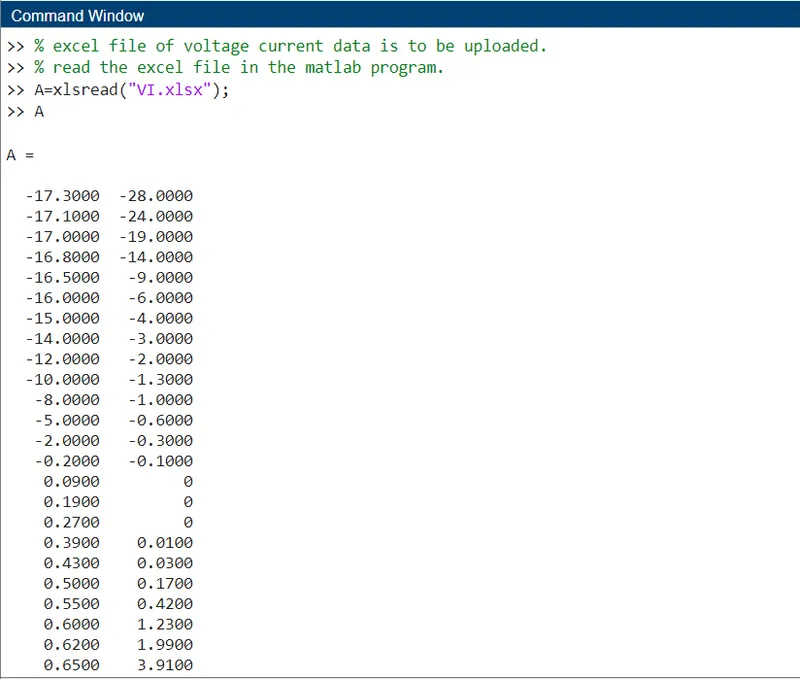
% excel file of voltage current data is to be uploaded.
% read the excel file in the matlab program.
A=xlsread("VI.xlsx");
A
A =
-17.3000 -28.0000
-17.1000 -24.0000
-17.0000 -19.0000
-16.8000 -14.0000
-16.5000 -9.0000
-16.0000 -6.0000
-15.0000 -4.0000
-14.0000 -3.0000
-12.0000 -2.0000
-10.0000 -1.3000
-8.0000 -1.0000
-5.0000 -0.6000
-2.0000 -0.3000
-0.2000 -0.1000
0.0900 0
0.1900 0
0.2700 0
0.3900 0.0100
0.4300 0.0300
0.5000 0.1700
0.5500 0.4200
0.6000 1.2300
0.6200 1.9900
0.6500 3.9100
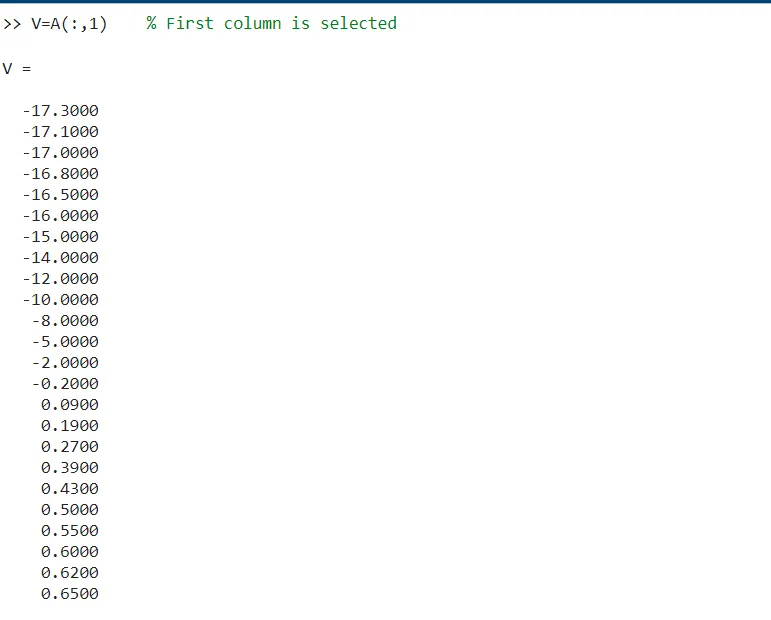
V=A(:,1) % First column is selected
V =
-17.3000
-17.1000
-17.0000
-16.8000
-16.5000
-16.0000
-15.0000
-14.0000
-12.0000
-10.0000
-8.0000
-5.0000
-2.0000
-0.2000
0.0900
0.1900
0.2700
0.3900
0.4300
0.5000
0.5500
0.6000
0.6200
0.6500
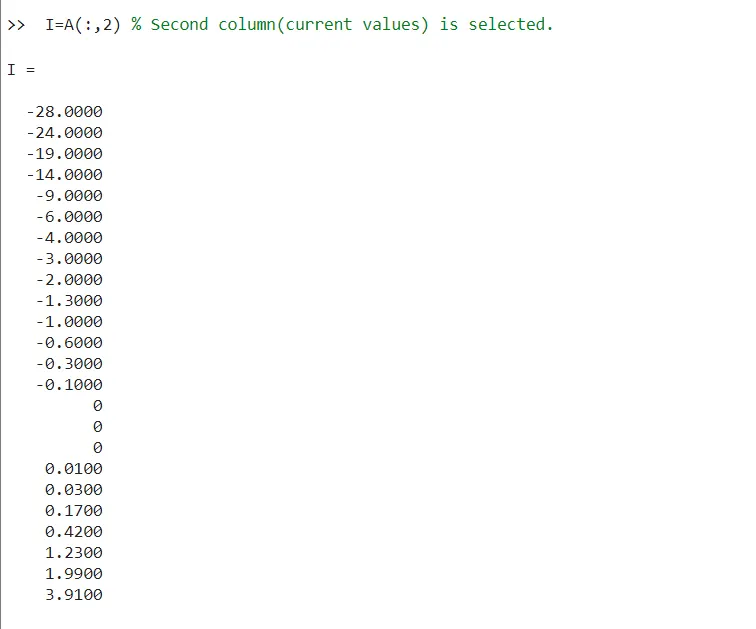
I=A(:,2) % Second column(current values) is selected.
I =
-28.0000
-24.0000
-19.0000
-14.0000
-9.0000
-6.0000
-4.0000
-3.0000
-2.0000
-1.3000
-1.0000
-0.6000
-0.3000
-0.1000
0
0
0
0.0100
0.0300
0.1700
0.4200
1.2300
1.9900
3.9100
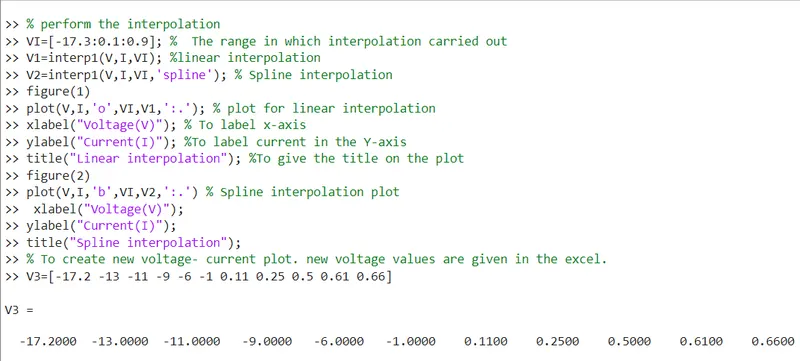
% perform the interpolation
VI=[-17.3:0.1:0.9]; % The range in which interpolation carried out
V1=interp1(V,I,VI); %linear interpolation
V2=interp1(V,I,VI,'spline'); % Spline interpolation
figure(1)
plot(V,I,'o',VI,V1,':.'); % plot for linear interpolation
xlabel("Voltage(V)"); % To label x-axis
ylabel("Current(I)"); %To label current in the Y-axis
title("Linear interpolation"); %To give the title on the plot
figure(2)
plot(V,I,'b',VI,V2,':.') % Spline interpolation plot
xlabel("Voltage(V)");
ylabel("Current(I)");
title("Spline interpolation");
% To create new voltage- current plot. new voltage values are given in the excel.
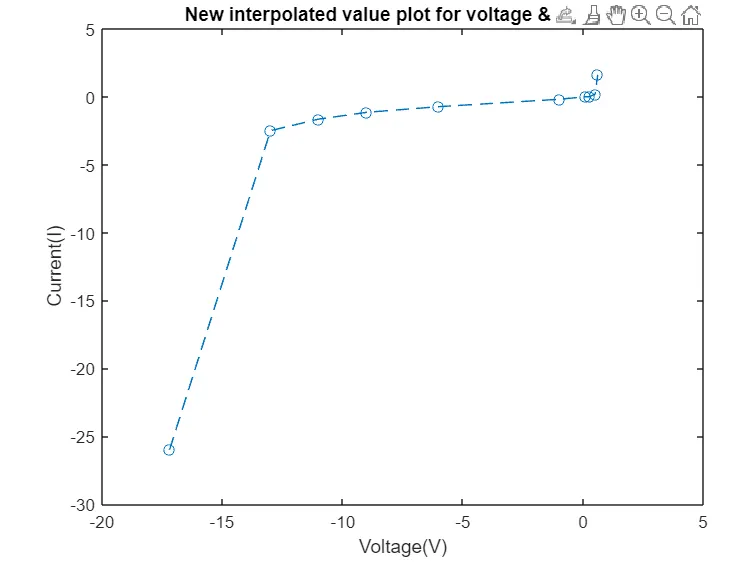
V3=[-17.2 -13 -11 -9 -6 -1 0.11 0.25 0.5 0.61 0.66]
V3 =
-17.2000 -13.0000 -11.0000 -9.0000 -6.0000 -1.0000 0.1100 0.2500 0.5000 0.6100 0.6600
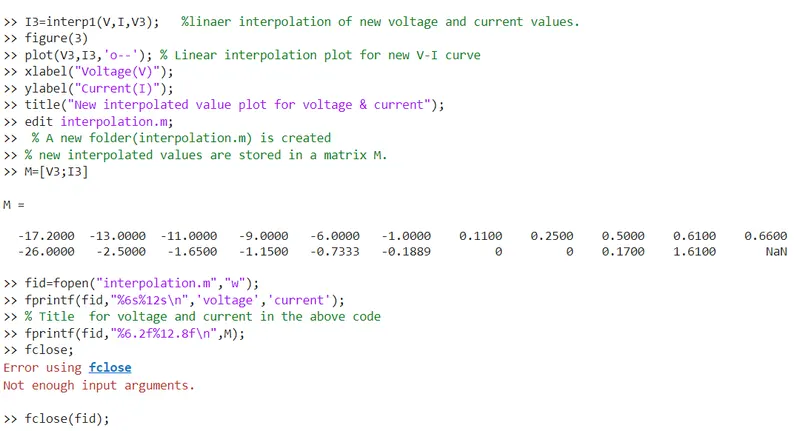
I3=interp1(V,I,V3); %linaer interpolation of new voltage and current values.
figure(3)
plot(V3,I3,'o--'); % Linear interpolation plot for new V-I curve
xlabel("Voltage(V)");
ylabel("Current(I)");
title("New interpolated value plot for voltage & current");
edit interpolation.m;
% A new folder(interpolation.m) is created
% new interpolated values are stored in a matrix M.
M=[V3;I3]
M =
-17.2000 -13.0000 -11.0000 -9.0000 -6.0000 -1.0000 0.1100 0.2500 0.5000 0.6100 0.6600
-26.0000 -2.5000 -1.6500 -1.1500 -0.7333 -0.1889 0 0 0.1700 1.6100 NaN
fid=fopen("interpolation.m","w");
fprintf(fid,"%6s%12s\n",'voltage','current');
% Title for voltage and current in the above code
fprintf(fid,"%6.2f%12.8f\n",M);
fclose(fid);
Screenshots of matlab code
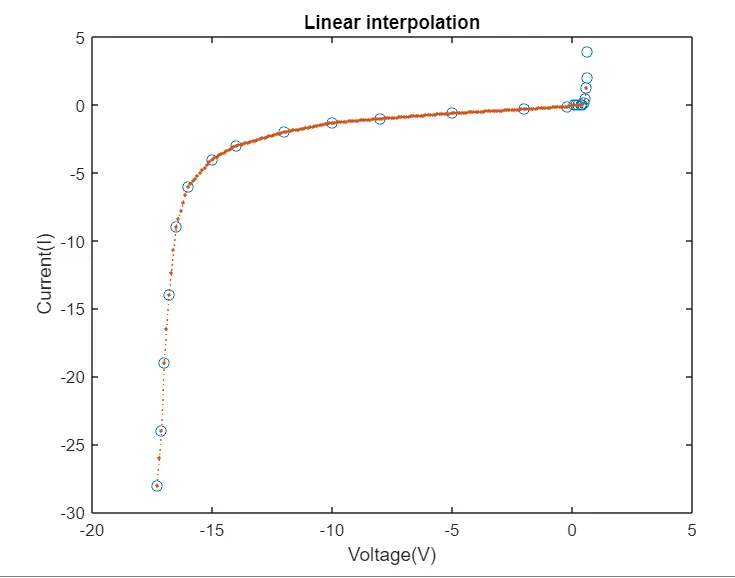
Linear interpolation plot for given voltage-current values
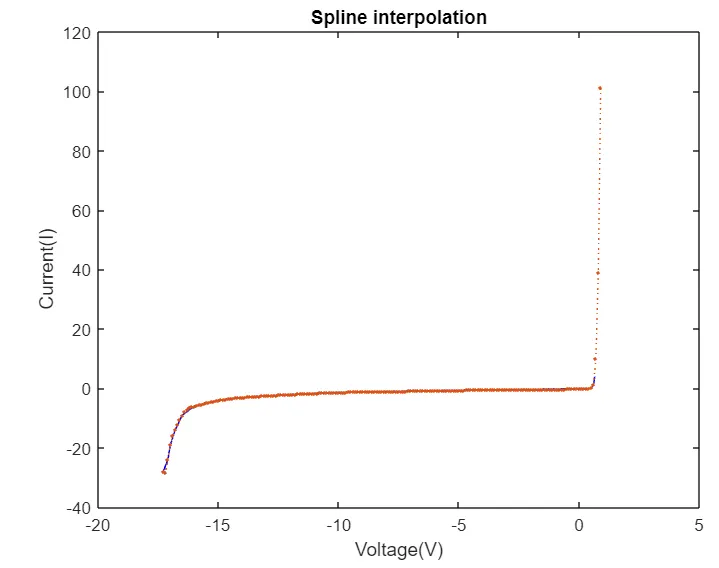
Spline interpolation plot for given voltage-current values
Voltage-current plot for newly interpolated values