Week 7 State of charge estimation
1)
ANSWER1
Simulate the 3 test cases from the harness dashboard and write a detailed report on the results.
The Test Sequence Variant block, which lets you choose which test has to be replicated, can be used to choose one of the three test conditions. The simulation below shows that the first variant was initially chosen.
BATTERY MANAGEMENT SYSTEM (BMS) BLOCK
According to the test version, which is displayed below, the model will be in the driving condition at the beginning of the simulation, then it will enter the balancing mode after 3000 seconds, the charging and balancing mode after 1000 seconds, and the post charge balancing mode after 5000 seconds.
After simulating the model for 20000 seconds as given default.
Here we can see all the lights have turned green as there is no fault or errors in the model.
The figure shows that the car is originally in a driving state and that charging was completed to 90%. The BMS state map shows that it enters the standby mode after the charging mode. It can be seen from the Cell Temperature Plot that when driving and charging, the battery temperature increases. While charging, the battery's voltage rose to 4.2 V. The value currently delivered to the vehicle while it is moving is displayed in the current plot. In driving conditions, the SOC was seen to be reduced by about 50%, however it rose while charging.
Initially it is the driving condition and after 10000 seconds there is charging condition.
The plot shows that the battery entirely drains in 8692 seconds, the car does not move, and the charging state is not reached at 10000 seconds. As a result, the vehicle enters standby mode and the simulation terminates.
Coming to the third condition.
Looking at the condition below for third variant of the simulation. It is just the continuous charging condition from the start till the end of 20000 seconds of simulation.
When examining the plot, it is clear that the battery begins to charge, the SOC begins to rise from the beginning to roughly 2000 seconds, and then steadily maintains 100% from 2000 seconds to 20000 seconds. The peak current plot decreases from 0 to 2000 seconds and remains constant because there is no driving and therefore no use for the charge.
From the three simulation types described above, it was discovered that,
- In the first simulation, all three conditions were included, including driving, charging, and the stable state. As a result, charging and discharging were seen, and as a result of the car being in standby mode, the final result was a continuous 100% SOC.
- In the second simulation, there was only discharging because the charging condition was not reached at 10000 seconds and the SOC plummeted to 0% in the driving state within 8600 seconds.
- In the third scenario, there was only charging for the first 2000 seconds, and the SOC stayed at 100% throughout the following 18000 seconds.
2) ANSWER 2
What is coulomb counting? Refer to the above model and explain how BMS implements coulomb counting for SOC estimation?.
The Coulomb counting method calculates SOC by measuring the battery's discharge current and integrating it over time. The discharging current, I(t), and previously estimated SOC values, SOC, are used to estimate the SOC(t), which is then calculated using the Coulomb counting method (t-1). The following equation is used to determine SOC
SOC(t)=SOC(t-1)+`frac(I(t))(
But there are several factors that affect the accuracy of Coulomb counting method including temperature, battery history, discharge current, and cycle life.
Modified Coulomb Counting Method.
A novel method termed the modified Coulomb counting method is put forth to enhance the Coulomb counting method. The corrected current is used in the modified Coulomb counting technique to increase estimation accuracy.
The function of the discharging current is the rectified current. The corrected current and battery discharge current have a quadratic connection. Utilizing experimental data, the following formula is used to derive corrected current.
Ic(t)=k2I(t)^2+k1I(t)+k0
where k2, k1 and k0 are constant values obtained from the practice experimental data.
In modified Coulomb counting method, SOC is calculated by the following equation
SOC(t)=SOC(t-1)+`frac(I(t))(
According to the experimental findings, the modified Coulomb counting approach is more accurate than the traditional Coulomb counting method .
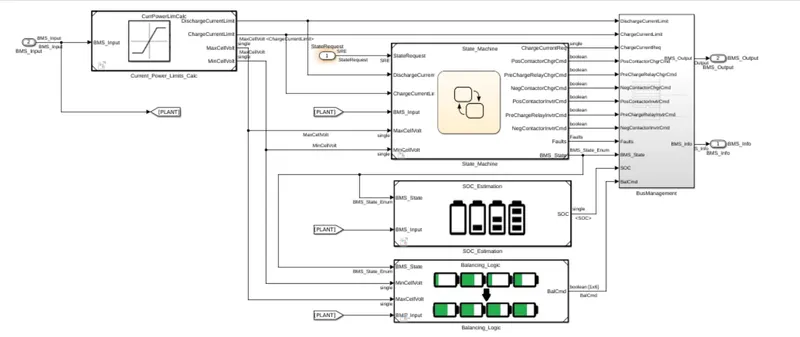
When viewed inside the BMS ECU, the Mathworks model of the BMS Closed Loop is provided as shown below.
The Coulomb counting block can be observed on the top of the model, where the Coulomb counting was carried out. The model for the same can be seen below.
The estimation by coulomb counting equation is implemented by this system. The simplicity and low computational cost of coulomb counting are its key benefits. The battery is used as a source of input for temperature and current. The gain block receives the current signal, while the capacity receives the temperature because it changes with temperature. These inputs are provided for integration, which will integrate the present relative to time. Another block receives this output, divides it by its capacity, and then estimates the SOC.
CLOSEDLOOP BMS SYSTEM
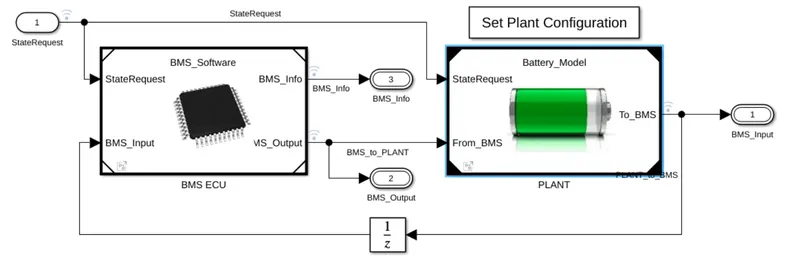
BMS ENGINE CONTROL UNIT BLOCK
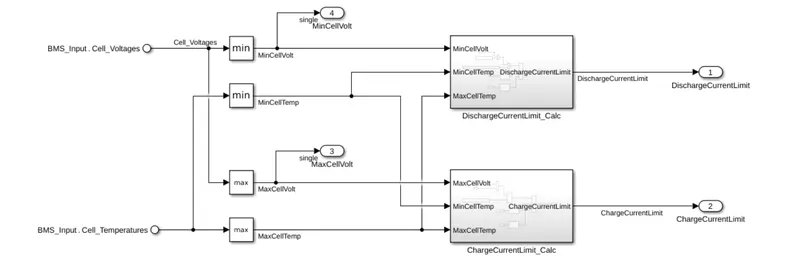
CURRENT POWER LIMIT CALCULATION BLOCK
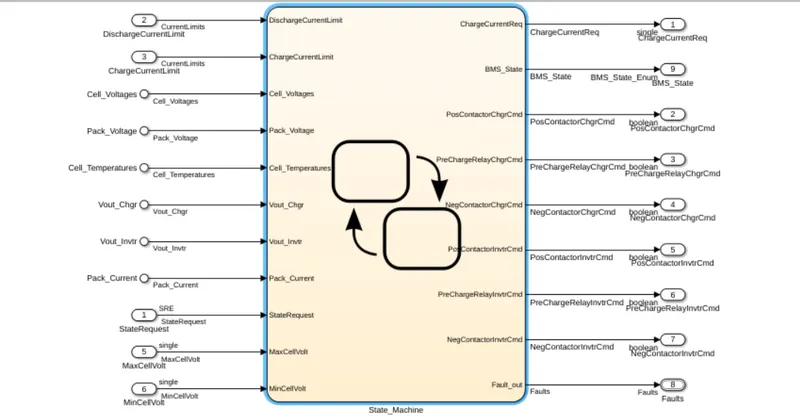
STATE MACHINE BLOCK
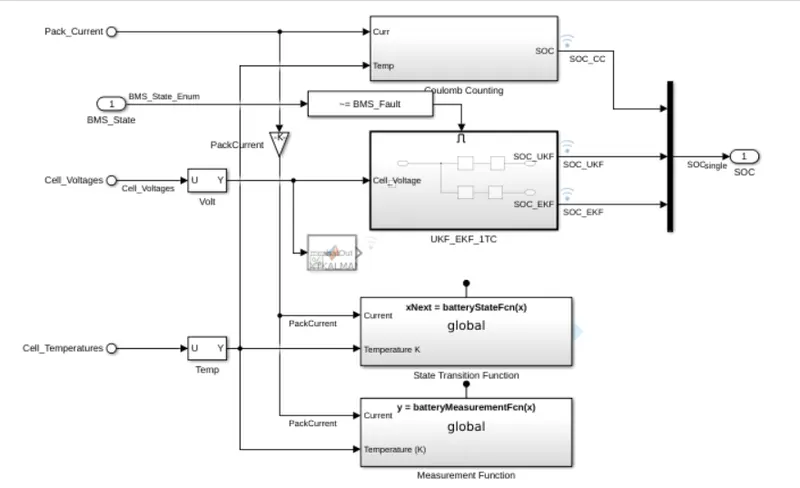
SOC ESTIMATION BLOCK
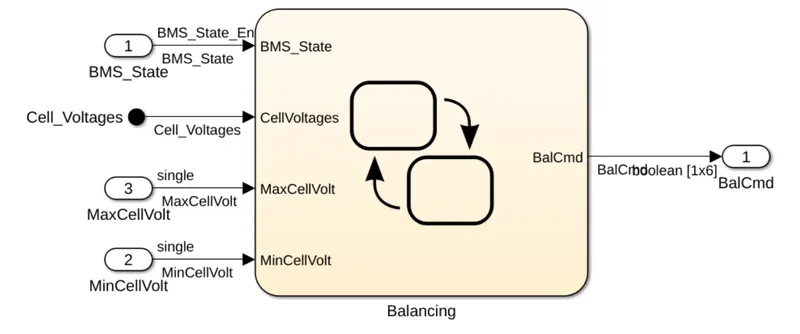
BALANCING LOGIC BLOCK
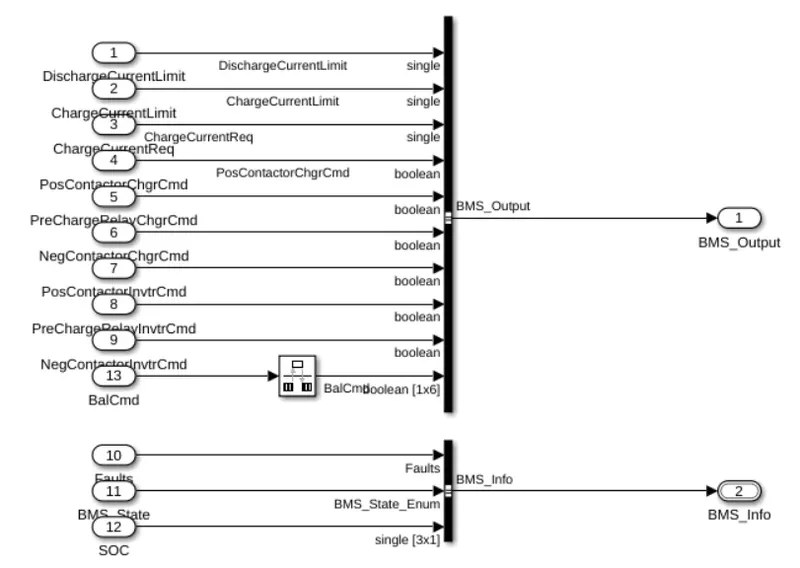
BUS MANAGEMENT BLOCK
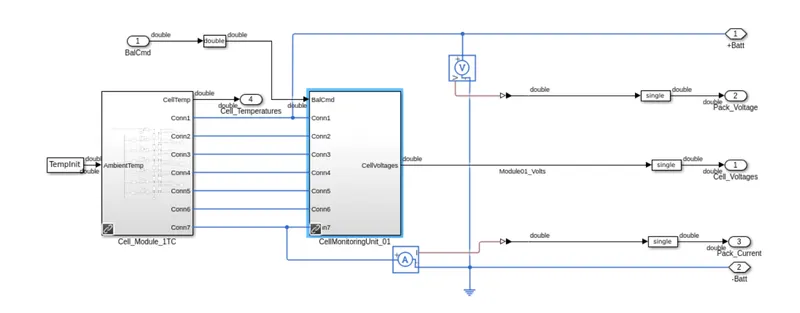
BATTERY PACK MODULE
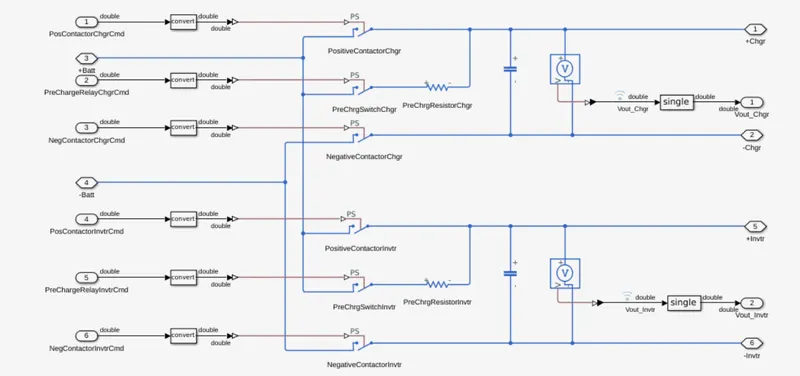
PRECHARGE CIRCUIT DIAGRAM
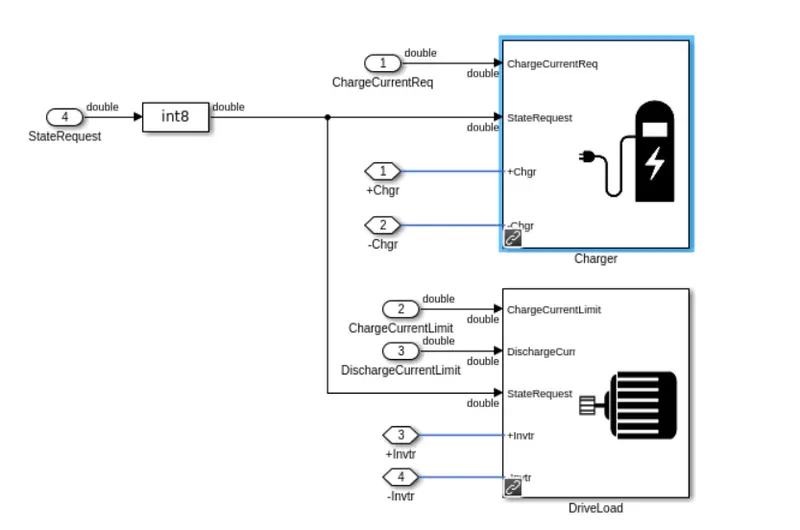
CHARGER-DRIVELOAD BLOCK
CONCLUSION
- Along with the successful simulation and discussion of the three test cases from the harness dashboard, the Coulomb counting carried out by the BMS for SOC estimation.