Week 7 State of charge estimation
1.Simulate the 3 test cases from harness dashboard and write a detailed report on the results.
The closed loop harness dashboard model in matlab as shown below.
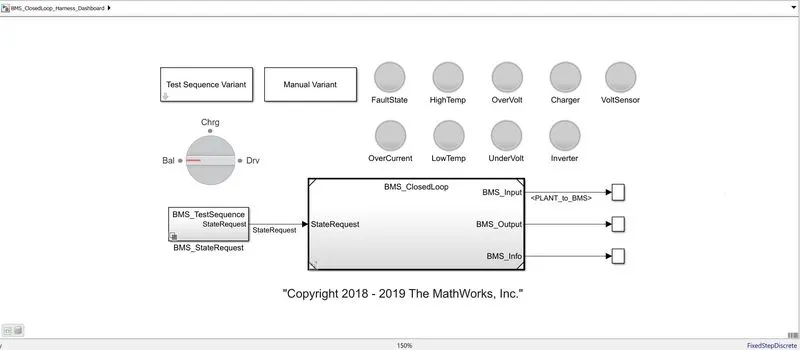
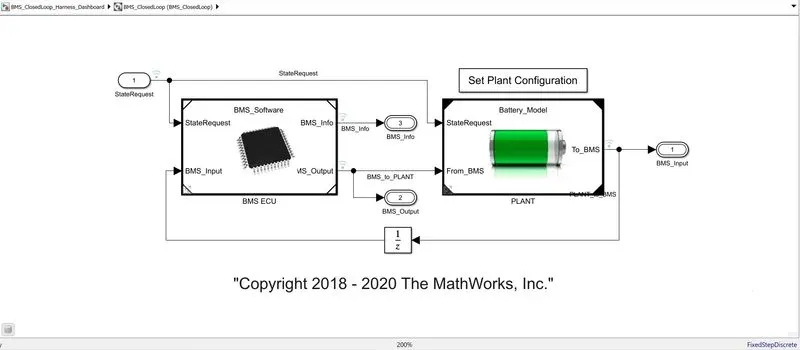
It has a test sequence variant subsystem which defines the cycles of all the modes which are driving, charging and standby (for balancing) on the basis of the test sequence number selected of the 3 test cases available. The indicators present show green when there is no fault and the battery runs perfectly. If there is a fault in the battery pack then the red light is seen at the indicator showing what the fault is. The closed loop BMS block contains both the battery model and the BMS ECU. The BMS closed loop model when opened is as shown.
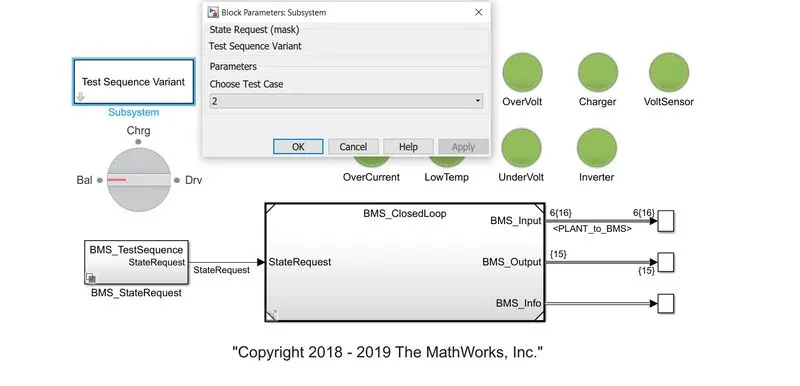
The test sequence variant subsystem allows us to select the test case and is as shown below.
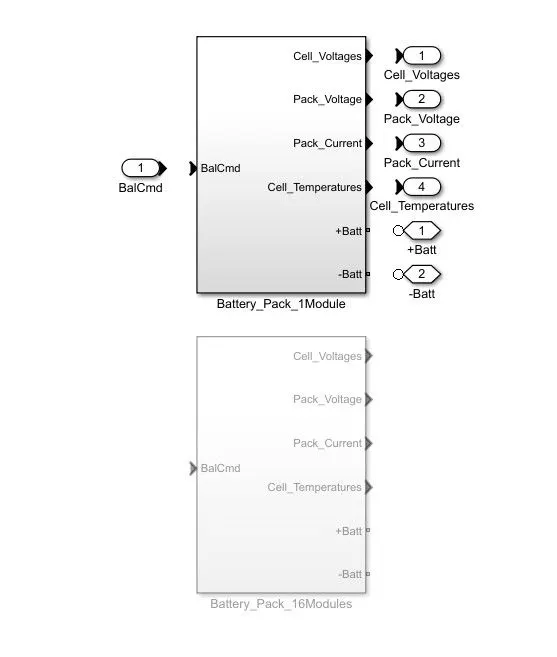
There are 2 plant model configurations available which are 1 pack 1RC having 6 cells and another 16 pack 1RC which has 16 such modules of 6 cells i.e., 96 cells. The below subsystem shows which battery pack is connected and this selection can be done from the plant configuration block as seen above the battery model plant block.
Firstly keeping the 6 cells single module battery pack connected we run the simulation with the test sequence 1 selected and the results are observed.
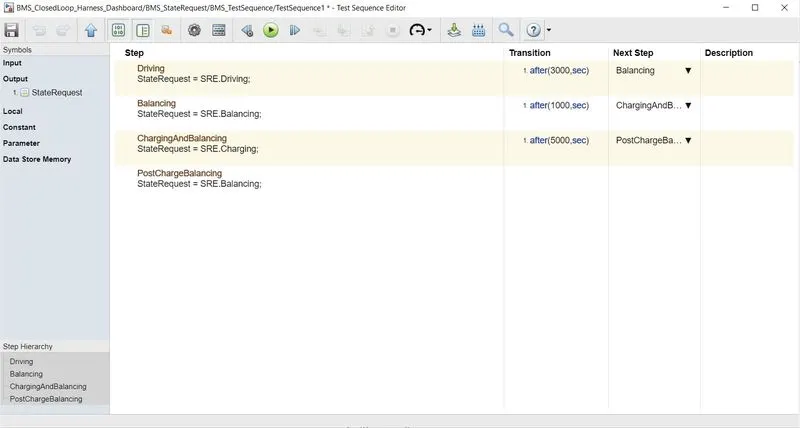
The 1st case editor shows that the first 3000 seconds the driving cycle will be activated and then after 3000 seconds balancing mode will be activated for 1000 seconds in which the bms will go into standby mode and after this the charging cycle will be started which will last for another 5000seconds and will charge the battery pack till it is full and then again go in standby mode for the post charge balancing.
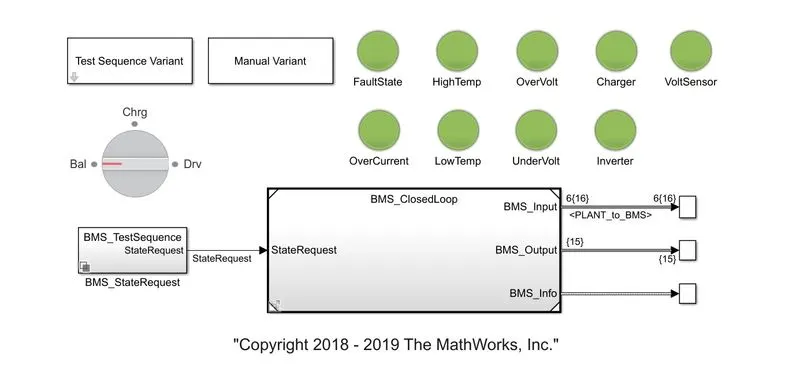
The above results show that there is no fault and the simulation is run for the given conditions. The scope results with the cell voltages, pack current, Cell temperatures, BMS state, State of charge and the balancing command is achieved as shown below.
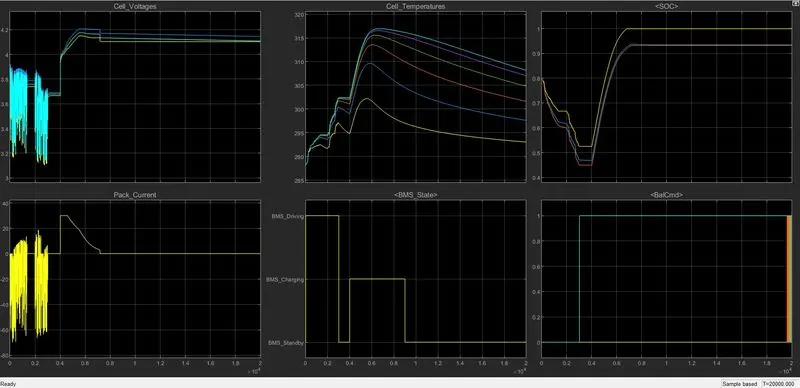
As we can see that for first 3000 seconds the driving mode is enabled and the cell voltages and pack current changes can be seen. After this the standby mode is activated where we see the voltage remains constant and the pack current stays 0 and hence the cell temperatures also come down. Then again when the charging cycle is enabled we can see the temperature and SOC rising along with the cell voltages. The current changes in this time by charging the pack at constant current first and then going on with constant voltage. After this cycle is completed the balancing continues and hence the pack goes in standby mode again.
Now simulating the same for the second test case we gain the following results. Also the test editor is shown with the cycle details of the test case.
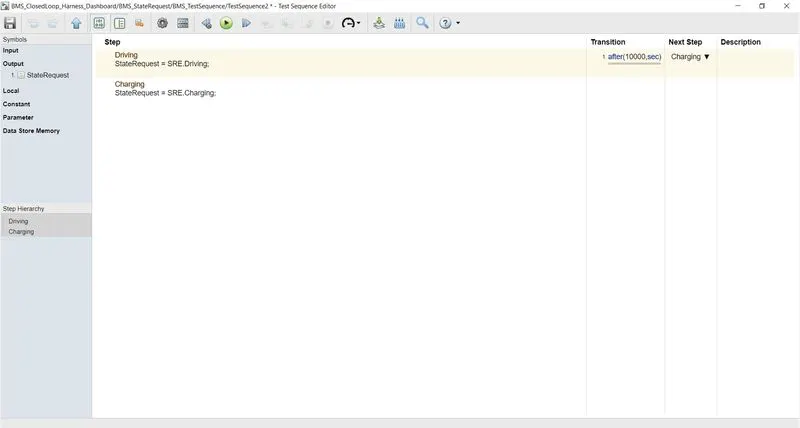
In this case as we can see the driving cycle is enabled and this prolongs for 10000 seconds.
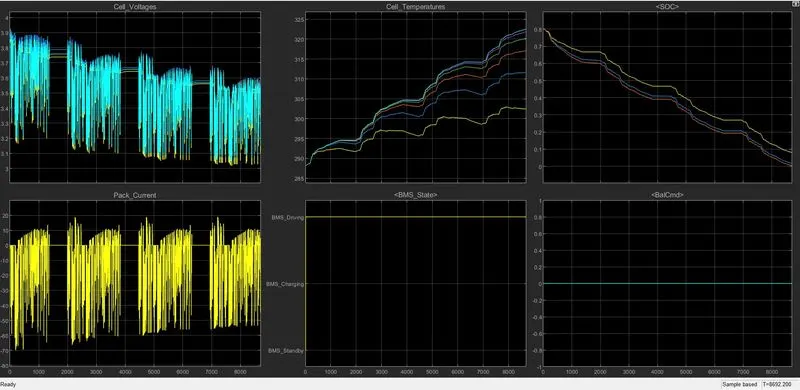
Here we observe that the simulation is run only for 8692 seconds after which the simulation stops. The reason for this can be as seen that the SOC reaches 0 after this time and there is no charge left to further drive this vehicle. The cell voltages and current demands can be seen and the BMS state remaining at driving mode while the temperature keeps rising for the complete cycle.
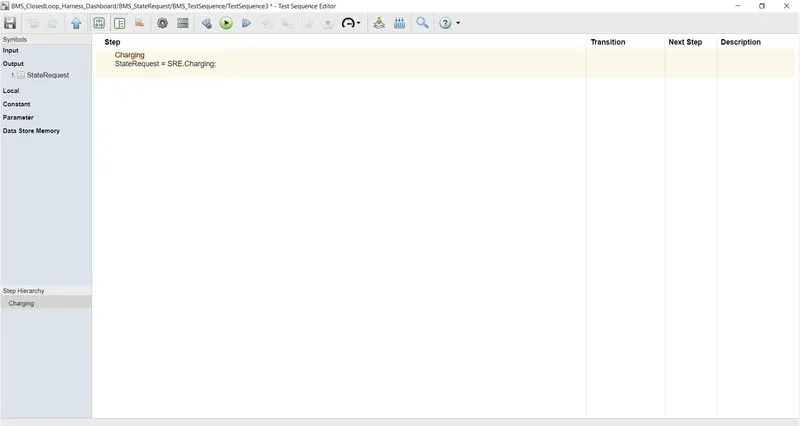
Here we can see the 3rd case shows only charging case and there is no transition given.
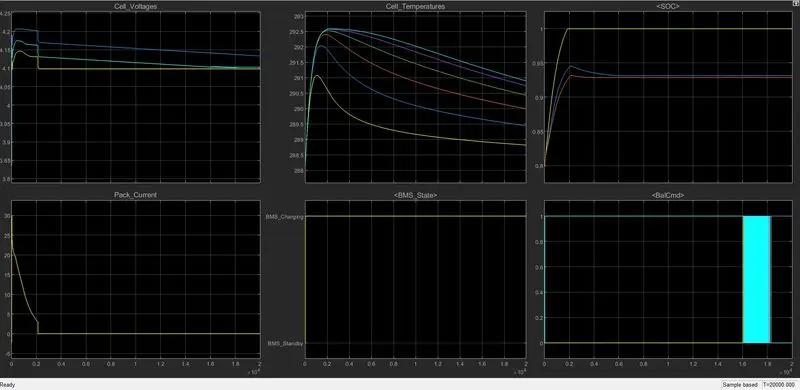
The charging state can be seen activated in BMS state and the charging continues for around 2000seconds where the SOC becomes 1 and till this point the temperature keeps increasing and then starts falling as the charging stops. The current characteristics can be seen as of CCCV charging. The cell voltages increase when charging and when disconnected from charger reduce again by some extent and then remain almost constant. After this the SOC remains constant at 100% till the end of time.
2.What is coulomb counting? Refer to the above model and explain how BMS implements coulomb counting for SOC estimation ?
The Coulomb counting method measures the discharging current of a battery and integrates the discharging current over time in order to estimate SOC. Coulomb counting method is done to estimate the SOC(t), which is estimated from the discharging current,I(t), and previously estimated SOC values,SOC(t-1) . SOC is calculated by the following equation:
`SOC(t) = SOC(t-1) + [I(t)]/Q_n*Deltat`
But there are several factors that affect the accuracy of Coulomb counting method including temperature, battery history, discharge current, and cycle life.
In the above project upon opening the BMS ECU block we see the following subsystems.
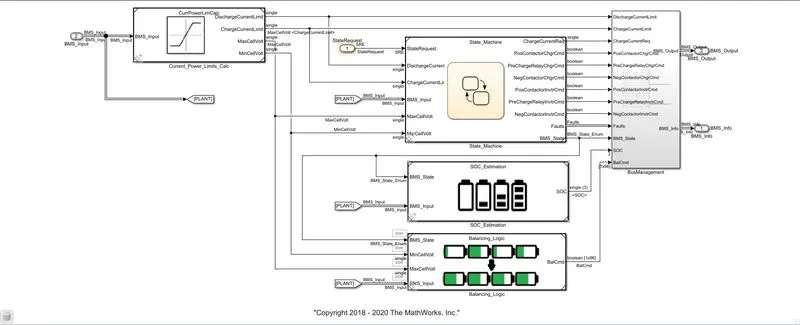
Here we can see the block "SOC_estimation". Double click to open this subsystem.
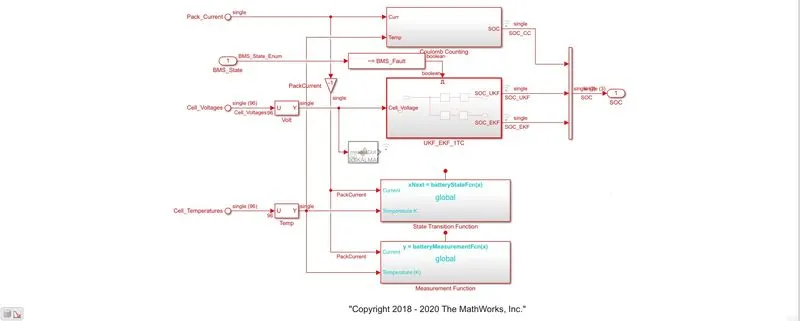
Upon opening the SOC estimation block we see different blocks like Coulomb counting and kalman filters for charge estimation. Opening the coulomb counting block we have the following arrangement.
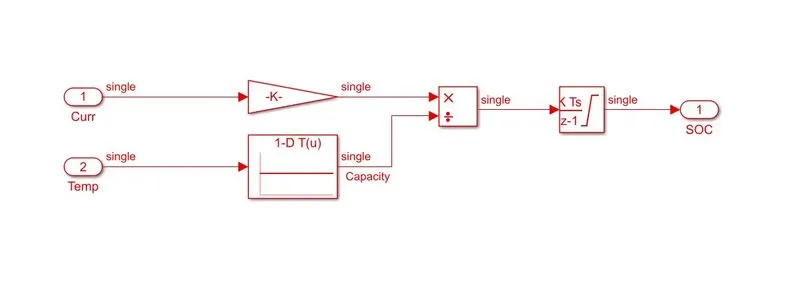
Here as we see current is given as input which is divided by 3600 through the gain block to convert it into hours. A lookup table is used to estimate the capacity at different temperatures and this new current value is integrated over time to find the discharge current or charging current going through the battery pack and hence give a estimation of the SOC value of the battery pack.