Week-3 Challenge: ADVISOR Tool
1. Firstly the EV_defaults_in vehicle model was opened and the cargo mass was changed to 500kg. The setup of the car is as shown.
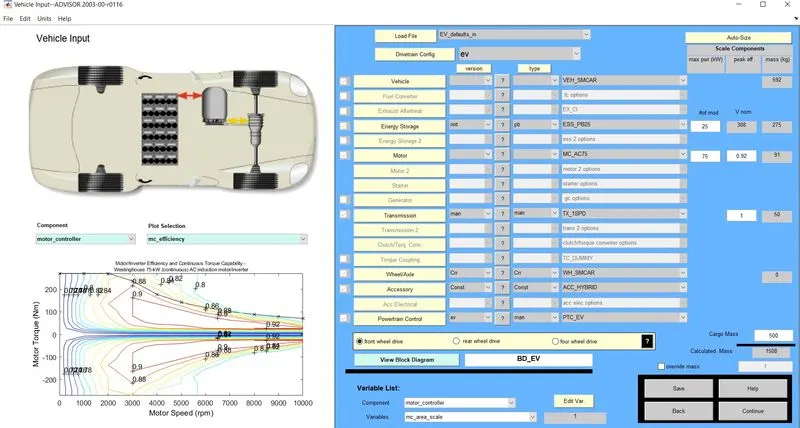
Next the drive cycle FTP was chosen for simulation and the cycle is repeated 3 times to get the SOC of the car at the end of third cycle where it should have covered about 53.4 km as it travels 17.8 km per drive cycle of FTP.
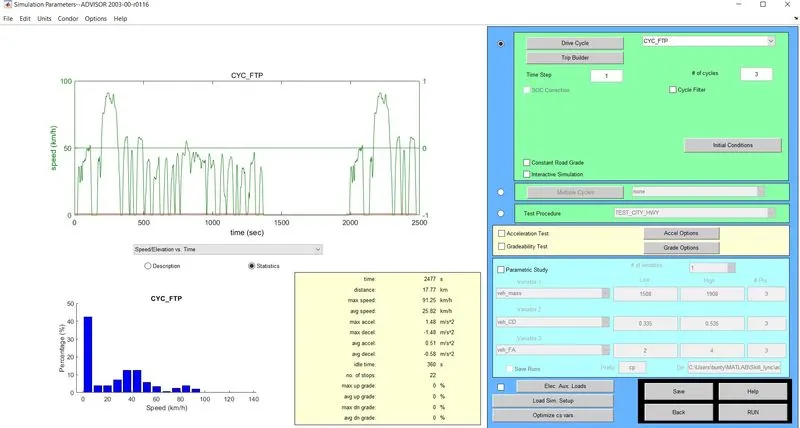
The FTP drive cycle is shown in the graph above and as we see it is to be repeated 3 number of times for the simulation.
The results obtained are as follows.
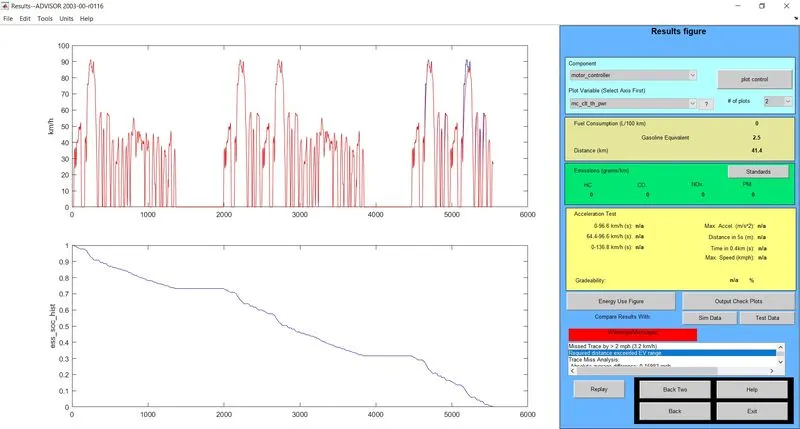
As we can see the state of charge (SOC) has fallen to 0 before the end of third drive cycle and the distance covered is only 41.4 km. We can see the warning at the bottom right saying that required distance exceeded the EV range and hence the simulation was cut at the point where the SOC falls to 0. So the range of the EV setup used is 41.4 km and hence the vehicle cannot travel 45km with the FTP cycle.
2.Now we change the energy storage capacity of the battery by increasing the number of cells from 25 to 28 to increase the voltage from 308 to 345 V.
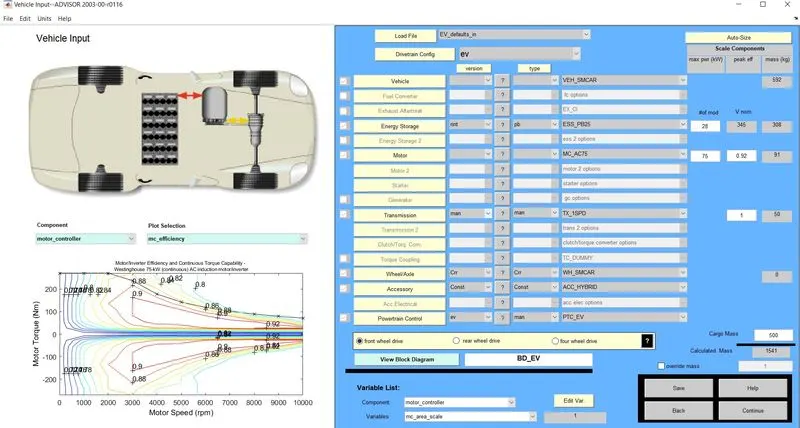
Now keeping all the other factors same and running the simulation for the same number of FTP drive cycle we obtain the results as follows.
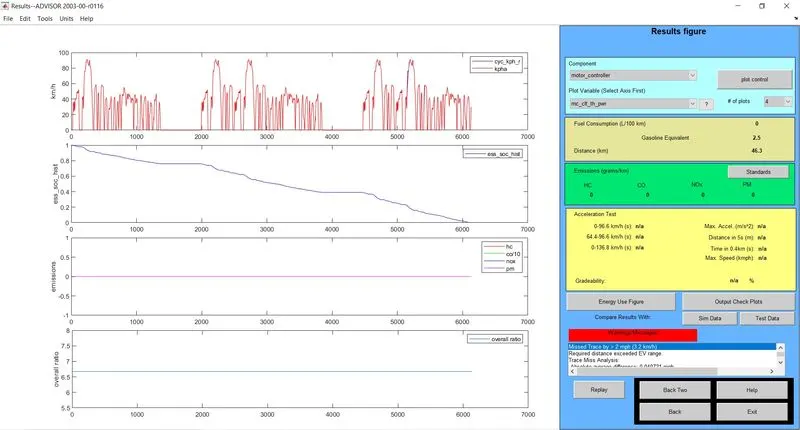
It can be seen that now the range of the EV has increased to travel a total of 46.3 km before the SOC falls to 0%. This way the battery requirement can be simulated again and again for different number of cells to get a balance between the total weight and costing not being much high with an acceptable range from the EV.
3. The PRIUS_jpn_defaults_in model is opened and all the settings are kept unchanged. In the next screen where the drive cycle is to be selected there is an option grade test which is turned on and the settings of the grade test are done by clicking on the grade options button. This opens a new window where the speed in mph at which the gradeability is to be calculated is changed and simulation is done at different speeds.
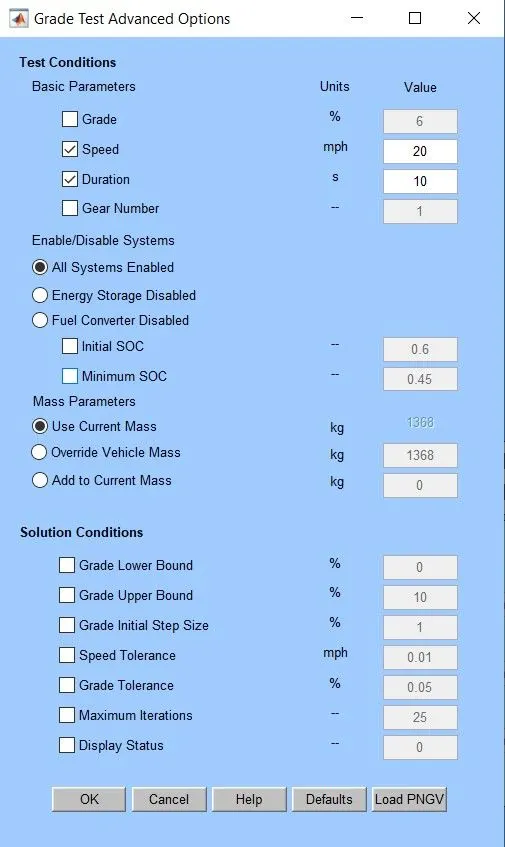
These changes will result in gradeability in % in the results window as shown below.
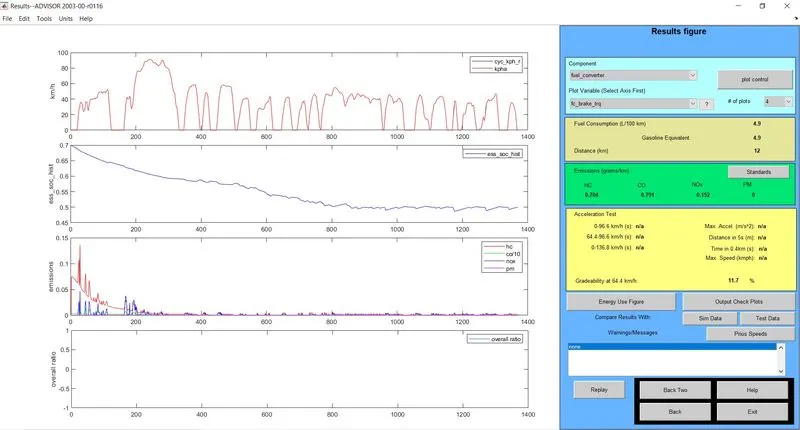
All the values obtained are put in a table and the results are as follows.
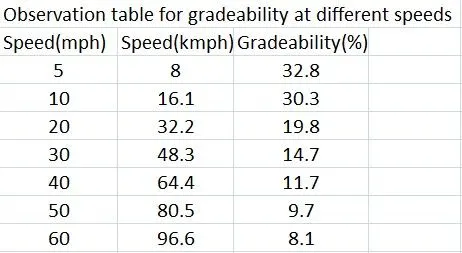
Conclusion: The results are as expected that at lower speeds the grade that can be climbed is higher and it decreases as the speed increases.