Week-11 Challenge: Braking
1. For a defined driving cycle, calculate the energy required for braking.
- Firstly the UDDS cycle is taken as drive cycle and data for the same is downloaded in excel sheet format.
- A matlab code is written to process the excel sheet and do the required calculations of deceleration and braking energy and plot graphs for the same.
- The matlab code written is as follows:
close all
clear all
clc

%Input values
mass = 1500;
g = 9.81;
time_period = 1370;

%Inputting the excel sheet
num = xlsread('UDDS.xlsx');

%creating matrices for time, velocity, deceleration and braking energy
time = num(1:time_period,1);
velocity = num(1:time_period,3);
decrease_in_velocity = zeros(1,time_period);
change_in_time = zeros(1,time_period);
deceleration = zeros(1,time_period);
instantaneous_braking_energy = zeros(1,time_period);

%checking for deceleration and calculating total braking energy required
%for entire deceleration time
for i=1:(length(velocity)-1)
    if velocity(i)<velocity(i+1)
        decrease_in_velocity(i) = velocity(i+1) - velocity(i);
        change_in_time(i) = time(i+1) - time(i);
        deceleration(i) = decrease_in_velocity(i)/change_in_time(i);
        instantaneous_braking_energy(i) = 0.5*mass*0.001*((velocity(i+1))^2 - (velocity(i))^2)/3600;
    end
end

%Plotting graphs
figure(1)
subplot(2,1,1)
plot(time,velocity)
xlabel('Time(seconds)')
ylabel('Velocity(m/s)')
title('UDDS drive cycle data')

subplot(2,1,2)
plot(time,deceleration)
xlabel('Time(seconds)')
ylabel('Deceleration(m/s^2)')
title('Deceleration values for UDDS drive cycle data')

figure(2)
plot(time,instantaneous_braking_energy,'m')
xlabel('Time(seconds)')
ylabel('Braking Energy(kWh)')
title('Braking energy values for UDDS drive cycle data')

fprintf('The total braking energy required for UDDS drive cycle for a time period of %d seconds is %.3f kWh',time_period-1,sum(instantaneous_braking_energy));
The output graphs obtained by running the above matlab code are as follows:
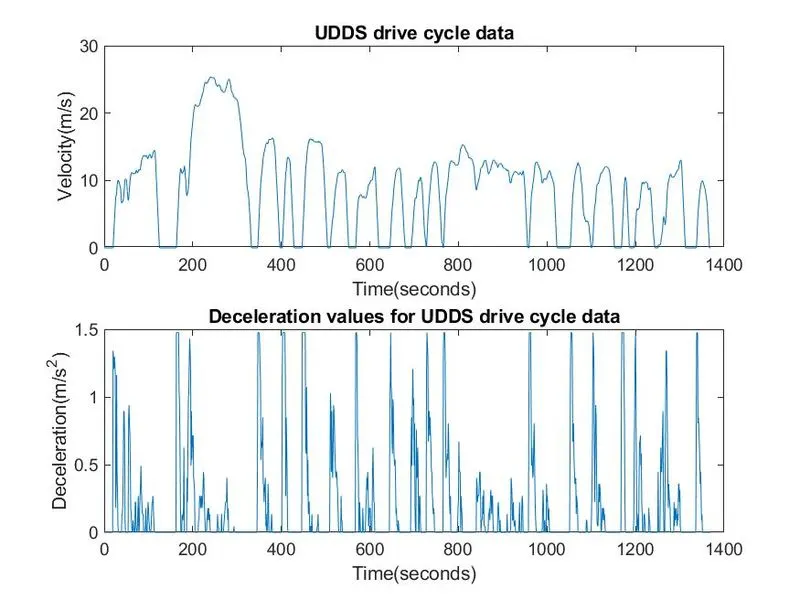
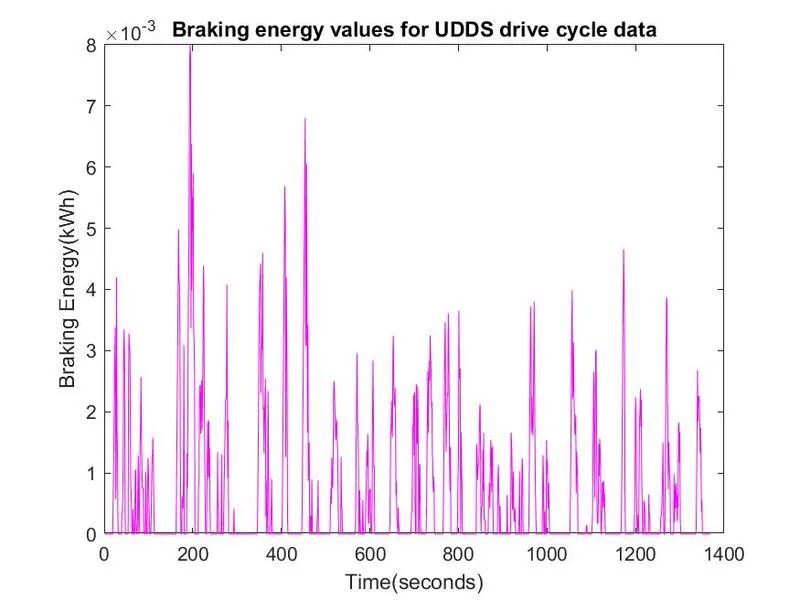

Hence the braking energy calculation for the UDDS cycle was evaluated and plotted.
2. Why electric motor can’t develop braking torque at high speed similar to starting? How electric and mechanical brakes are coordinated?
From the torque speed characteristics of the electric motor in operable range we know that as speed increases the torque available decreases. When starting the speed is at minimum and hence we can achieve higher starting torque. While when braking is done the vehicle or motor is at high speed and hence lower torque is available at higher speeds for braking. Therefore mechanical braking is used along with the electric braking or motor braking to effectively apply brakes for an electric or hybrid vehicle. The mechanical braking and electric brakes can be applied in two methods namely series and parallel type braking control. The amount of regenerative braking power generated during the braking action is restricted by the battery charging capacity and also the SOC of the battery.
1.) Series Braking: In this the regenerative braking and the mechanical braking are applied one after the other.
2.) Parallel Braking: In this, both the regenerative and mechanical braking are applied at the same time.
Usually in electric vehicles at low speeds the regenerative braking is applied while at higher speeds it is assisted by the mechanical frictional brakes.
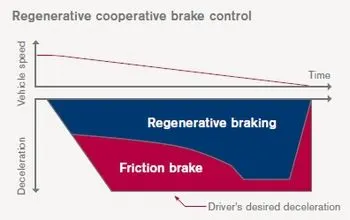
As seen in the graph above, for lower braking demand regenerative braking alone is used but the time for deceleration is higher and when the braking demand increases friction brakes are applied along with the regenerative brakes to compensate for the braking demand.
3. Make a MATLAB program which plots contour of given motor speed, torque and efficiency values. Attach the code as a .m file attach a screenshot of all the plots.
The matlab code for plotting the contour of given motor speed,torque and efficiency values is given below.
clear all
close all
clc

%Creating speed and torque matrices
Speed = linspace(0,1000);
Torque = linspace(0,250);

%Inputs for losses coefficients
Kc = 0.2;
Ki = 0.008;
Kw = 0.00001;
cons = 20;       %Constant losses

%Creating a mesh of speed and torque values and calculating losses at every
%point along with output power available
[X,Y] = meshgrid(Speed,Torque);
output_power = X.*Y;
A = Kc.*(Y.^2);   %Copper losses
B = Ki.*X;        %Iron losses
C = Kw.*(X.^3);   %Windage losses

%Input power calculation and plotting of contour for efficiencies
Input_power = output_power + A + B + C + cons;
n = output_power./Input_power;

%Creating a matrix for efficiencies values for which the contours are to be
%plotted
v = [0.7 0.8 0.85 0.88 0.90 0.92 0.94 0.96 0.98 1];

%Plotting the contour
contour(Speed,Torque,n,v,'ShowText','on');
box on
grid on
colorbar
xlabel('Speed(rad/sec)');
ylabel('Torque(N-m)');
title('Efficiency contour of electric motor');
The plot of the contour obtained from the matlab code is as follows:
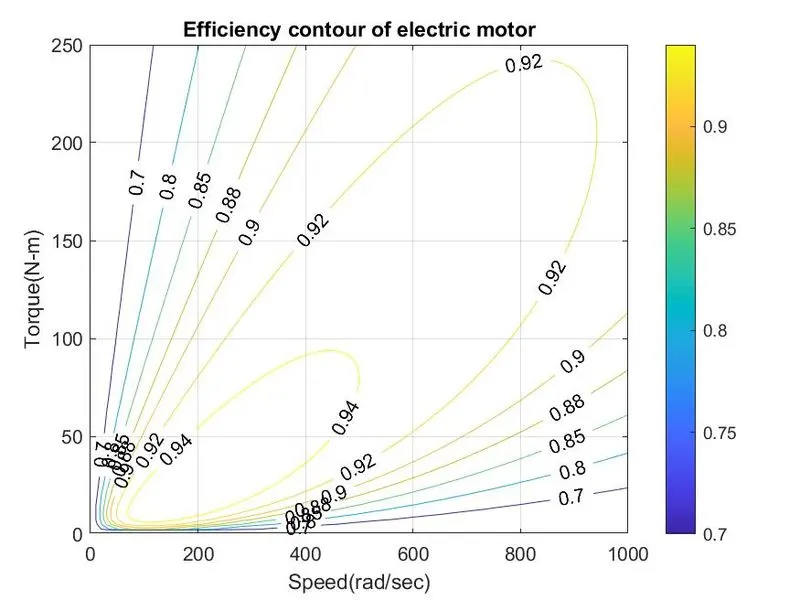
The .m file for the above matlab code is also attached below.