Project 1 - Parsing NASA thermodynamic data
Main Program
clear all
close all
clc

%%opening the file to read the contents

f1 = fopen('THERMO.dat','r');
comments = fgetl(f1);           %%reading the first line
line1 = fgetl(f1);              %%reading the second line
A = strsplit(line1,' ');     %%dividing the line to get temp values as distinct values

global_low_temp = str2num(A{2}); %%Converting the temp values from string to number
global_mid_temp = str2num(A{3}); %%and assigning them to different variables.
global_high_temp = str2num(A{4});

for i = 1:3;                    %%For  reading the next three lines and ignoring them
    comments = fgetl(f1);       %% as comments
end

for j =1:53
%%We can see that the values have a similarity in every 4 lines and hence dividing the %%rest 212 lines by 4 gives the number of times we have to run the same code for the  %%group of lines.

species = fgetl(f1);           %reading the next line and assigning a variable
B = strsplit(species);         %Splitting it to get individual values
Species_name = (B{1});         %assigning the first value which is the species name to
                               %its variable
s2 = strfind(species,'G');
%Here we can see that the values after G are the local temp values and hence finding %those and converting them to numbers.

if length(s2)==1
local_low_temp = str2num(species(s2(1)+4:s2(1)+11));
local_high_temp = str2num(species(s2(1)+13:s2(1)+21));
else
local_low_temp = str2num(species(s2(2)+4:s2(2)+11));
local_high_temp = str2num(species(s2(2)+13:s2(2)+21));
end

%Next we have to read all the values from the next three lines and assign all the %coefficients of the polynomials to specific variables.We do this by finding 'E' in
%the line and according selecting the range of positions we have to take values of.This
%string needs to be changed to number using str2num for using the numerical values of
%coefficients.
line_1 = fgetl(f1);
l1 = strfind(line_1,'E');
a1 = str2num(line_1(1:(l1(1)+3)));
a2 = str2num(line_1((l1(1)+4):(l1(2)+3)));
a3 = str2num(line_1((l1(2)+4):(l1(3)+3)));
a4 = str2num(line_1((l1(3)+4):(l1(4)+3)));
a5 = str2num(line_1((l1(4)+4):(l1(5)+3)));

line_2 = fgetl(f1);
l2 = strfind(line_2,'E');
a6 = str2num(line_2(1:(l2(1)+3)));
a7 = str2num(line_2((l2(1)+4):(l2(2)+3)));
a8 = str2num(line_2((l2(2)+4):(l2(3)+3)));
a9 = str2num(line_2((l2(3)+4):(l2(4)+3)));
a10 = str2num(line_2((l2(4)+4):(l2(5)+3)));

line_3 = fgetl(f1);
l3 = strfind(line_3,'E');
a11 = str2num(line_3(1:(l3(1)+3)));
a12 = str2num(line_3((l3(1)+4):(l3(2)+3)));
a13 = str2num(line_3((l3(2)+4):(l3(3)+3)));
a14 = str2num(line_3((l3(3)+4):(l3(4)+3)));

R = 8.314;                           %%Universal gas constant
temp = linspace(local_low_temp,local_high_temp,100);

%Making a folder for each species name  as it is executed.
mkdir('C:\Users\bunty\MATLAB\Skill_lync\NASA_data',Species_name);
%saving this position to change directory once the jpg's in a specific species is saved
% in its folder and create a new one for the next species.
program = (['C:\Users\bunty\MATLAB\Skill_lync\NASA_data']);

%Calling the funcitons to calculate Specific heat,Enthalpy,Entropy and molecular %weights
Cp = Specific_heat(a1,a2,a3,a4,a5,a8,a9,a10,a11,a12,R,temp,global_mid_temp);
h = Enthalpy(a1,a2,a3,a4,a5,a6,a8,a9,a10,a11,a12,a13,R,temp,global_mid_temp);
s = Entropy(a1,a2,a3,a4,a5,a7,a8,a9,a10,a11,a12,a14,temp,R,global_mid_temp);
M = Molecular_weight(Species_name);

%printing the molecular weights in the command window
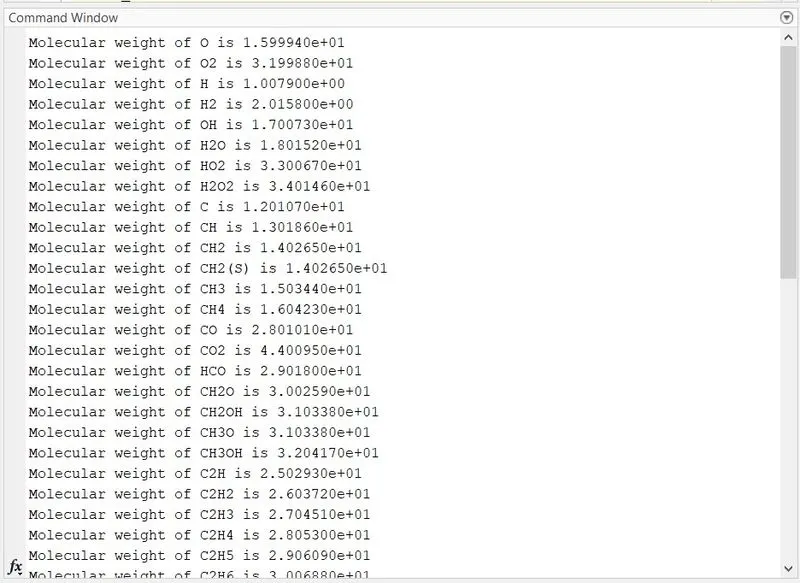
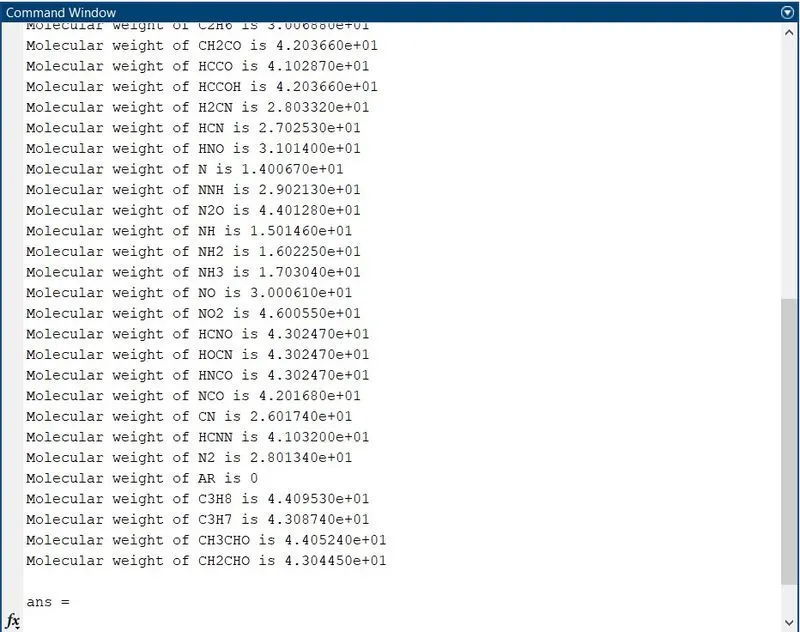
fprintf('Molecular weight of %s is %d\n',Species_name,M);

% Plotting the graph b/n temperature and Cp
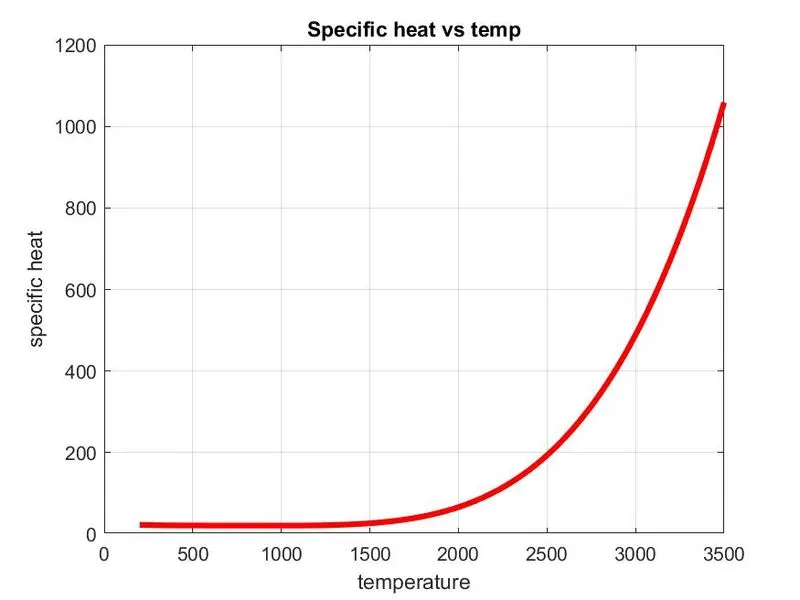
figure(1)
plot(temp,Cp,'linewidth',3,'color','r')
title('Specific heat vs temp')
xlabel('temperature')
ylabel('specific heat')
grid on

% Plotting the graph b/n temperature vs enthalpy
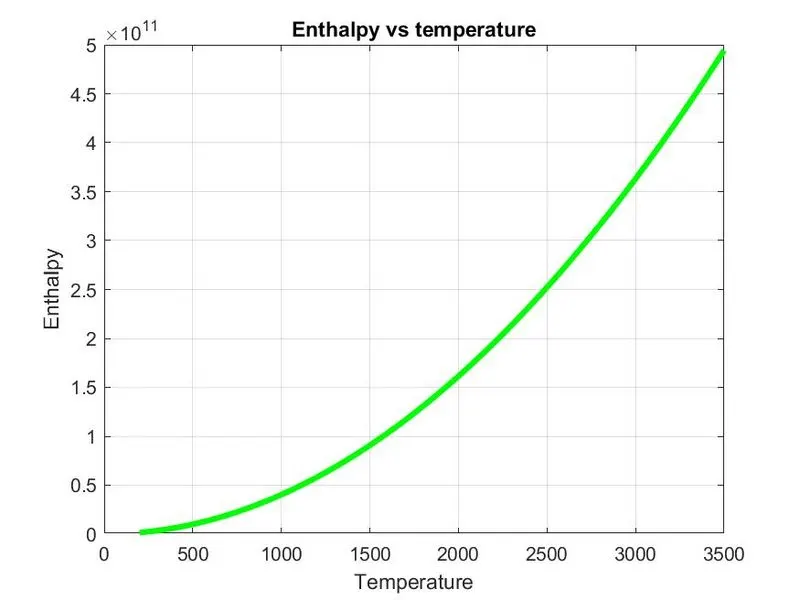
figure(2)
plot(temp,h,'linewidth',3,'color','g');
title('Enthalpy vs temperature')
xlabel('Temperature')
ylabel('Enthalpy')
grid on

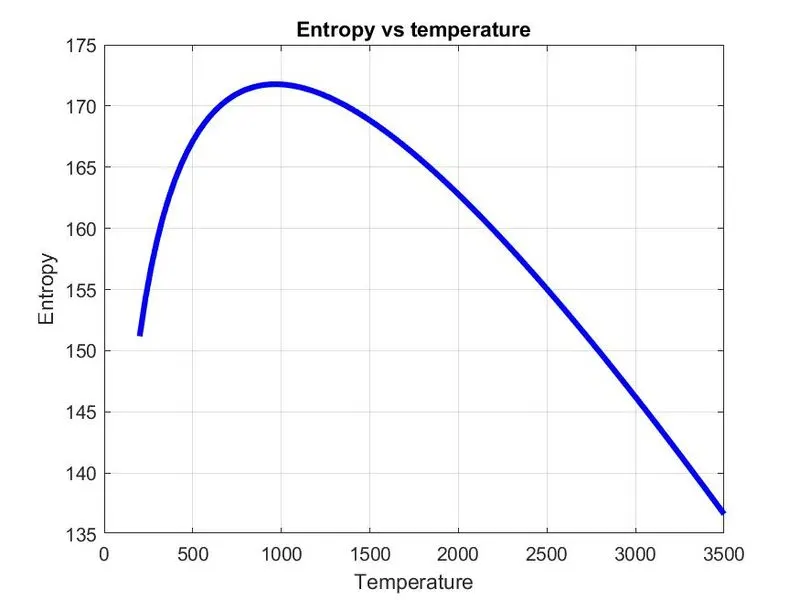
%plotting the graph b/n temp vs entropy:
figure(3)
plot(temp,s,'linewidth',3,'color','b');
title('Entropy vs temperature');
xlabel('Temperature')
ylabel('Entropy')
grid on

%changing directory  to the created folder with species names and saving the jpgs in
%their respective folders.
save = (['C:\Users\bunty\MATLAB\Skill_lync\NASA_data\',Species_name]);
cd(save)

%saving each plotted graph as jpg with names as specified.
saveas(figure(1),'Specific Heat.jpg')
saveas(figure(2),'Enthalpy.jpg')
saveas(figure(3),'Entropy.jpg')

%changing the directory back to main folder which was saved earlier.
cd(program)
end
%Closing the file
fclose(f1)
Outputs:

Functions Used in the main program:
%% function for calculating specific heat

function [Cp] = Specific_heat(a1,a2,a3,a4,a5,a8,a9,a10,a11,a12,R,temp,global_mid_temp)

%As the first 7 coefficients are for high temperature and other 7 for low temperatures.
%Using the formulas for finding Cp in two different temperature ranges using if else.
if temp >=global_mid_temp
    Cp = (a1+(a2*temp)+(a3*(temp).^2)+(a4*(temp).^3)+(a5*(temp).^4))*R;
else
    Cp = (a8+(a9*temp)+(a10*(temp).^2)+(a11*(temp).^3)+(a12*(temp).^4))*R;
end
end
%% function to calculate enthalpy

function[h] = Enthalpy(a1,a2,a3,a4,a5,a6,a8,a9,a10,a11,a12,a13,R,temp,global_mid_temp)

%using the same logic as for specific heat we can use the formulaes to calculate enthalpy
%using if else command.

if temp >= global_mid_temp
    h = R.*temp.*(a1+(a2.*(temp./2))+(a3.*(temp/3))+(a4.*(temp/4))+(a5.*(temp/5))+(a6.*(temp/6)));
else
    h = R.*temp.*(a1+(a9.*(temp./2))+(a10.*(temp/3))+(a11.*(temp/4))+(a12.*(temp/5))+(a13.*(temp/6)));
end
end
%% Function to calculate entropy

function [s] = Entropy(a1,a2,a3,a4,a5,a7,a8,a9,a10,a11,a12,a14,temp,R,global_mid_temp)

if temp >= global_mid_temp
    s = R.*(a1.*log(temp)+(a2.*temp)+(a3.*(((temp)./2)./2))+(a4.*(((temp)./3)./3))+(a5.*(((temp)./4)./4))+a7);
else
    s = R.*(a8.*log(temp)+(a9.*temp)+(a10.*(((temp)./2)./2))+(a11.*(((temp)./3)./3))+(a12.*(((temp)./4)./4))+a14);
end
end
%% Function to calculate molecular weight

function [M] = Molecular_weight(Species_name)

%The elements that are repeated in the data are H,Ar,C,N,O and hence using strcmp to
%find the elements we can calculate the molecular weights of the species by assigning
%values of atomic weight to the element found in the species and adding them.

element = {'H','AR','C','N','O'};
atomic_weight = [1.0079 39.948 12.0107 14.0067 15.9994];

M = 0;
%Searching all the characters in species name and finding matches in element array.

for i = 1:length(Species_name)
    for j = 1:length(element)
        if strcmp(Species_name(i),element(j));
            M = M + atomic_weight(j);

%the position of the
            u=j;

        end
    end

%This is required to multiply the atomic weight by the number of times that the element
%is repeating.
n= str2num(Species_name(i));
if n>1
    M = M+ (atomic_weight(u)*(n-1));
end
end
end