Project - Study of Baja ATV model using simulink and simscape.
The main model is as shown.
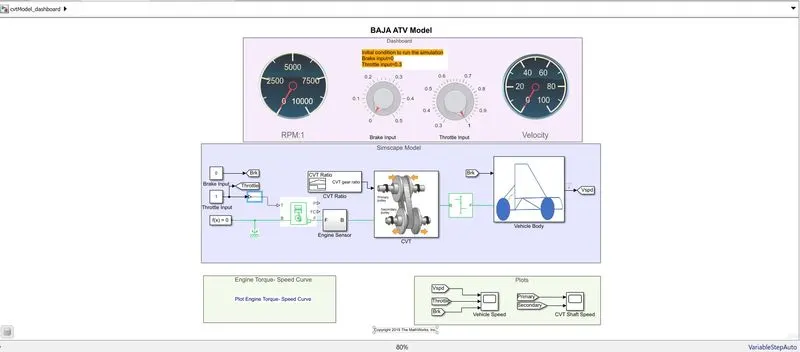
Here we can see use of different model blocks to implement the whole ATV model. There is a CVT model, an engine sensor model, vehicle body model which are embedded in the main model. We will first see how each model is made and then study the model as whole.
Engine Sensor:
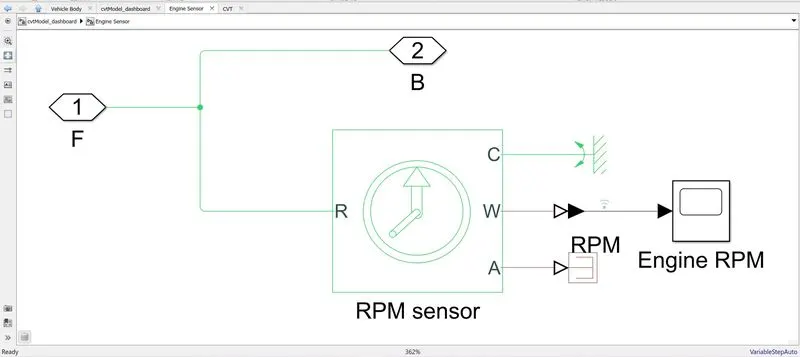
The output from the generic engine which is the rotational velocity of engine crankshaft is fed as input to the sensor block and this is measured using a rotational sensor. The rpm readings obtained are taken up as output to both scope for graph and to the dashboard rpm display.
CVT:
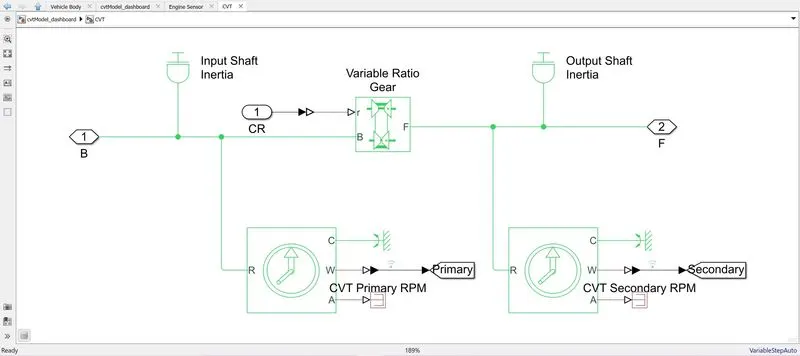
The rpm value from engine sensor is fed into the CVT. The inertia is added to the crankshaft rpm and this is then allowed to pass through a variable ratio gear (as CVT is a variable ratio gear). The output shaft is also induced with inertia and the rpm readings of both crankshaft after inertia and output shaft after inertia are shown as plot using the goto tags. These goto tags are given as inputs to a scope.
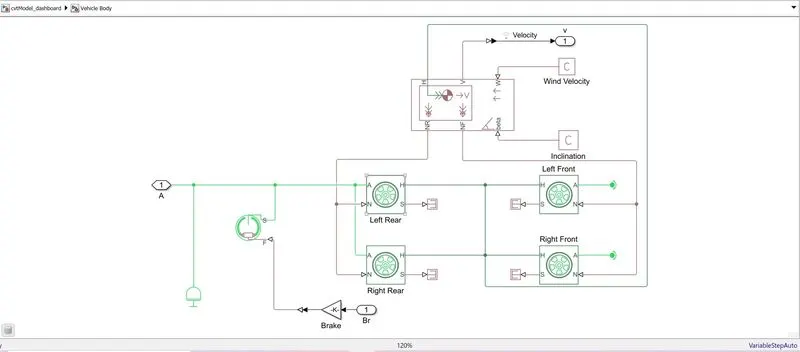
The rpm value of output shaft is made to pass through a simple gear for final gear reduction and given as input to the rear tires(making it a rear wheel drive). The A ports of the rear tires are connected to this mechanical rotation value of rpm. The H port needs to be connected to the translation conserving port and since there is no translatory motion on tires so these ports are connected to each other. The N port takes values of normal force on tires which is calculated by the vehicle body block. The S port is a physical output port and hence is terminated here. The vehicle body block takes mass, angle of steep, wind speed ahead and many other factors and gives vehicle speed as output along with the normal forces that will act on front and rear tires of the vehicle which are used to connect to the N port previously. A double-shoe brake is also introduced at the rpm line to induce decelleration whenever there is depression in brake pedal or braking is applied on the body. The vehicle speed is measured at the vehicle body block to plot graph and also display the velocity at dashboard.
The from tags are used to plot the graphs between vehicle speed, throttle and brake and also between crankshaft speed vs output shaft speed.
The CVT gear ratio is induced by using signal builder.
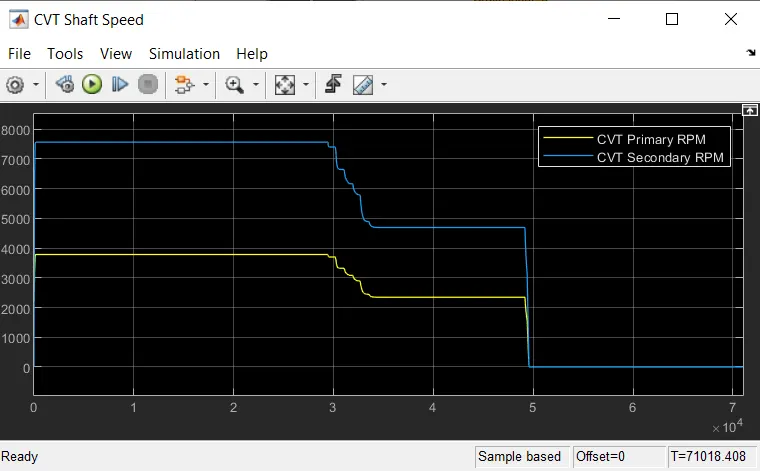
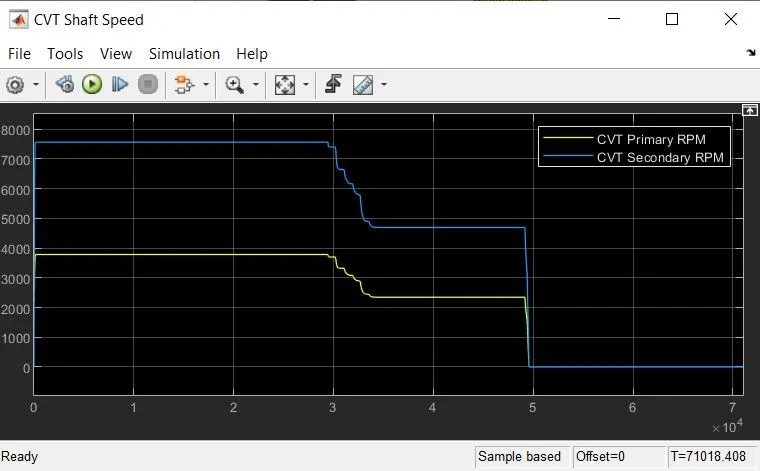
Conclusion: The Baja ATV model is studied and simulation is done using the model and the graphs obtained are shown below.