Week-4 Challenge WOT Condition Part-2
1.
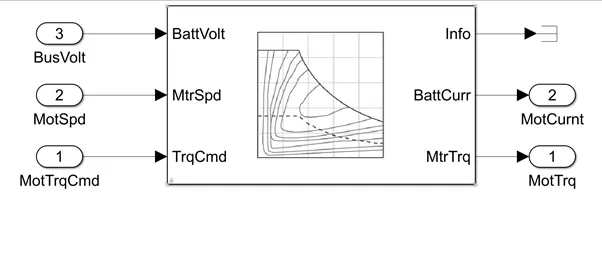
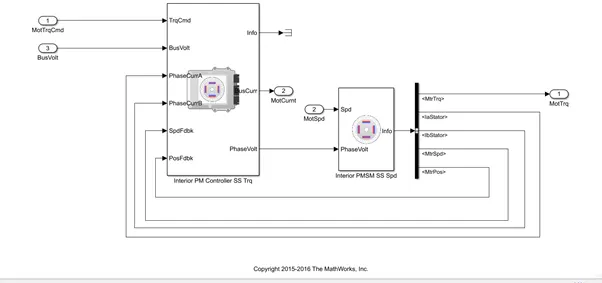
In the mapped Motor the motor is designed by the look up table prepared from the datasheet of the actual motor whereas dynamic motor is designed by the interior permanent magnet motor.
Mapped Motor
- A steady state look up table is used to characterize the performance of the motor
- The table provides the overall engine characteristics such has torque, power, efficiency, fuel, flow rate.
Dynamic model
- The interior permanent magnet motor is used to model this dynamic motor along with a controller
- It demands for current torque and voltage Which is comparable to the actual value of the motor.
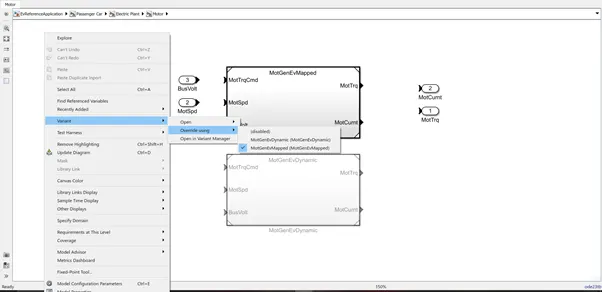
- We can switch between the 2 motor by right clicking at the motor subsystem (Passenger car – Electric Plant – Motor),
- click on variant
- click on override using MotGenEvMapped and MotGenEvDynamic.
2.
The battery power is changed to the US gallon equivalent integrated to get the energy. The vehicle speed is integrated to get the distance. The gain blocks are used to convert both distance and the energy to the proper unit and the energy is divided from the distance to get the miles per gallon.
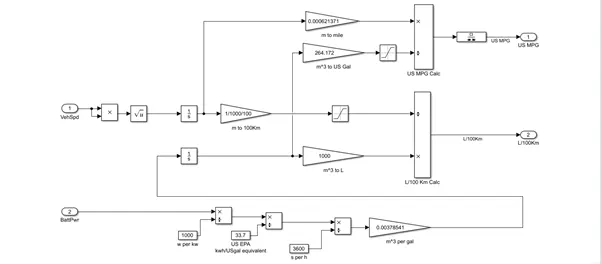
Energy (Since we are concerned with miles per gallon we are neglecting the km per lit part).
- Watt to kilo watt
- kilo Watt to gal/hr
- gal/hr to gal/sec
- gal/sec to m^3/sec
- m^/sec to m^3(by integration)
- m^3 to gal
Vehicle speed
- m/sec to m(by integration)
- Meter to miles
3.
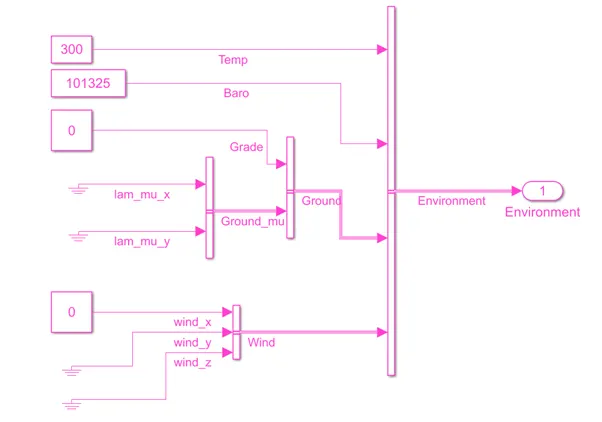
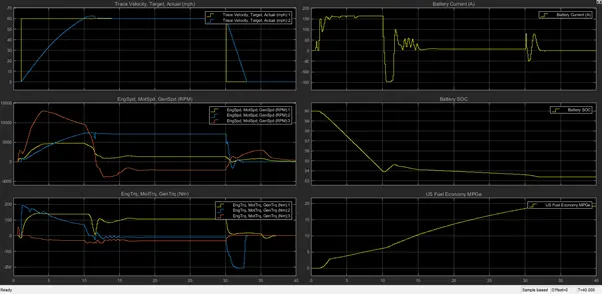
The hybrid electric vehicle is run without changing any Gradeability and wind constant i.e. both having values as 0 with Wide Open Throttle drive cycle.
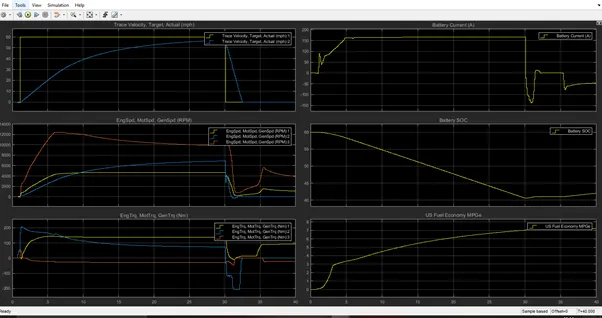
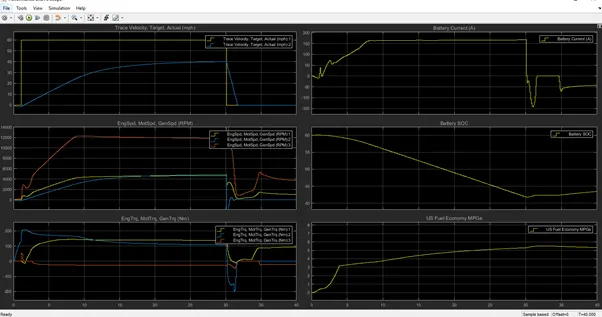
The results are shown below.
Grade=0, Wind velocity =0
Grade =10, Wind velocity =10
Grade =15, Wind Velocity = 20
Discussion:
- When the gradeability and wind velocity are 0 we see the miles/ gallon is around 19 and the State of Charge is around 54.
- When Gradeability is 10 and the wind velocity is 10 mpg is 7 and the SOC is 41.
- When the gradeability is 15 and the wind velocity is 20, mpg is 5.3 and the SOC is 43
As the gradeability and the wind velocity is increasing miles/gallon and the State of charge is decreasing.
4.
We have compared the Hybrid Electric vehicle and the Electric vehicle model and compare the result of the 2 model. Here, we kept the same driving condition and the specification of the vehicle and simulate for the same driving cycle – FTP75.
Hybrid Electric Vehicle
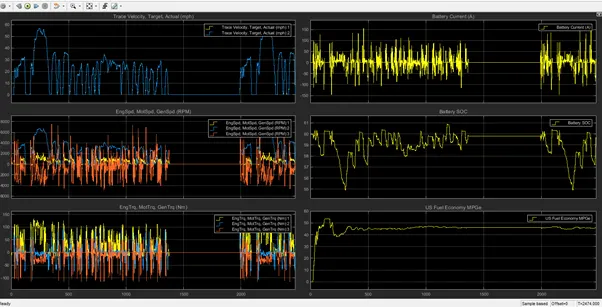
Fuel Economy – 46.0139 mpg
Battery SOC – 59.5972
Electric vehicle
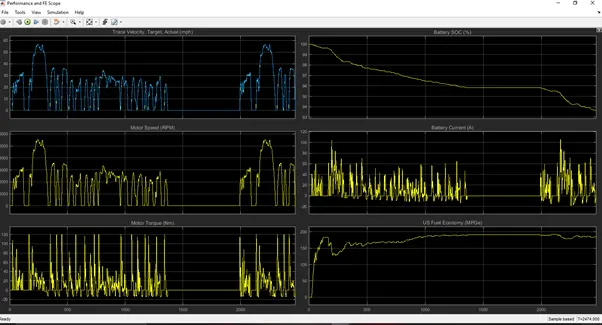
Fuel Economy – 186.3896 mpg
Battery SOC – 93.6750
(The values are taken at the end of the driving cycle)
Discussion
- As for the hybrid electric vehicle the fuel economy is much lower than that of Battery Electric vehicle which shows the EV is more efficient in operation.
- The SOC of the EV is constantly decreasing with slight increase fi=or small time. But for HEV the SOC is increasing decreasing which shows the charging and discharging of the battery with the engine.
- The Battery current is seen to be negative which shows the regenerative braking action.