Week 7 State of charge estimation
1.
Aim: - To simulate the Battery Management System model for all the 3 cases and analyse them.
Study:
Battery Model:
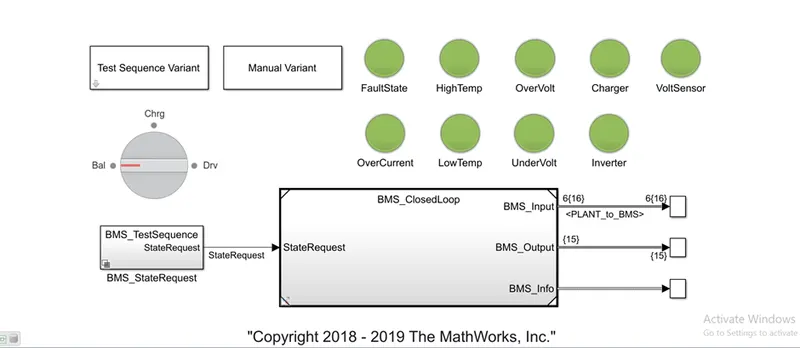
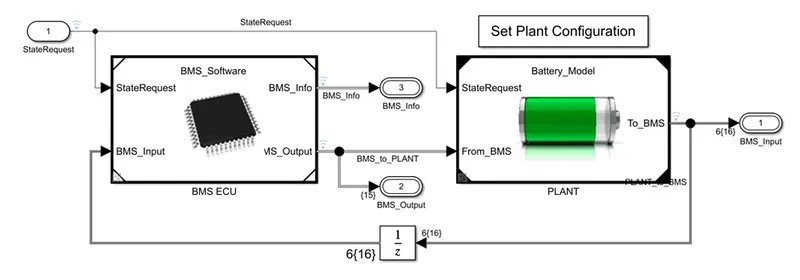
The battery model with the dashboard that indicate any faults in the battery system. The system contains BMS and the combination of cells (Series connections).
TEST CASE: 1
The balance state is where the required power by the battery is supplied from the charger and the battery is neither charging or discharging.
The output of this state is given below:
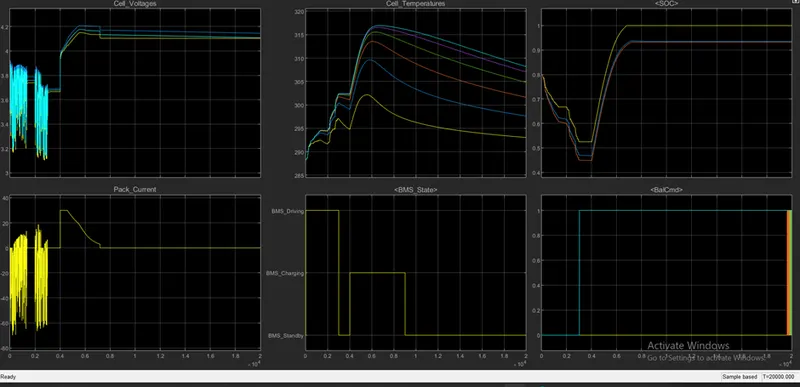
Here we observe the Cell voltages, peak current, the state in which it is working, SOC and the cell temperature.
The vehicle is in the driving mode i.e. discharging mode ill 0.3 sec then it goes for the charging mode till 0.9sec and then goes into the balancing mode.
The vehicle is in the driving mode so the battery is discharging. Then the battery is started charging at sec and the battery gets charged at 0.9sec. After that the battery remains in the balancing mode.
Cell Voltage:
We can see all the cell voltages are almost similar with a very little variation in them.
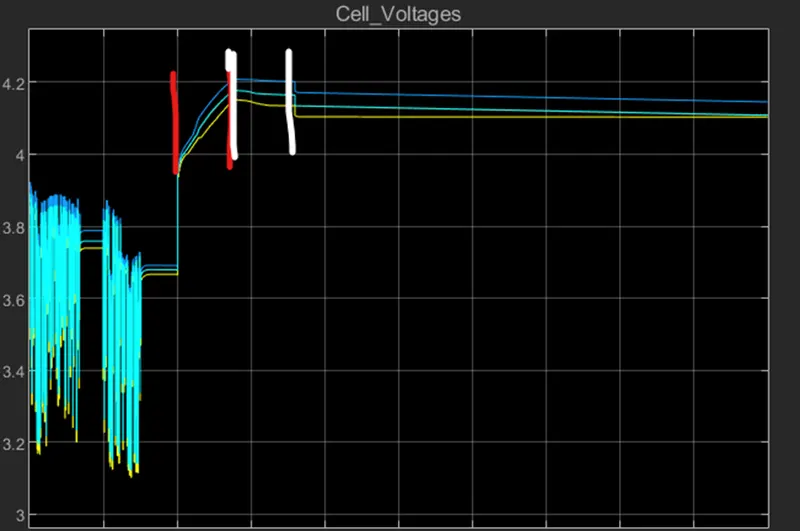
- The red lines show the constant current charging of the batteries and the white lines curve shows the constant voltage charging.
- The constant voltage charging takes more time than the constant current charging.
- The final cell voltage is around 4.2V.
Cell Current:
The cell current is shown below:
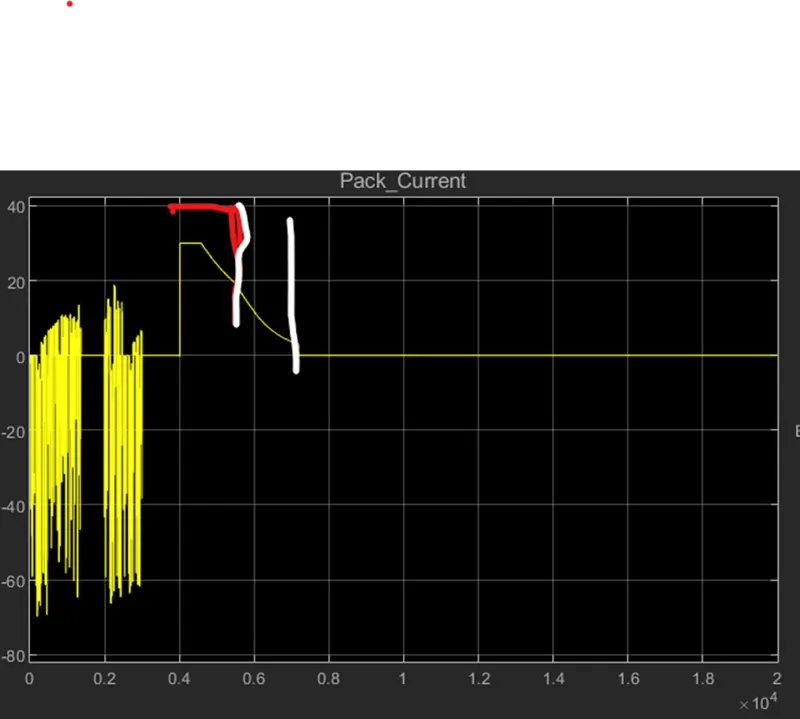
The negative current shows the regenerative braking in the vehicle.
Here also the red line boundary shows the constant current charging and the white line boundary shows the constant voltage charging.
Cell Temperature:
The cell temperature shows different temperature for all 6 cells. This is because of the positioning of the cells the middle cell can have the highest temperature than the cells in the outside. Again, it also depends on the surrounding equipment.
SOC:
The SOC is measured by 3 different techniques:
- Coulomb Counting (yellow)
- Unscented Kalman filter
- Extended Kalman Filter
The SOC estimation with the help of Kalman filter are more accurate than the coulomb counting method.
At the starting the SOC is 80% and it is reduced as the battery is in discharging state. Then the SOC is increases with the charging of the battery. And it gets settled there as the battery is in balancing state.
TEST CASE: 2
The output of the drive Battery system is shown below:
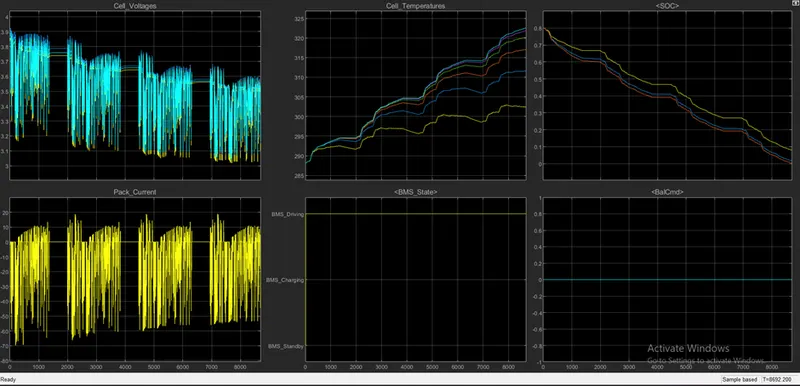
Here we can see the battery is in the charging state for the whole operation.
SOC:
The SOC of the battery gets depleted to 0% at the battery stops operating before reaching 20000 sec.
Cell Voltage:
The cell voltage is oscillating between 3.2V to 3.9V.
Cell Current:
The cell current is oscillating between -70A to 20A. Negative current shows there is regenerative braking.
TEST CASE: 2
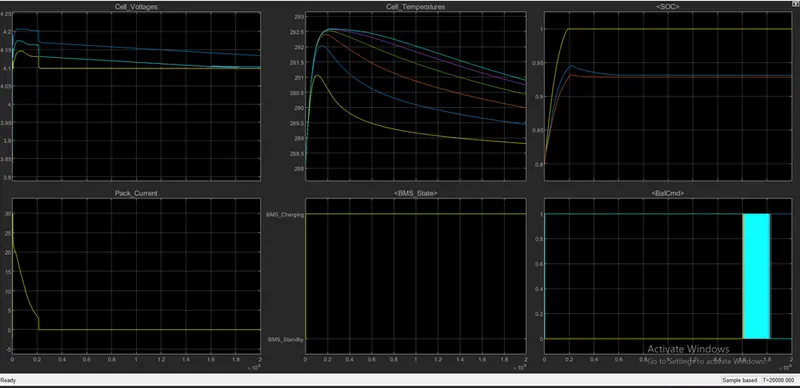
The battery system is shown in the charging state for the whole operation.
SOC:
It takes 0.2sec for the battery to get fully charged and hence the SOC is 100% for the coulomb counting case and is around 93% for the Kalman filter.
Cell voltage:
The cell voltage is around 4.1 – 4.2V for all the cells. So there is not much difference in the cells.
Cell Current:
The peak current is 30A which decreases to 0A when the battery gets fully charge.
2.
Coulomb counting is one of the techniques to measure the SOC of the battery pack. It is done by integrating the active flow of a current over a period of time to get the total sum of energy entering and leaving the battery pack.
In the model the coulomb counting is measured as follows:
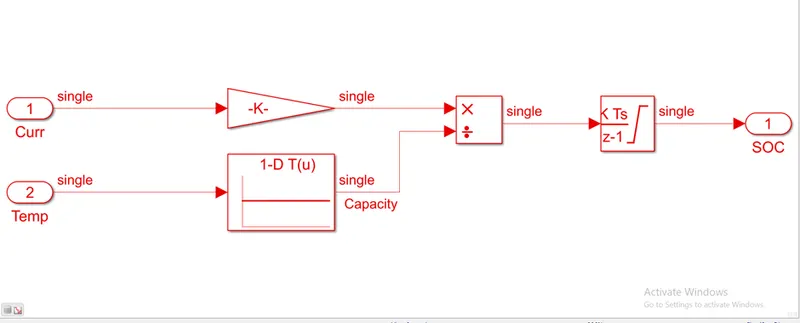
The current signal is multiplied with a gain of 1/3600 to get the current in second.
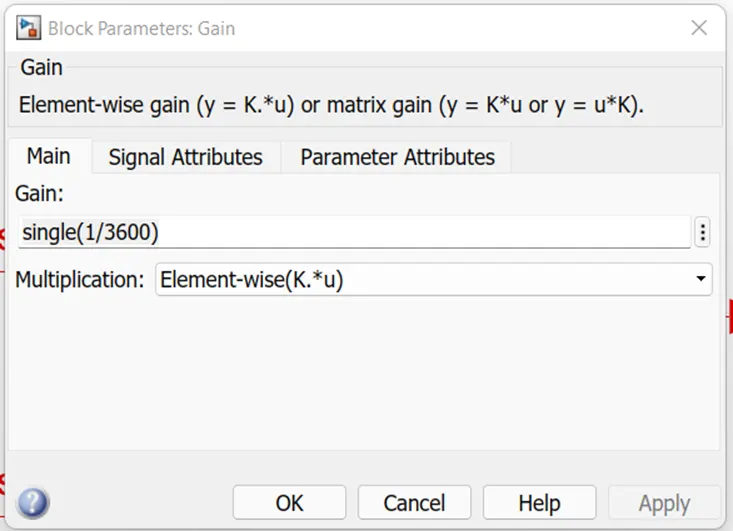
The temperature input undergoes a lookup table block and is divided with the current c=input wit ha gain. The output of the multiplier is integrated to get the SOC estimation