Week-11 Challenge: Braking
1.
We have created a custom driving cycle and calculate the braking energy for this driving cycle.
|
1 |
0 |
|
2 |
0 |
|
3 |
0 |
|
4 |
1 |
|
5 |
1 |
|
6 |
2 |
|
7 |
5 |
|
8 |
6 |
|
9 |
8 |
|
10 |
10 |
|
11 |
14 |
|
12 |
16 |
|
13 |
18 |
|
14 |
19 |
|
15 |
21 |
|
16 |
26 |
|
17 |
28 |
|
18 |
29 |
|
19 |
30 |
|
20 |
32 |
|
21 |
35 |
|
22 |
38 |
|
23 |
39 |
|
24 |
40 |
|
25 |
42 |
|
26 |
45 |
|
27 |
47 |
|
28 |
47 |
|
29 |
48 |
|
30 |
48 |
|
31 |
46 |
|
32 |
45 |
|
33 |
44 |
|
34 |
42 |
|
35 |
40 |
|
36 |
36 |
|
37 |
35 |
|
38 |
32 |
|
39 |
30 |
|
40 |
28 |
|
41 |
25 |
|
42 |
24 |
|
43 |
21 |
|
44 |
26 |
|
45 |
29 |
|
46 |
34 |
|
47 |
39 |
|
48 |
44 |
|
49 |
46 |
|
50 |
48 |
|
51 |
52 |
|
52 |
47 |
|
53 |
43 |
|
54 |
38 |
|
55 |
33 |
|
56 |
29 |
|
57 |
27 |
|
58 |
24 |
|
59 |
20 |
|
60 |
15 |
|
61 |
14 |
|
62 |
10 |
|
63 |
7 |
|
64 |
6 |
|
65 |
3 |
|
66 |
2 |
|
67 |
0 |
|
68 |
0 |
|
69 |
0 |
|
70 |
0 |
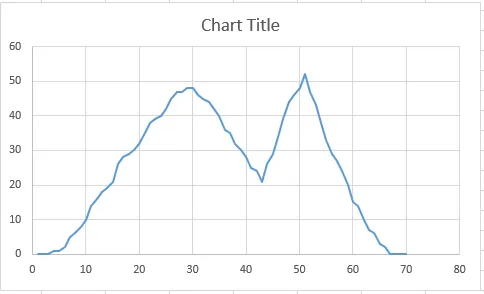
The graph of the drive cycle is
To calculate the braking energy
`E= 1/2*m*(v_f^2-v_i^2)`
And to get the power
`P= E/t`
Where,
M –mass of the vehicle
`v_f` --- Final velocity
`v_i`---- Initial velocity
P – Power of the motor
E – Energy required to move the vehicle
From the above graph we can see the vehicle is decelerating at 2 instances and we are interested in this 2 instances of the drive cycle. We have calculated the braking of this 2 instances and then added the power to get the total braking power.
The calculation of the braking energy is shown below
|
Acceleration Power Calculation |
|
||
|
Acceleration(m/s^2) |
1.2 |
1.2 |
|
|
Acceleration Force(N) |
71.875 |
85.22377 |
|
|
Acceleration power |
5.528846 |
4.734654 |
|
|
Total acceleration power |
10.2635 |
||
2.
The braking torques torque is not as high as the forward torque because the braking torque is applied in the opposite direction.
Braking of the vehicle occurs electrically by Regenerative braking. It is the form of braking in which the motor speed is greater than the synchronous speed and the motor acts as a generator and gives back power to the battery.
The torque speed characteristics of a particular Electric Vehicle are shown below:
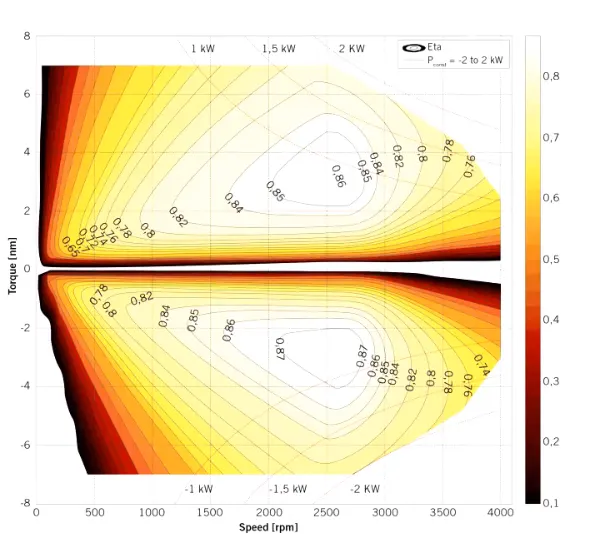
We can see the range of motor in the forward motoring mode and the braking mode are mirror image of each other.
Now as we know the characteristics of the Induction Motor. It has constant torque region upto the base speed and above the base speed the torque value decreases. The maximum torque is around 7N-m.
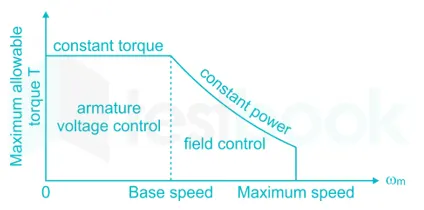
Suppose the vehicle is at very high speed i.e. above the base speed. That means the vehicle is operating at a region where torque is not constant, suppose the value of the torque is 4N-m. Here if we need to apply the brakes then the braking characteristics being a mirror image of the motoring torque will be less than the motoring torque i.e. 4N-m. Hence we see the braking torque is not as high as the motoring torque.
3.
The code is based on the modelling losses pf a traction motor.
The losses are
Copper losses:
`P_cu=K_c* T^2`
Iron Losses:
`P_i=K_i*ω`
Windage losses:
`P_w=K_w*ω^3`
Constant losses:
`P_Const=c`
Total losses are
`P_(t_otal)=P_c+P_i+P_w+c`
The MATLAB code for the efficiency plot are shown below
- x = linspace(1,1000);
- y = linspace(1,250);
- Kc = 0.2;
- Ki = 0.008;
- Kw = 0.00001;
- ConL = 20;
- [X,Y] = meshgrid(x,y);
- OutPower = (X.*Y);
- B = (Y.^2)*Kc;
- C = X * Ki;
- D = (X.^3)*Kw;
- InPower = OutPower + B + C + D + ConL;
- Z = OutPower./InPower;
- V = [ 0.70,0.80,0.85,0.90,0.91,0.92,0.925,0.93];
- box off
- grid off
- contour(X,Y,Z,V);
- xlabel('Speed/rad.sec^-^'),ylabel('Torque/N.m')
- Line 1-2: Taking the vectors of speed and torque
- Line 3-6: Defining the values of the loss coefficient
- Line 7: The Creating the mesh grid.
- Line 9-11: Defining the loss with its relation with speed and torque
- Line 12: Defining the total power equation
- Line 13: Defining the efficiency
- Line 14: Taking the values of efficiency.
- Line 15: To get rid of the box outline form the graph.
- Line 16: To get rid of the grids from the plot.
- Line 17: Plotting the contour od speed and torque for each values of efficiency.
- Line 18: Defining the x and y label of the plot.
The output of the efficiency plot are
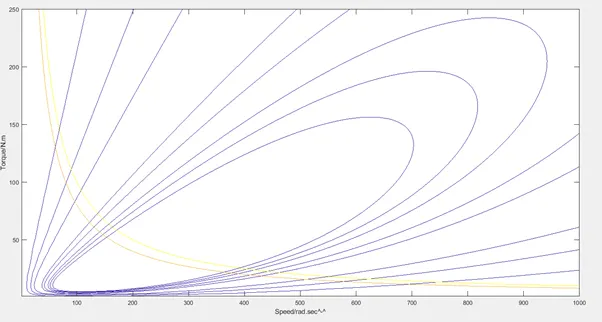
The different contour is for the different efficiency region and according to that efficiency the torque speed characteristics are plotted. Each contour defines each efficiency range and accordingly the torque speed charecteristics plots has been plotted.