- 1)For a defined driving cycle, calculate the energy required for braking.
- To calculate breaking energy the equation used is 1/2*m*V^2
- where m takes into consideration the inertia effect=1000 kg, V is the difference in velocity, V=Vf-Vi
- To calculate the braking energy it is neccessary to consider retardation processes in the drive cycle
- A WTC ,class 3 version 5 drive cycle and the retardations for 14 cycles are taken as below figure:
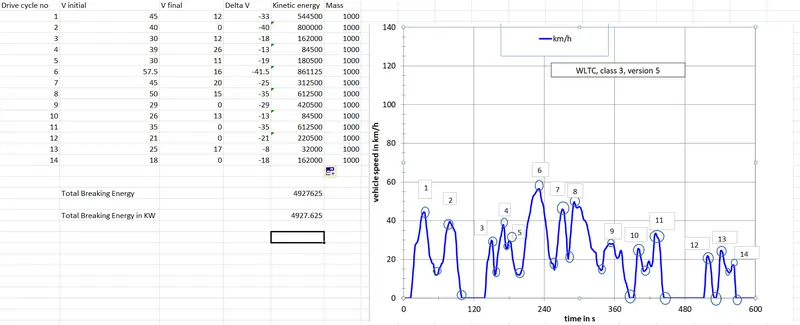
- The total braking energy obtained is 4927.625 KW
- 2) Why electric motor can’t develop braking torque at high speed similar to starting? How electric and mechanical brakes are coordinated?
- There are two types of braking systems deployed in HEV's and EV's: Regenerative braking and friction braking. In DC motors when the load on the motor is constant, the speed of the motor is proportional to supply voltage. When the supply voltage is constant,speed is inversely proportional to the load on the motor.
- Any increase in load torque on the motor will cause a decrease in the motor speed which can be inferred from the relationship:
- T= (V-w*k/R)*k
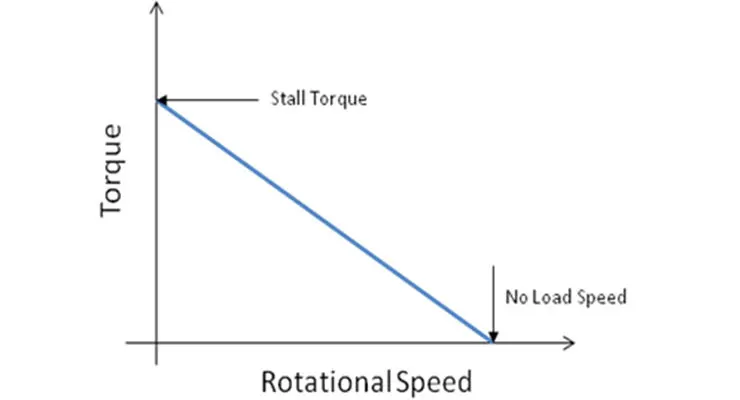
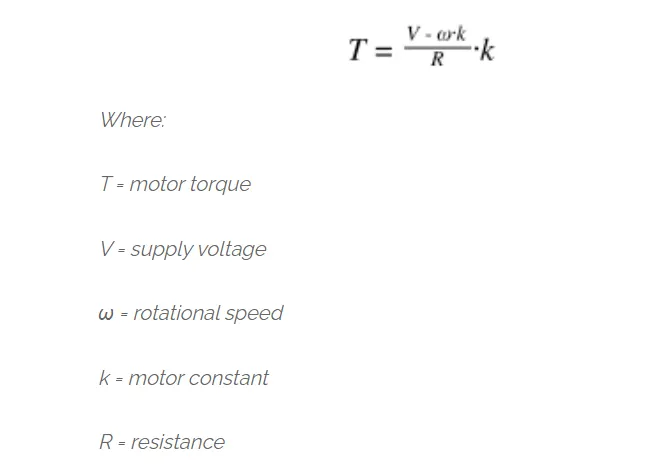
- The torque-speed curve begins at the crossing of the Y-axis, where the value torque is at peak and motor speed is zero. This torque is called stall torque or the maximum value of torque when the motor is running at nominal voltage. The characteristics have a negative slope and intersect the X-axis where there is zero torque and attain a maximum speed. This point is known as the no-load speed—the speed when running at nominal voltage and zero loads.
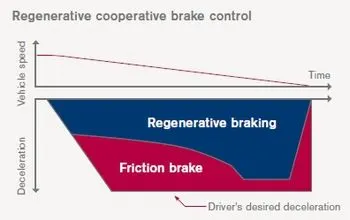
- The brake control strategies falls employed falls under two categories:
- 1) Series-Mechanical and regenerative brakes are applied one after another
- 2) Parallel-Both Mechanical brakes and Regenerative brakes are applied simultaneously
- EVs and HEV's use regenerative braking, thereby charging the battery using the bidirectional converter. For this the kinetic energy of the vehicle is converted into electrical energy. There is an intelligent statergy developed by Nissan which and controls optimization of the regenerative brake and regular friction brake (hydraulic brake).This is called as Electric Driven Intelligent Brake. The battery cannot charge at the same charge it is discharging. It may be discharging at 2C rate for high requirements but the back current flow to charge the battery has restrictions.
EDIB (Electric Driven Intelligent Brake)
- It works by controlling the reactive force from the pedal in order to unify the feeling when stepping down on the pedal and the sense of deceleration.
- when the brake pedal is applied the reactive force on it is sensed by the stroke sensor. This information transmitted to the ECU which inturn controls the motor. The motor engages the piston and amplifies the friction brake's pressure . Through optimum control of the friction brake's hydraulic pressure, the energy regeneration outcome is maximized. It works in such a way that intially both are working and at low speed and high torque which is retardation regenarative braking is done.
-
- 3)Make a MATLAB program which plots contour of given motor speed, torque and efficiency values. Attach the code as a .m file attach a screenshot of all the plots
% program to plot efficiency contours of electric motor
% x axis represents motor speed w
% y axis represents torque
x=linspace(1,200);% rotational speed in rad/sec
y=linspace(1,60); % torque 0 to 60 nm
% there are losses that happen in a motor
% there are four types of losses
% copper losses due to-I^2R losses due to armature resistance
Kc=1.4;% Kc is resistance of brushes
Ki=0.11;%Ki represents iron losses that change according to speed
% Ki*w-due to back emf-magnetic field
Kw=0.00001% Kw*w^3 represent windage losses where Kw is dependant on size and shape of motor
Const_loss=21;% losses other than above 3
% making a meshgrid
[X,Y]=meshgrid(x,y);
%power=torque*speed
Out_power=(X.*Y);
B=(Y.^2)*Kc;%Copper losses
C=X*Ki;%Iron losses
D=(X.^3)*Kw%windage losses
Inp_power=Out_power+B+C+D;
Eff=Out_power./Inp_power;
% range of efficiency values for which contours will be plotted
V=[0.5,0.6,0.7,0.75,0.85,0.88,0.90,0.92];
box off
grid off
contour(X,Y,Eff,V);
xlabel('Speed/rad.s^-^1'),ylabel('Torque/N.m')
hold on
%contour for power output
V=[3000,5000];
contour(X,Y,Out_power,V)
- Arrays are formed for rotational speed and torque using linspace command
- In a motor there are four types of losses
- 1) Copper loss (Kc)-These are generated as a result of the armature resistance==>T proportional to I ==Kc*T^2
- 2) Iron loss(Ki)-change according to speed , as speeds are changed back emf of different values are generated (magnetic field effect)==>Ki*w
- 3) Windage losses(Kw)-Kw*w^3==> due to size and shape of motor
- 4) Other losses that are innately constant (C)
- A meshgrid is formed with X as rotational speed and Y as torque
- Output Power at all these points (x,y) is found by T*W
- Total losses is sum of all above losses
- Input power is sum of output power and input power
- To form a contour different variable values are assigned for efficiencies. Here the V which contains efficiency values are plotted on w-T plane
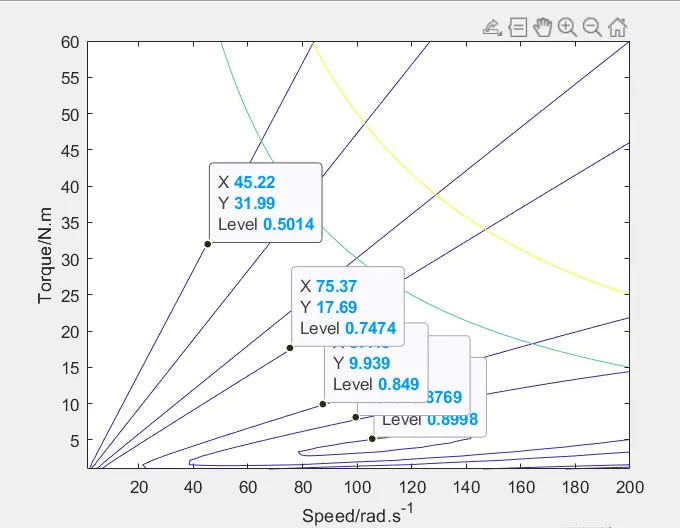
- The innermost contour has the highest efficiency. The graph is in such a way it explains: to obtain an efficiency of 74% the motor should be having a rotational speed of 75.37 rad/s and delivers a corresponding torque of 17.69Nm. The contour plots helps in identifying the range values for which maximum efficiency can be obtained.