Week-4 Challenge WOT Condition Part-2
- 1) What is the difference between the mapped and dynamic models of engine, motor and generator? How can you change model type?
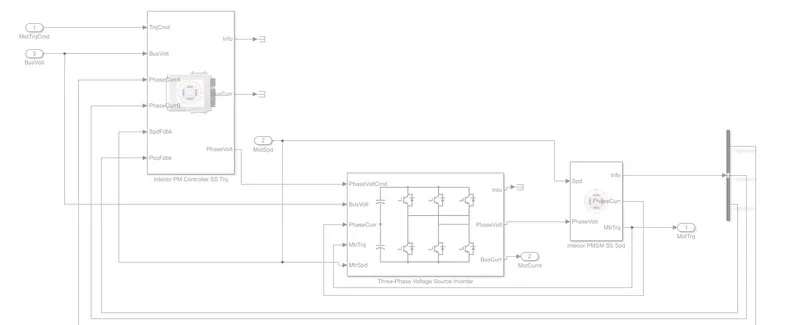
- Initially, a motor torque command is generated. Depending on whether traction or bracking the forward command as chose. This motor torque command is given to the passenger car block. This passenger block a passenger car that contains an electric plant and drivetrain subsystems. Inside the electrical plant, the battery and motor generator blocks are present. These is in form of loop up table. Inside the motor contrller block there are two blocks
- a) MotGen EV Mapped-It is a static model based on motor data and works on data given in form of lookup tables. The values fed to this is in form of look-up table and a lookup table block uses an array of data to map input values to output values, approximating a mathematical function. This is mapped with an implicit motor controller. This can be integrated with the controller of the desired choice. The default motor has a drive operating in torque control mode. A desired value of torque can be selected that falls in the torque-speed plot. Generally, the motor has two operating regions. A constant torque region which changes to constant velocity post a critical speed value. The input port can be configured with respect to torque and speed.
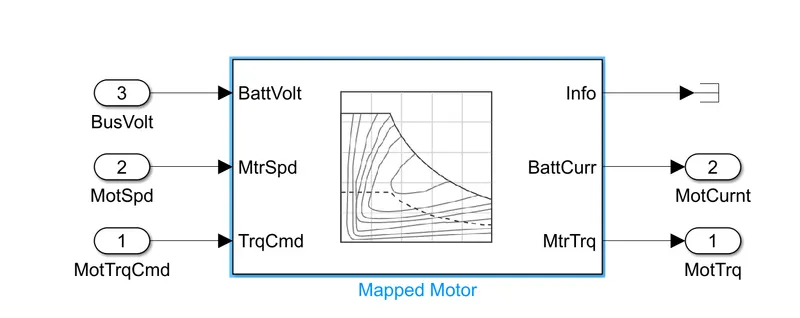
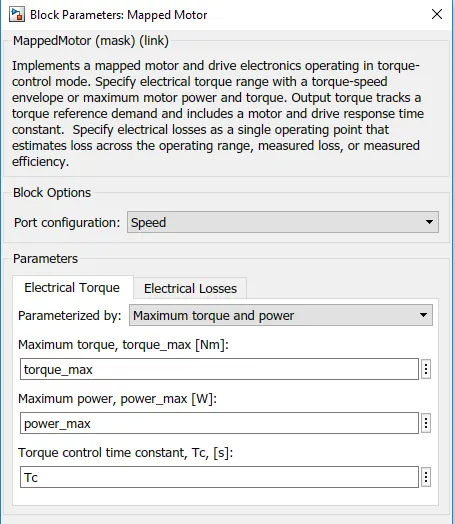
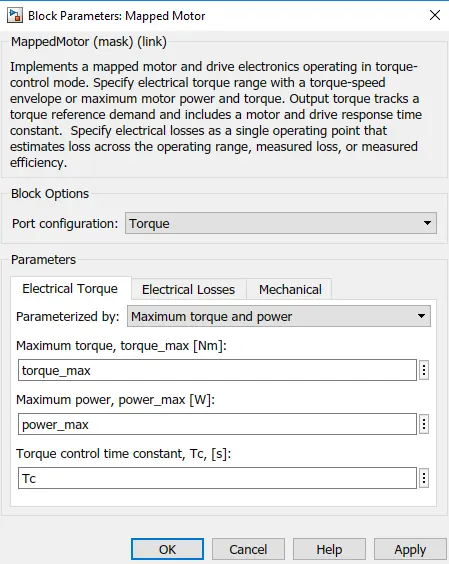
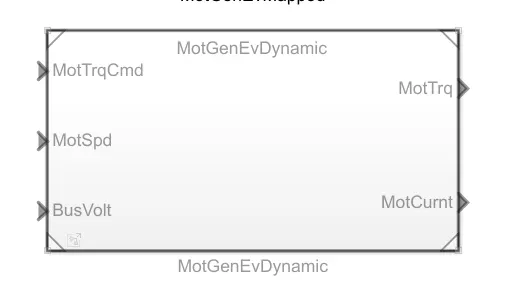
- b) MotGen EV dynamic-Interior permanent magnet synchronous motor with controller. This is a dynamic model representing actual component within and represent sa real system
-
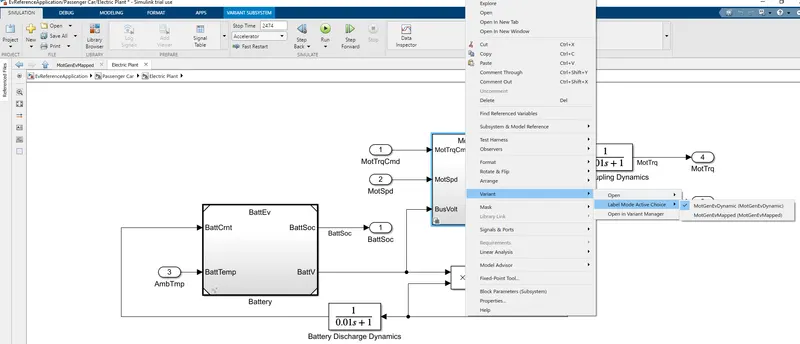
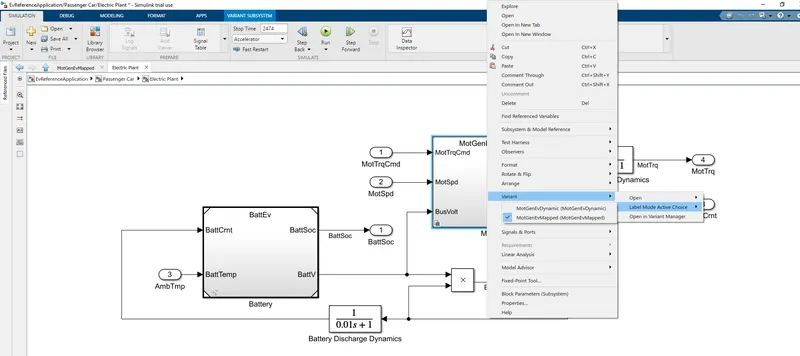
- The activation of a model is done as below:
- 1) MotGen EV dynamic
-
- 2) MotGen EV Mapped
-
- 2) How does the model calculate miles per gallon? Which factors are considered to model fuel flow?
- 1) autoblkHevStart command is given in matlab command window to open and get the reference HEV application.
-
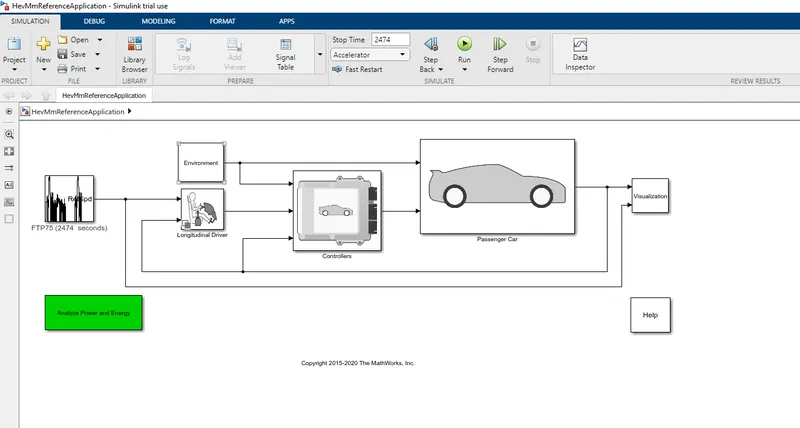
- 2) The subsystem for calculating fuel flow is shown below:
-
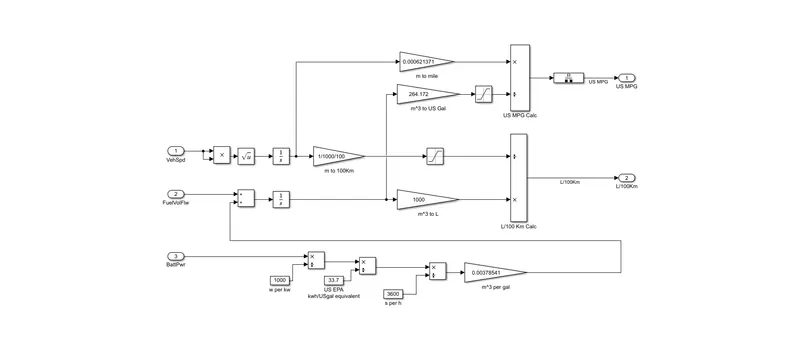
- The fuel flow is dependant on battery power , vehicle speed and fuel volume flow. Engine works along with the motor. The vehicle speed is a paramter that keeps on varying with time hence the RMS value is taken to model fuel flow. that As it is a hybrid engine block is also present. All work on look up tables. To attain the peak power is drawn from battery and the maximum power is met by adding engine power and battery power. At a time of de accelaration by regenerative braking the battery is charged. During vehicle motion, the state of charge of battery is checked and its rate of discharge the same converted to an equivalent term of fuel and added to fuel volume. Vehicle speed (rms value taken)which is x dot (dx/dt) is fed into an integrator block. The fuel flow is integrated . The distance obtained from vehicle speed using an integrator block is multiplied liters of fuel used. (1/distance * fuel consumed) to obtain fuel consumption per km. MPG is calculated by converting distance to miles by using a gain block with it (0.000621371) and then converting the total fuel used in m^3 to gallon. Then (1/distance * fuel consumed)
- 3) Run the HEV ReferenceApplication with WOT drive cycle. Change the grade and wind velocity in the environment block. Comment on the results.
- Model:
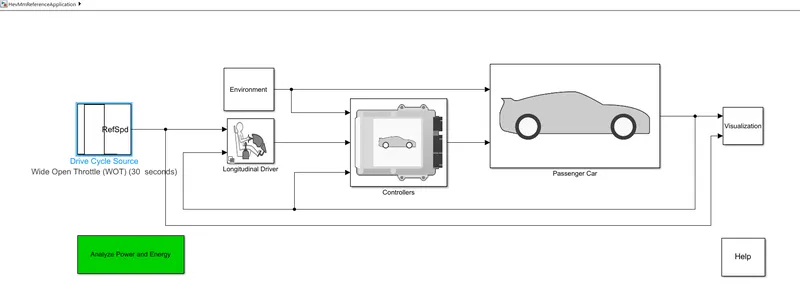
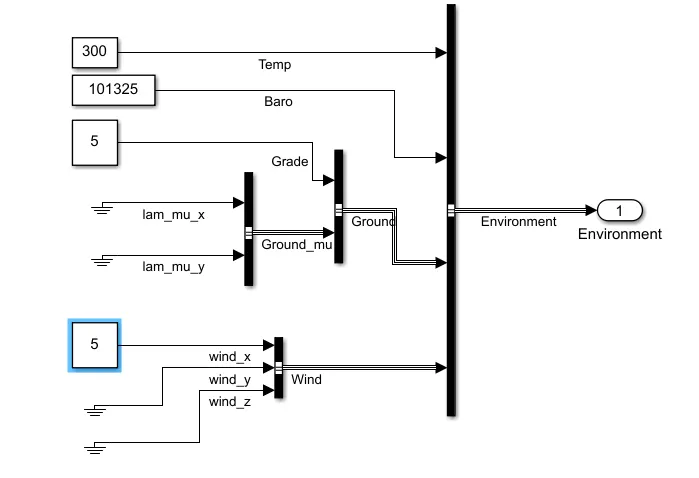
- The value of wind velocity and grade is changed in environment block: Initially the grade and wind velocity are taken as zero and second case 5 deg and 5 m/s each.
- Ouput when the wind velocity and grade are zero:
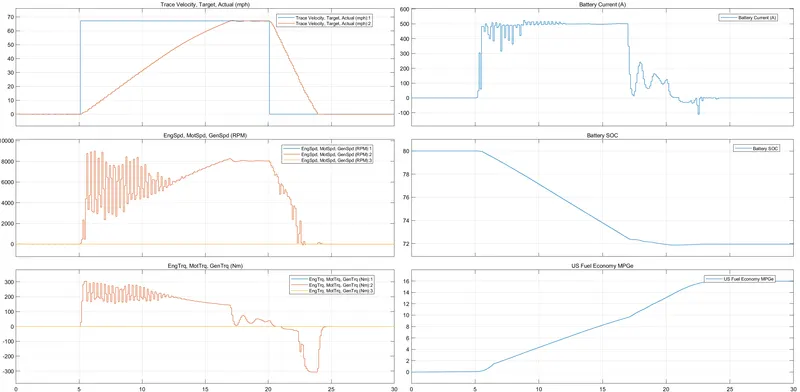
- For a grade of 5 and wind velocity of 5 m/s
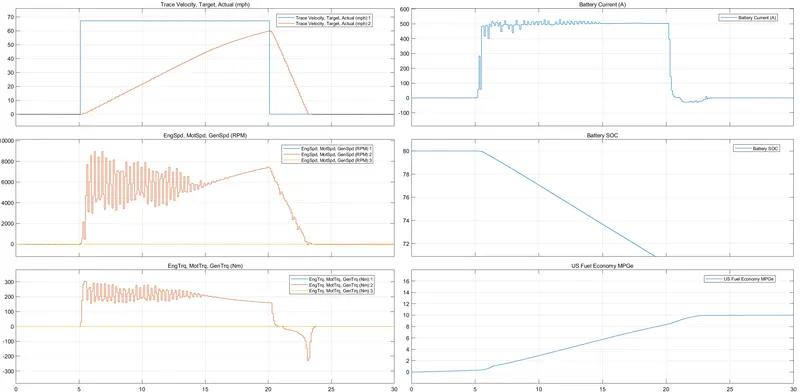
- The drive cycle is for a period of 30 s. Where the vehicle attains a velocity max velocity of 68 m/s in 5 s. But in reality to attain the peak speed it takes about approx 17 s. To attain the peak power both engine and battery is used. After the entire drive cycle the state of charge for the battery is 72%. During attaining peak speed it drains about 8% of battery . When the grade and wind velocity is increased the vehicle is not achieving top speed. The major reason for this can be attributed to wind speed which increases the drag force creating more tractive effort which is beyond the capability. So a higher watt rating can help the cause
- 4) Keeping all other parameters same, compare the simulated results of hybrid and pure electric powertrains.
- For both pure electric and hybrid electric a grade of 5 deg and WOT of 40 s is used and run.
- Output of HEV
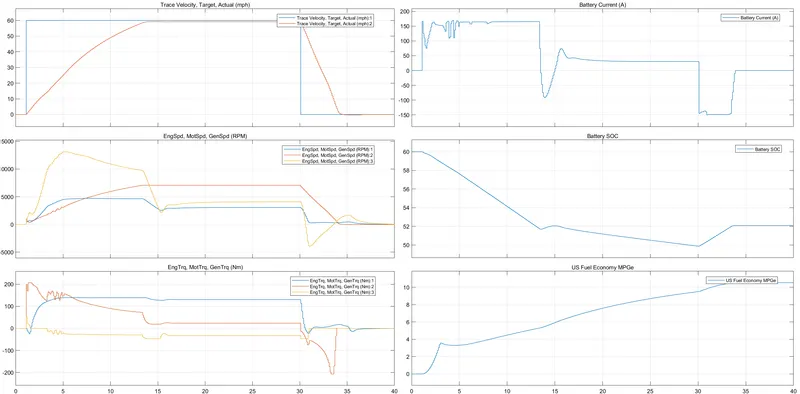
- The WOT cycle has a peak speed of 60 mph. In a real case with a grade of 5 the hev never attains the top speed attained is 58.8 mph. The top speed is not realized. There is a battery drain of 8% and 395 MPEG to attain top speed. The state of charge at end of cycle is
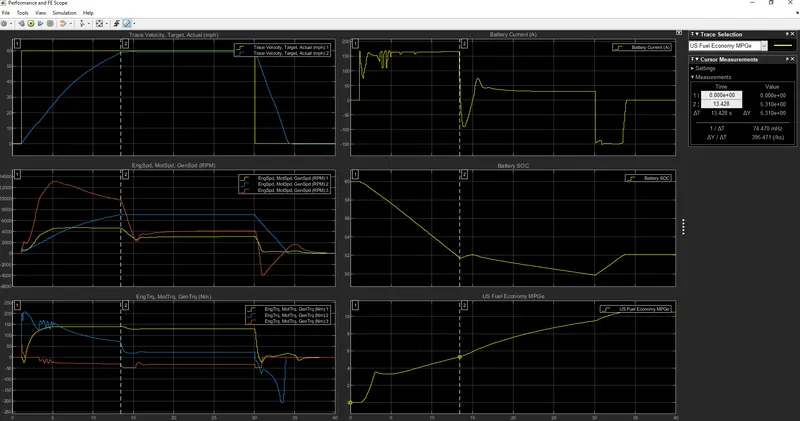
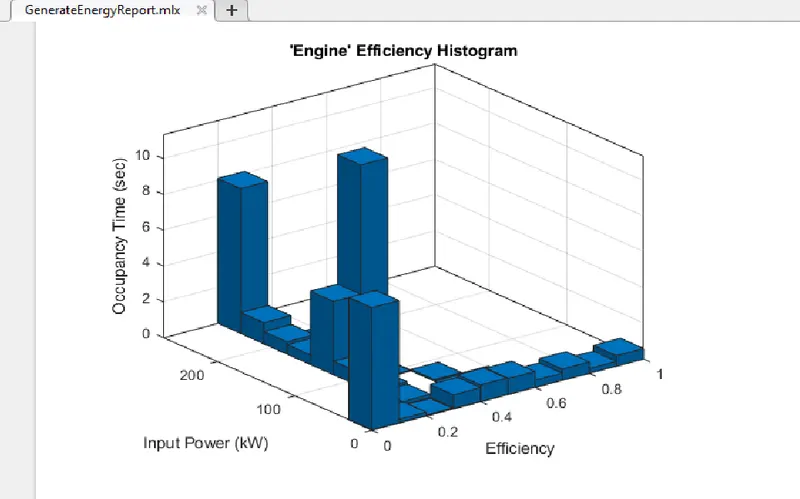
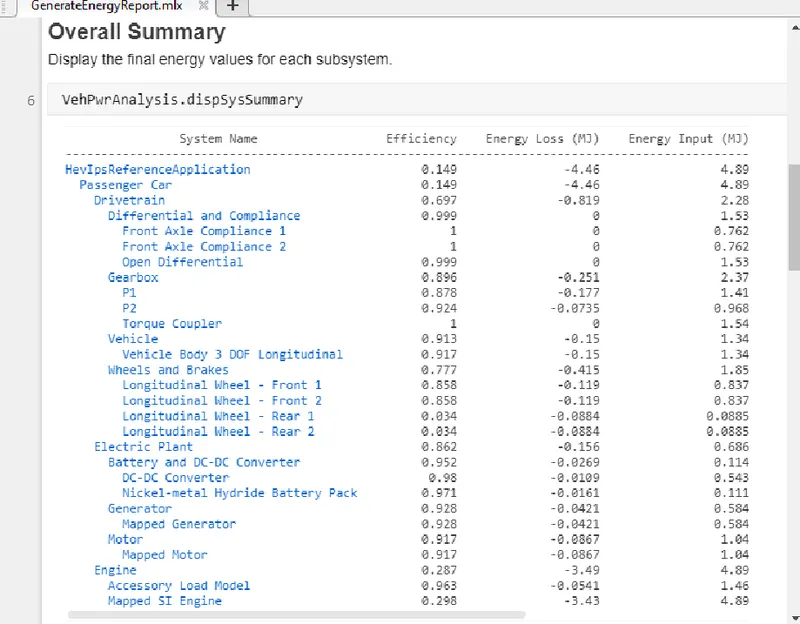
- The total power input for cycle is 4.89 MJ
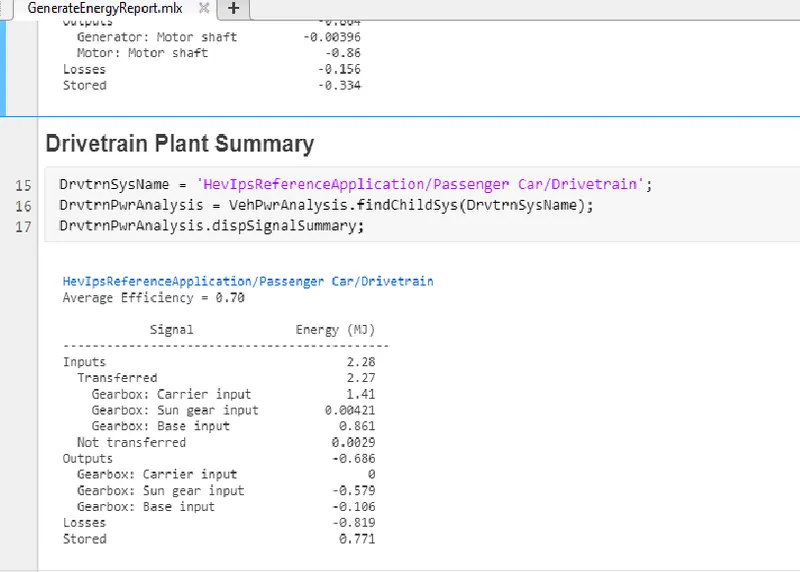
- The average for an hybrid drive train is 70%
- Output for EV
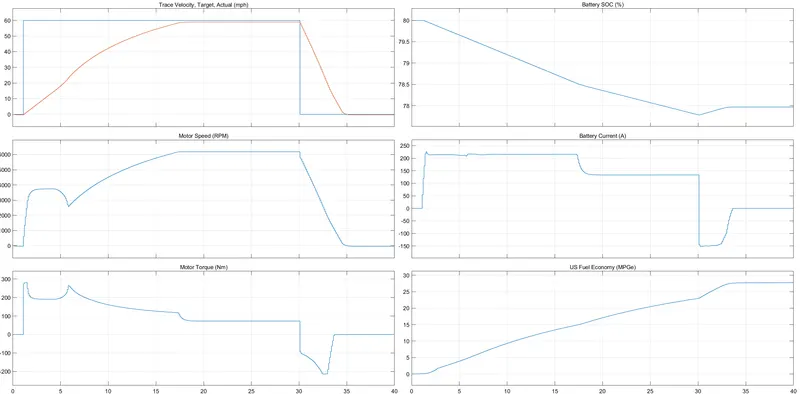
- Similar to case of HEV the top cycle speed is not realized . The maxiumum speed realized is 58.57 less than in case of HEV. The op speed is realized in 17.5 seconds. The state of charge at end of cycle is 78%.The total battery drain is about 2% this is because of regenration.
- Inference
- 1) For all same parameters top speed achieved in a hev is higher
- 2) The soc is higher in an ev.There is more regeneration in an ev compared to hev
- 3) The acceleration time required to acheive the speed is more in an ev compared to an hev
- 4) The drive train energy has less loss in electric when compared to hev