System level simulation of an all terrain vehicle
- 1) AIM
- a system-level simulation of an all-terrain vehicle.
- 2) THEORY
- Continous variable transmission
- A CVT transmission or continuously variable transmission has many gear ratios at its disposal. It can be visualized as a type of automatic transmission that has gained traction among auto OEM's and as a way to improve fuel economy. Decades back it was thought that a 3 gear or 4 gear system is sufficient enough to for a vehicle's transmission. In fact, many early automatics had only two speeds. But now eight, nine, and even 10 speeds are becoming a common sight.
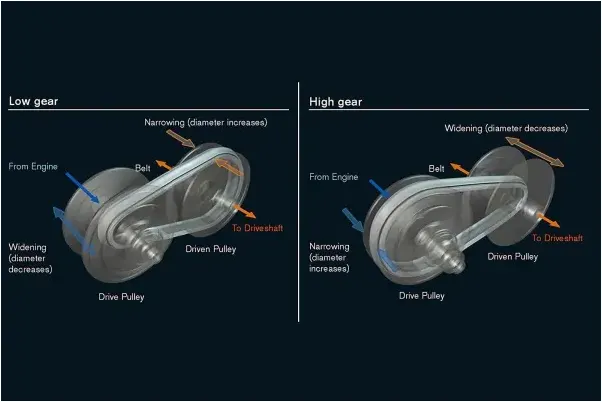
- More the number of gears in a transmission, it is easy to optimize engine speed in various drive conditions. Lower gears can provide better acceleration whereas higher ones can increase efficiency thereby fuel economy. This makes it easier for manufacturers to meet government efficiency standards and provide an improved economy for owners, even with existing engines.CVTs differ from traditional automatic transmissions in that they don't have gears that provide "steps" between low- and high-speed operation. Instead, the majority of them work via a pair of variable-diameter, cone-shaped pulleys connected by a steel or composite belt.
-
- All terrain vehicle
-
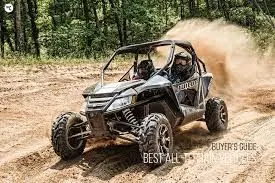
- All terrain vehicle-An all-terrain vehicle (ATV) is defined as a motorized off-highway vehicle. The purpose of the ATV is that it is designed to travel on four low-pressure or non-pneumatic tires, having a seat designed to be straddled by the operator and employs handlebars for steering control.
- ATVs are subdivided into two types as designated by the manufacturer.
- Type I ATVs are intended by the manufacturer for use by a single operator and no passenger where as Type II ATVs are intended by the manufacturer for use by an operator and a passenger, and are equipped with a designated seating position behind the operator.
- The need for CVT in an ATV?
- The Continuously Variable design ensures the ATV or UTV is always in the “right” gear and the engine RPM is in the heart of the powerband to deliver optimum power to the ground at any speed and in every application.
- 3) STUDY
- Case 1: Simulation of BAJAJ ATV model with CVT
- The required model is depicted below :
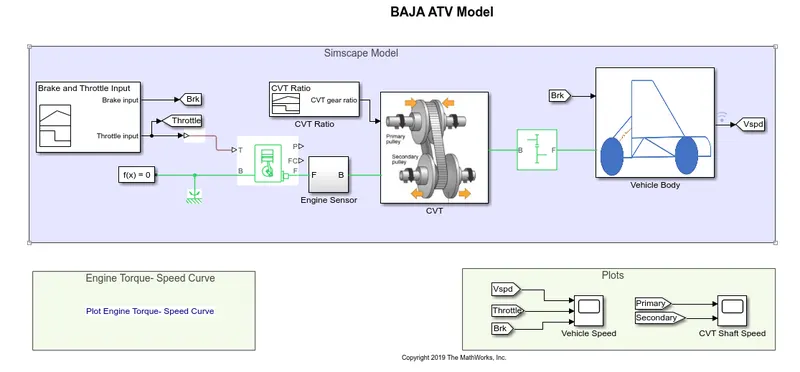
- The image depicted below represents the subsystem used to form the model
-
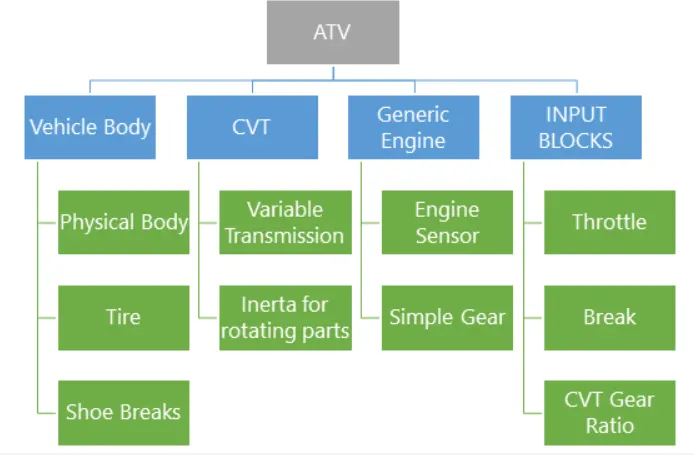
- Inputs to the model and blocks used:
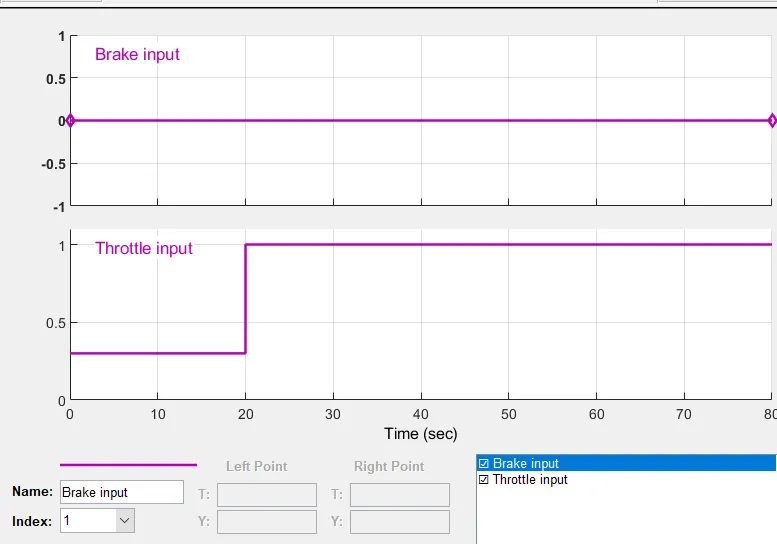
- There are two inputs provided using signal builder one is the break input given a 0 value other is a throttle input which has a value of 0.25 for 20 s and is increased to 1 and remains same for total 80 s. Both these are fed to generic engine
- Generic Engine block
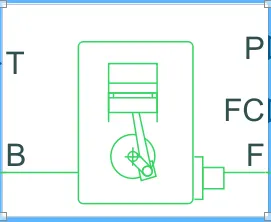
- The throttle which is an input is fed to T inport. This establishes a relation between speed and torque.Connections F and B are mechanical rotational conserving ports associated with the engine crankshaft and engine block, respectively. Connections P and FC are physical signal output ports through which engine power and fuel consumption rate found out and transmitted to further systems. The port F is connected to a sensor which finds the angular velocity and displacement of the crank shaft.
- In the model inorder to restrict a high rpm from engine a gear is used before feeding the rpm values to the CVT
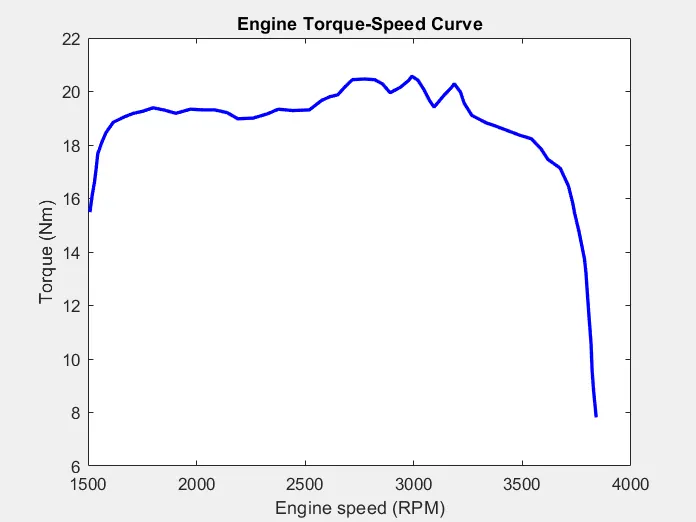
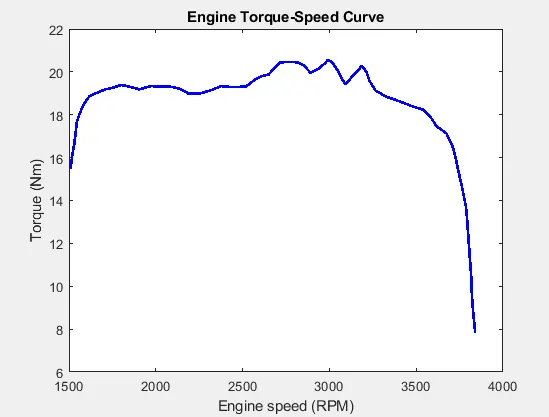
- The engine speed torque characteristics are also represented above
- CVT
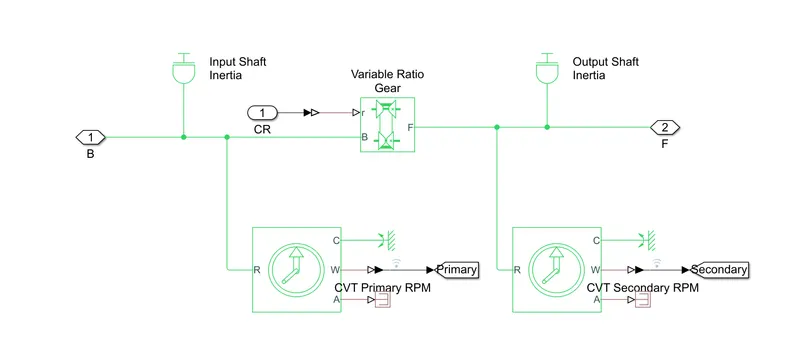
- There are two pulleys a primary which is the driver and secondary which is driven
- These have an input and output shaft inertia respectively
- The variable-ratio gear block provides the different gear ratios ( represents multiple gears of CVT)
- The gear ratio input is fed to the r port of the above block
- The angular velocity of the two pulleys is tracked using ideal rotational sensors.
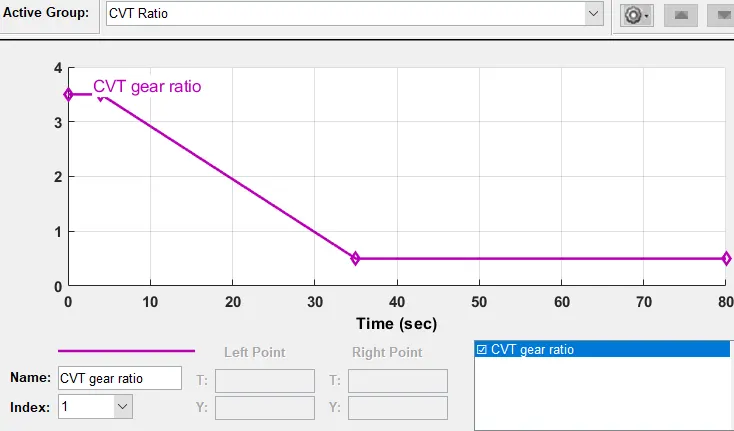
- The input to the CVT is defined using a signal builder block
- Vehicle system
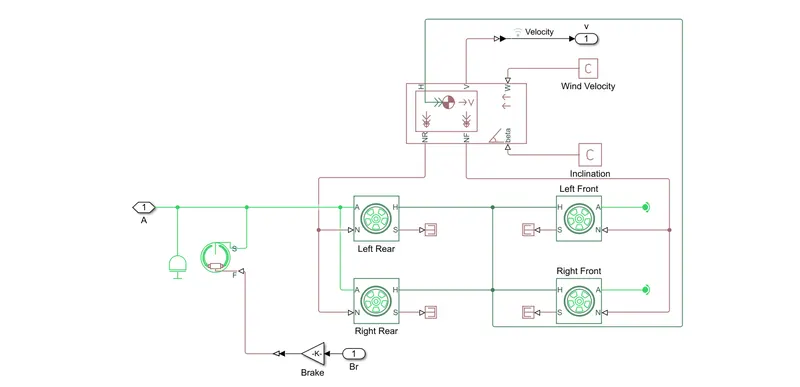
- The vehicle subsystem accounts for the forces acting on the body.
- For a vehicle to mobile, it has to produce tractive effort to overcome forces due to drag, rolling resistance, hill climb, and also acceleration
- In the subsystem, a double shoe brake is applied to the rear wheels. Two of these are kept at both ends to prevent action of unbalanced forces
- The parameters for vehicle and wheels is represented below.
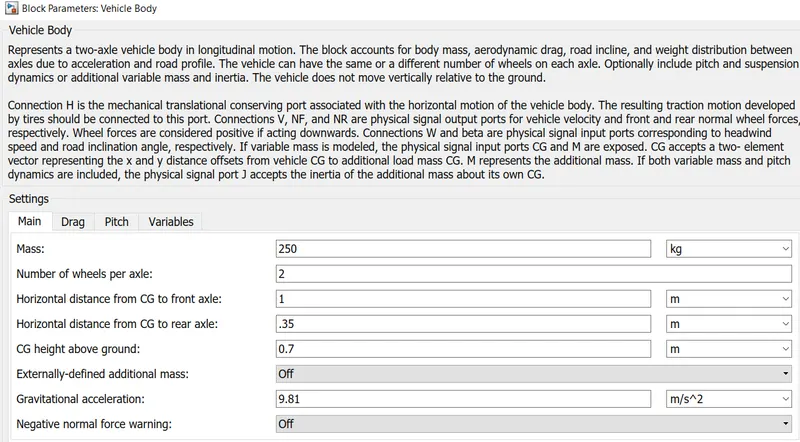
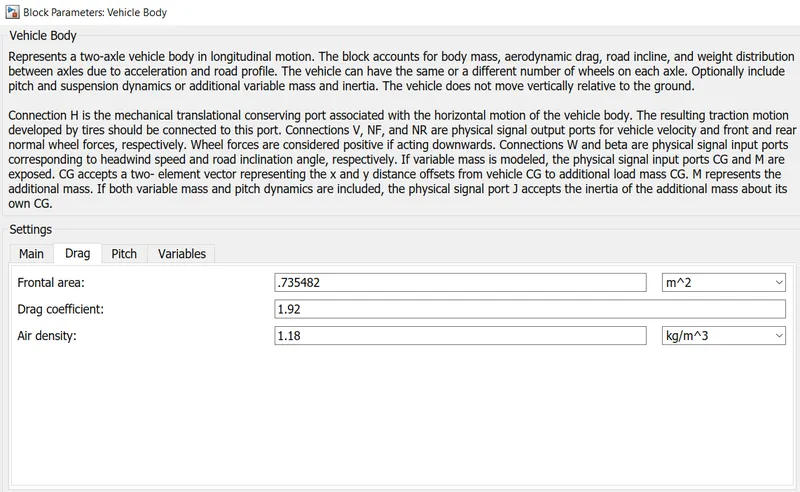
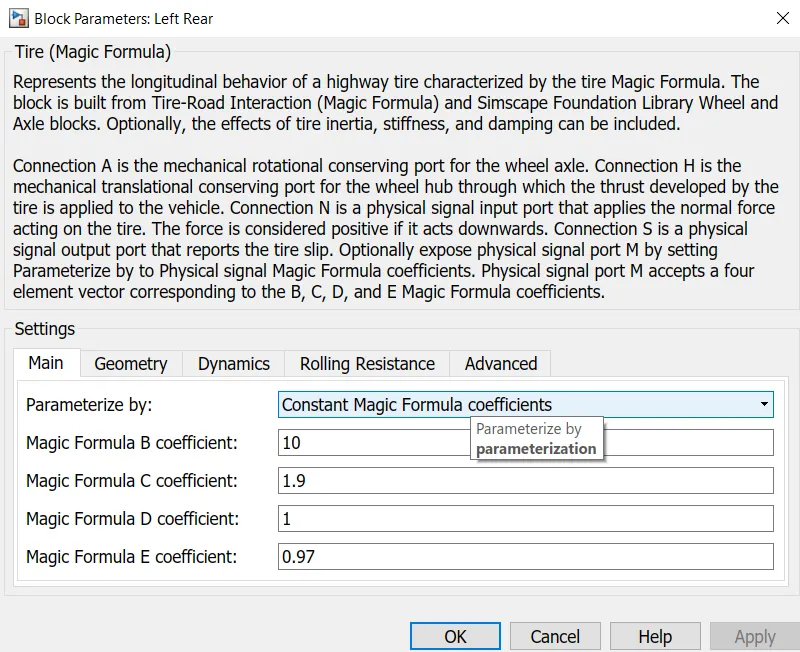
- Results and observations for case 1
- a) Engine Torque Vs Speed
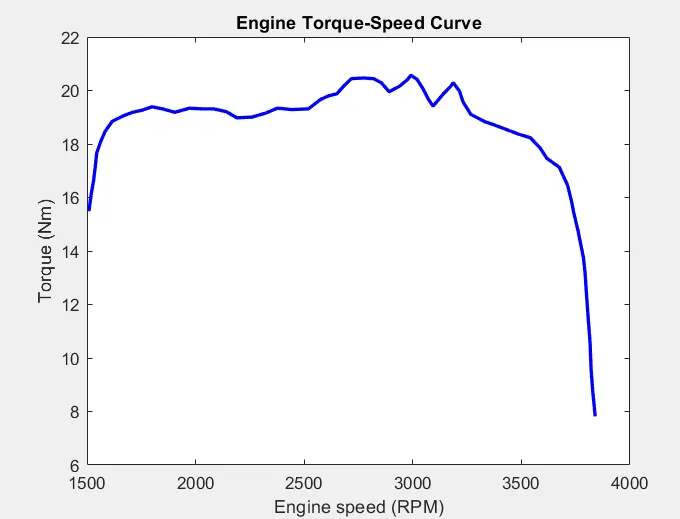
- The value of starting torque is very high which is needed for pick up
- b) Vehicle speed curve
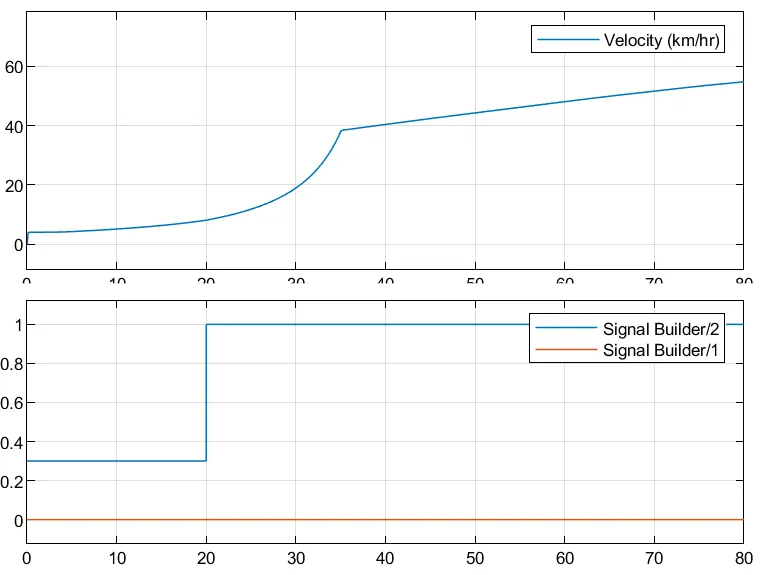
- The throttle input changes from 0.3 to 1 after 20 s. That can be seen in the graph that as a change in throttle occurs similar to wot and the lack of a brake the vehicle speed keeps on increasing till it attains top speed
- 3) CVT shaft speed
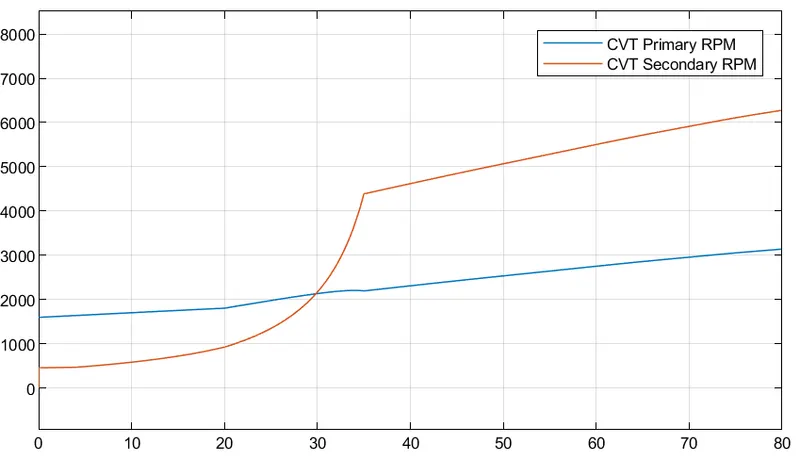
- The effect on CVT can be studied by dividing the above into 3intervals.
- 1st- 0 to 20 s-During the initial period the CVT ratio is high. This can be visualized as synonymous to gear ratio. By definition, in terms of rpm, it is the speed of the input shaft to speed to the output shaft in this context. During this period the driver will have a small diameter and the driven will have a larger diameter to facilitate the demand for higher torque. CVT ratio: 0-10 s , >2 where as > 30s,0.5
- 2nd-When there is an increase in throttle value, the speed of the vehicle increases. As this happens the driver starts to increase its diameter thereby a decrease in gear ratio to provide more rpm at driven.
- 3rd-When there is an increase in the speed of the vehicle it can be seen that there is an increase in rpm of driven( secondary) compared to that of the primary. This means that the first pulley will have a larger diameter for a higher rpm and for one rotation of a larger pulley there will be more rotation of driven.CVT ratio keeps on decreasing
- Case 2: Simulation of BAJAJ ATV model with CVT and dashboard
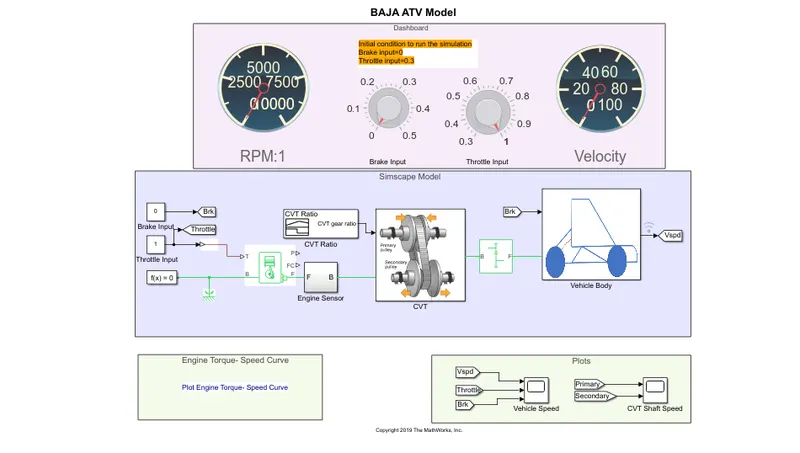
- In the first case the inputs throttle and brake was given as signal builder. But here there are knobs to control the input variables and can be controlled real time.
- The input knob for throttle starts to 0.3 where as brake knob is set at 0. The speed is increased in real time and the brake as well.
- Results and observations for case 2
- a) Engine Torque Vs Speed
-
- b) Vehicle speed curve
-
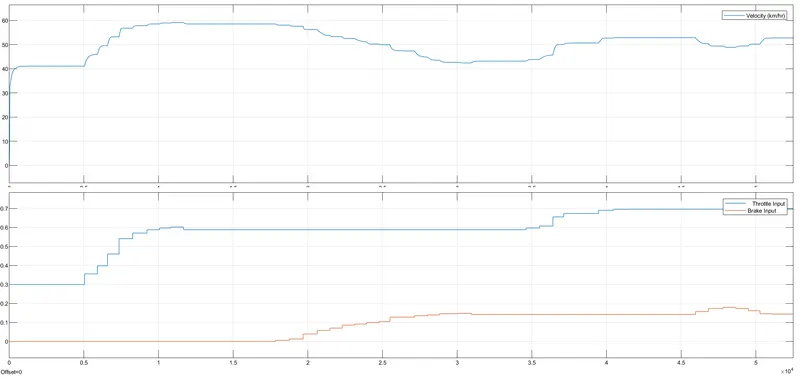
- The brake input is not changed for the first three seconds whereas the input value of the throttle is changed gradually and at 0.7 at t=1.5. For this period of time, the speed of the vehicle keeps on increasing. After 1.5 sec the brake input is changed from 0 gradually which creates a decrease in speed.
- 3) CVT shaft speed
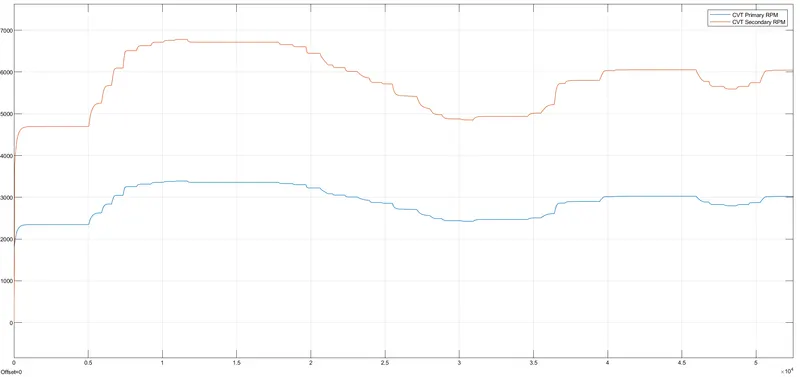
- When there is an increase in throttle command there is an increase in speed of vehicle. This leads to a decrease in CVT ratio compared to start where more torque is needed but when there is braking for ex at t=3,CVT-0.48 compared tp t=1,CVT-0.47.
- Case 3-Simulation of BAJAJ ATV model with a lookup table- The difference of feedback
- A look up table is an array of data that maps input values to output values. This is done so as to approximate a mathematical function.When a set of input values are know a look up yield an output value corresponding to each input from a table of values. If the lookup table does not explicitly define the input values, Simulink helps by estimating an output value using interpolation, extrapolation, or rounding, where:
-
- Interpolation is the process for estimating values that lie between known data points.
-
- Extrapolation is the process for estimating values that lie beyond the range of known data points.
-
- Rounding is a process for approximating a value by altering its digits according to a known rule.
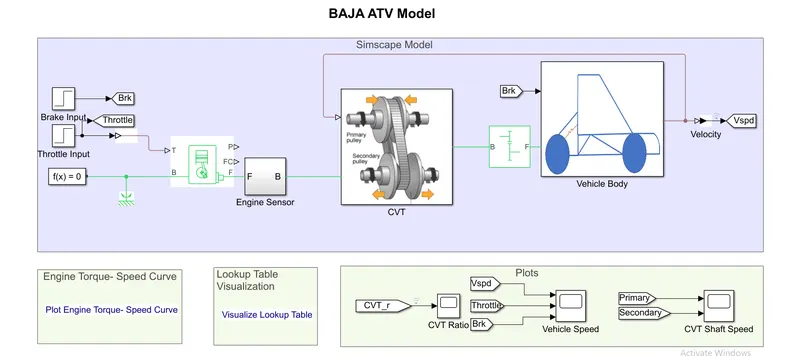
- When compared to case 1 and case 2 there exists a difference. The input to CVT is a look up table which says for a particular CVT ratio what is the speed delevered.
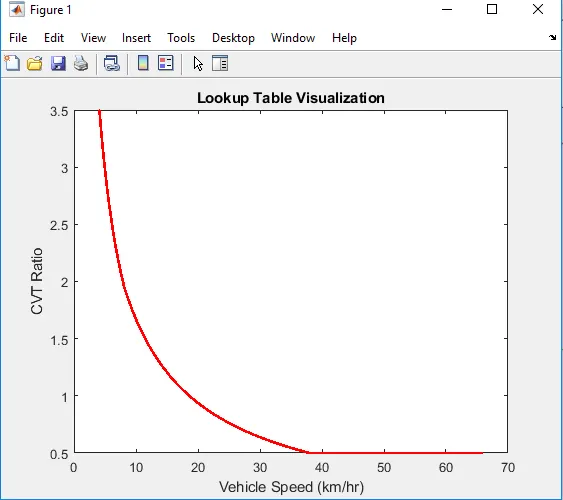
- Apart from this the output speed is also tracked as fed to the primary pulley of CVT, thereby acting as feedback for effective reference tracking.
- Results and observations for case 3
- a) Engine Torque Vs Speed
- b) CVT ratio
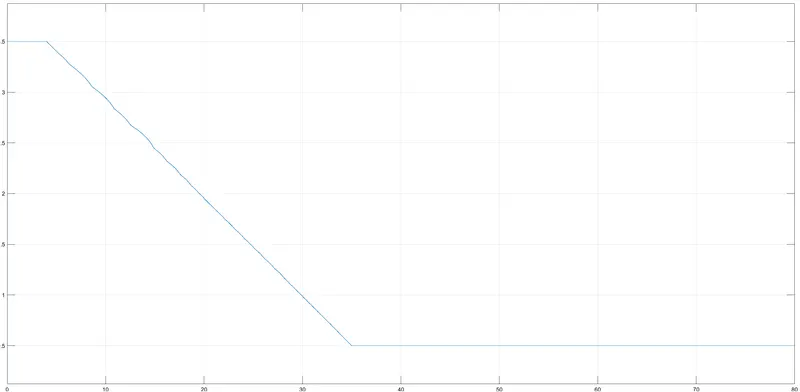
- For starting the vehicle needs a high torque hence a higher value for CVT. The CVT ratio keeps decreasing. The lookup table has vehicle speed values corresponding to a CVT ratio. For example in look-up table at speed of 20km/hr, the CVT ratio is approx equal to 1. Since there is reference tracking vehicle speed becomes 20 km/hr at 30 s. From the above graph at 30 s, is 1. This is due to the presence of feedback.
- c) Vehicle speed curve
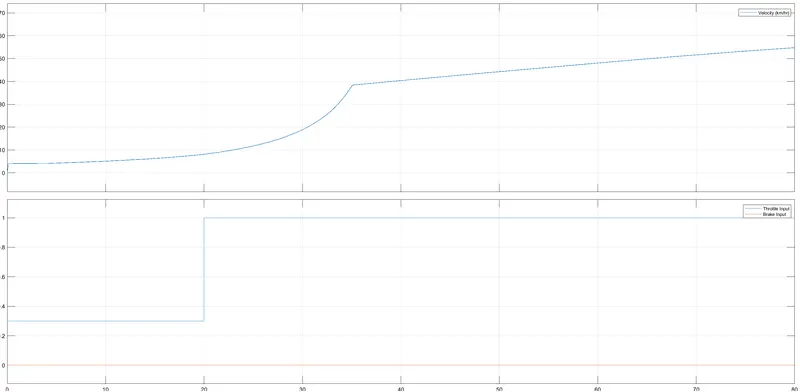
- At t=35 s the vehicle speed starts increasing hence there is decrease in CVT ratio to obtain more rpm of driven shaft where as rpm of driver shaft decreases.
- d) CVT shaft speed
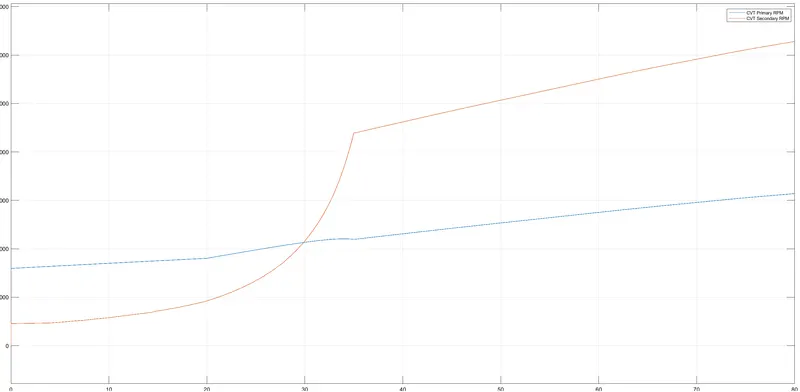
- As speed increases secondary shaft speed increases leading to a lower CVT ratio as matching with the loop up table values.
- Case 4: Simulation of BAJAJ ATV model with CVT and dashboard
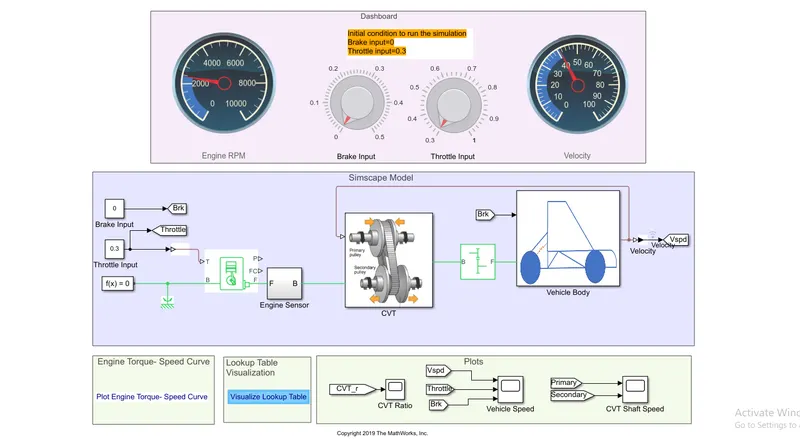
- With help of a knob it is possible to control the throttle and brake inputs.
- A lookup table is used to establish a relationship between vehicle speed and CVT.
- The intial input value for throttle is 0.3 but for brake is 0.
- Results and observations for case 4
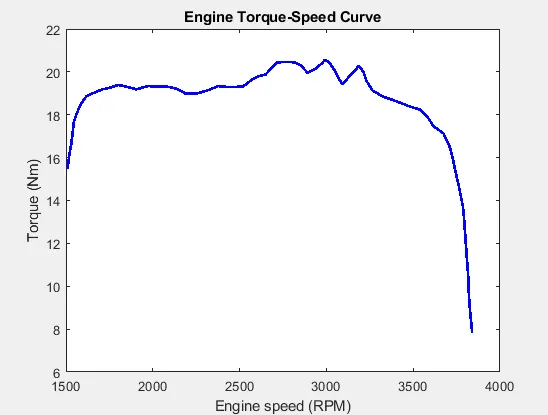
- a) Engine Torque Vs Speed
- b) CVT ratio
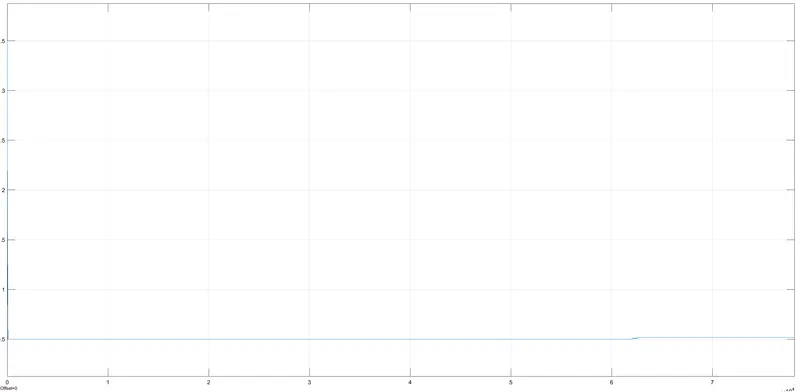
- The input value of throttle is set as 0.3 so there is gradual decline in CVT ratio but a steep fall at start itself can be seen.
- c) Vehicle speed curve
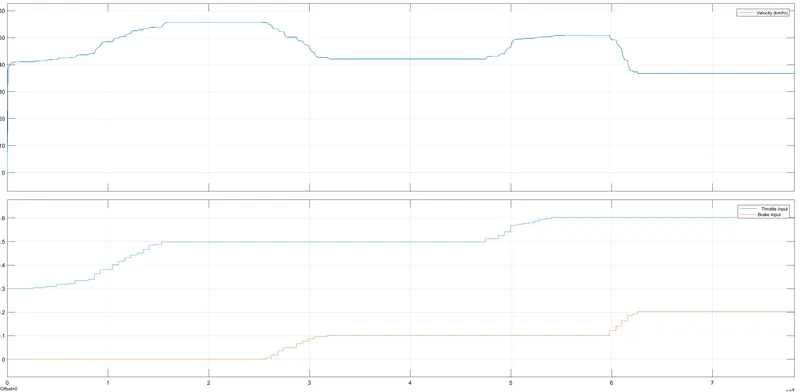
- When ever there is a fall in speed there is an increase in brake input
- d) CVT shaft speed
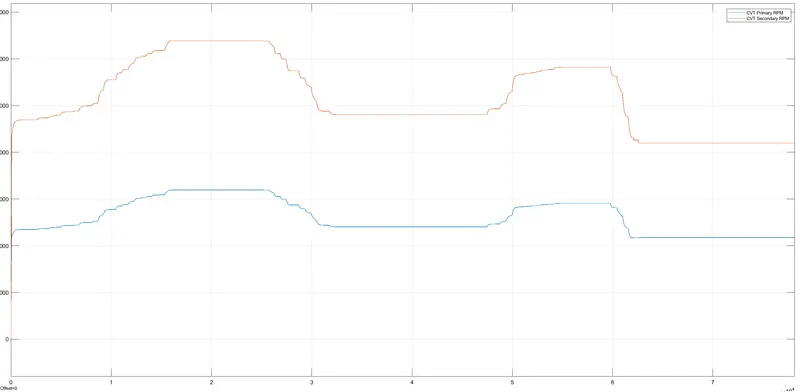
- When thorttle value increases speed increases which is met by an increase in secondary rpm ( rpm of driven shaft) and during uniform speed the CVT ratio doesnt change which can be seen via seondary and primary rpm remain constant during these periods.
- 4) Learning outcomes and Inference
- a) The quality of output of a simulation depends on type of input
- b) In real-time scenarios it is better to vary values in real-time than a signal builder input
- c) Lookup table makes output curves smoother. If the lookup table does not explicitly define the input values, Simulink helps by estimating an output value using interpolation, extrapolation, or rounding giving better quality results
- d) To achieve the desired output it is always good to use a feedback
- e) Dashboard elements help to provide instantaneous inputs
- f) As a throtle input increases there happens an increase in speed but the CVT ratio falls, when there is an increase in brake input the speed falls but there will be an increase in CVT ratio.
- d) Understanding of working of a CVT.