Project- 2 Thermal modeling of battery pack
AIM: To study the thermal modeling of the battery pack with the help of MatLab and Simulink.
Objectives: For a 10-cell series lithium-ion battery model, simulate the thermal effects and compare lifecycle performance at various temp, charge & discharge rates using Matlab and Simulink.
Blocks used in the model:
- Generic battery
- controlled current source
- solver configuration
- Bus selector
- Scope
- PS constant block
- Square wave generator
- Display
Main Block model working Explanation:
Generic battery
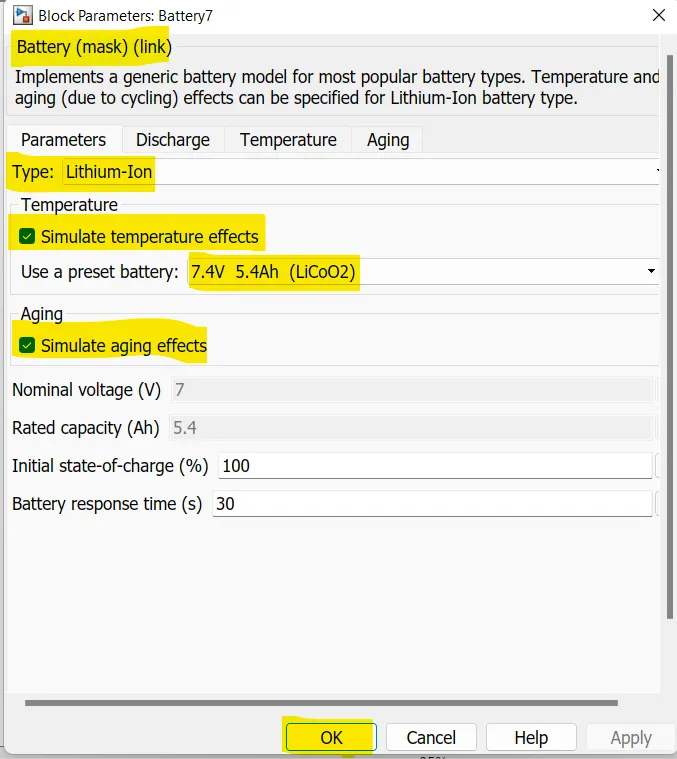
Implements a generic battery model for most popular battery types. Temperature and aging (due to cycling) effects can be specified for Lithium-Ion battery type.
Controlled current source:
Converts the Simulink input signal into an equivalent current source. The generated current is driven by the input signal of the block.
Square wave generator:
It generates the frequency wave with respect to time and amplitude.
Simulink model:
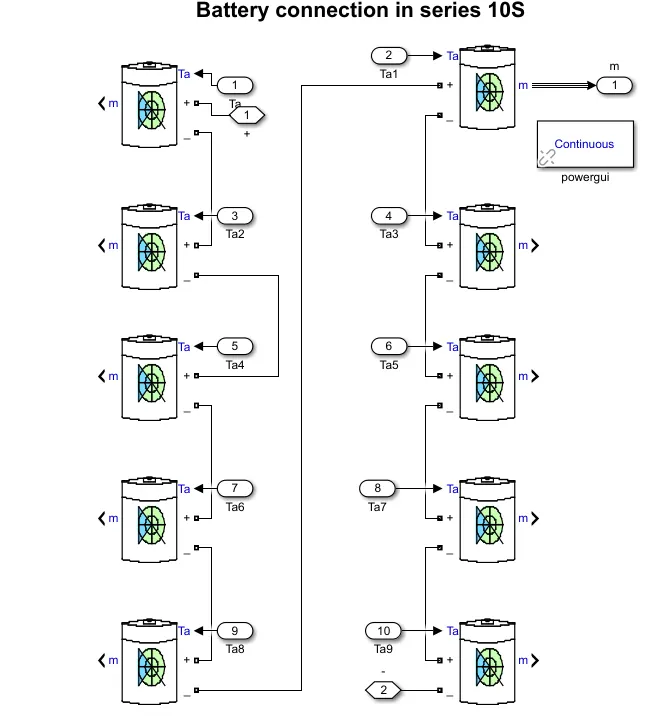
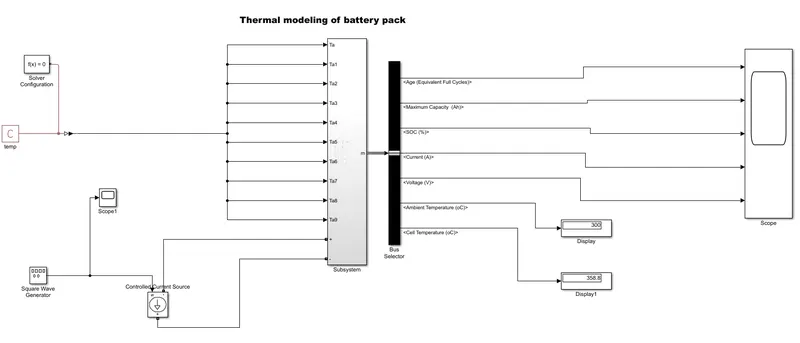
Model parameters:
Genric battery: In this block model I can select the battery type as lithium ions battery and select the simulate battery temp effects battery aging effects these parameters figure are mentioned below.
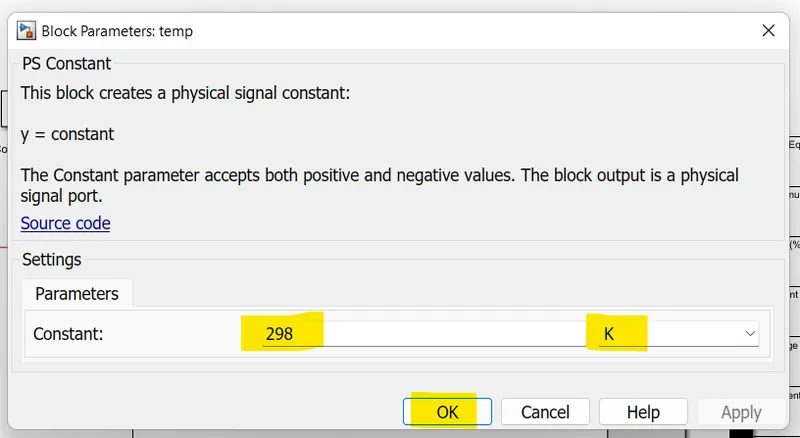
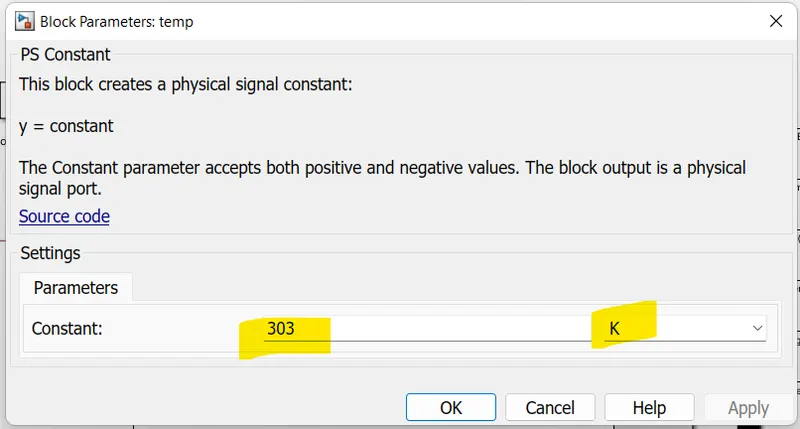
PS constant block: This block is used to give the temp to the battery pack at 298 kelvin then the parameter fig are mentioned below.
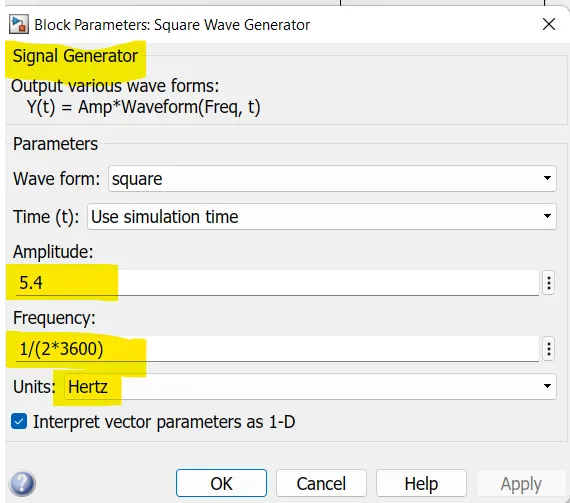
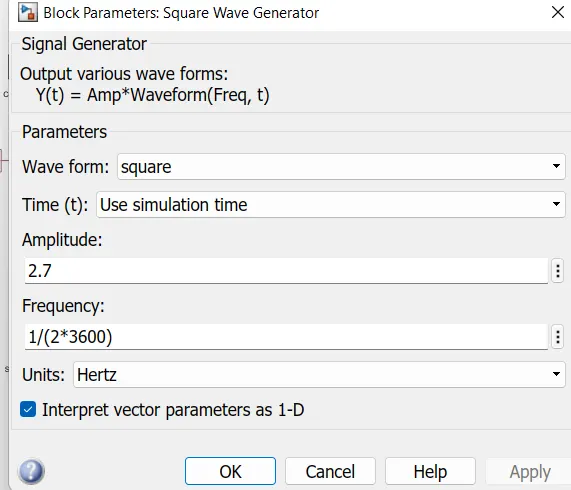
Square wave generator:When the square wave generator is also referred as signal generator, in that block I can select the frequency shape as square.and the amplitude as 5.4 and frequency as 1/(2*3600) which means when the battery capacity as as 5.4,1 is known as cycle & 2 is known as charge and discharge with respect to one hour which is 3600 seconds
Model Explanation:
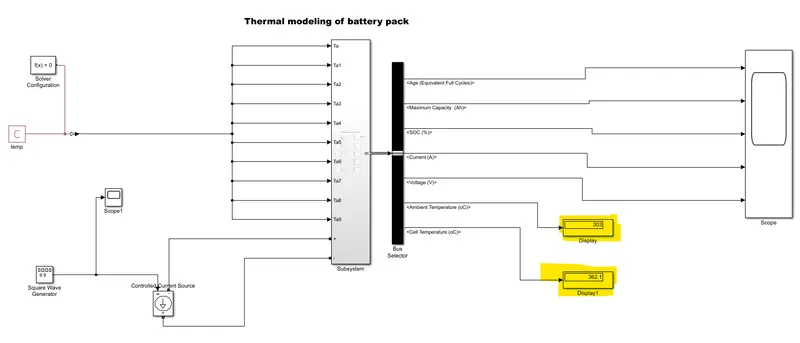
- First, I can use the generic battery and select the battery type of lithium-ion I'll try to connect the 10 batteries as a series connection model for the series connection model to connect the positive terminal to the negative terminal. and select all blocks and create the subsystem for that.
- When the battery model I can select the temperature and aging option so my battery wants inputs as temperature. so, that's why I can connect the PS constant block to the battery temp input, and give the temp for 298k to heat up the battery.
- When the positive and negative terminal of the battery can be connected to the controlled voltage source it's used to control the charge and discharge the current with respect to the demand. here I can use the square wave generator is used for the load condition of the battery.
- For the result analysis, I can use the bus selector can analyze the multiple outputs of SOC%, current, voltage, max capacity, and displayed in scope.
- The display block is used to show the final value temp of the battery pack.
Result Explanation: When the simulation time is run for 3600s*10 cycles at 1 C-rate at the temp at 298 kelvin.
Result Explanation:
- Plot-1 shows the life cycle of the battery pack which is around 190.
- Plot-2, We can see the current is fluctuating between +5.5 A to -5.5 A which indicates the charging and discharging of the battery.
- Plot-3 shows the max capacity of the battery, As we can see the capacity falls at almost 5.7 A W.R.T during the life cycle.
- Plot-4, Shows the voltage of the battery is around 16 volts as we can notice there is a slight fall for that condition voltage gets discharging.
- Plot-5, Shows the % of SOC initially the battery is fully charged and discharged almost 5%, and again it starts charging up to 100% depending on the given input.
- When the display we can see that the ambient temp we can give is 298 K but the cell temp is 356 which is around 2% increase of ambient temp.
During the temp of 303 kelvin
Scope output:
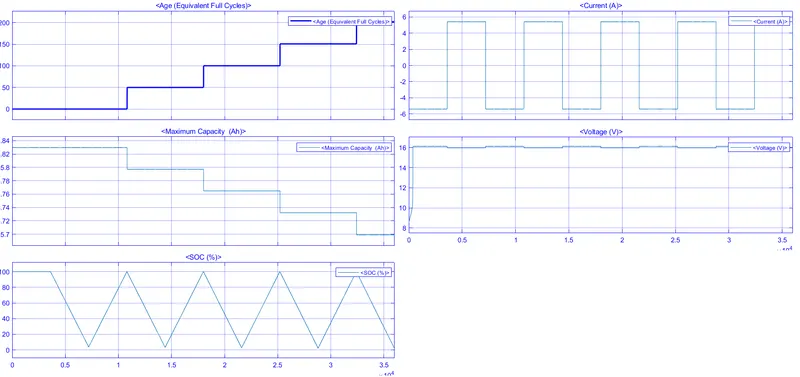
Result Explanation:
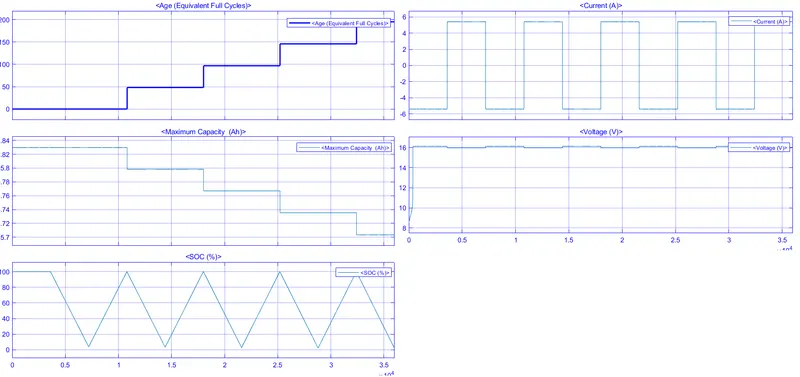
- Plot-1 shows the life cycle of the battery pack which is around 200.
- Plot-2, We can see the current is fluctuating between +5.5 A to -5.5 A which indicates the charging and discharging of the battery.
- Plot-3 shows the max capacity of the battery, As we can see the capacity falls at almost 5.6 A W.R.T during the life cycle.
- Plot-4, Shows the voltage of the battery is around 16 volts as we can notice there is a slight fall for that condition voltage gets discharging.
- Plot-5, Shows the % of SOC initially the battery is fully charged and discharged almost 3%, and again it starts charging up to 100% depending on the given input.
- When the display we can see that the ambient temp we can give is 303 K but the cell temp is 362.1 which is around 4% increase of ambient temp.
During the temp of 311 kelvin at the C-rate is 0.5:
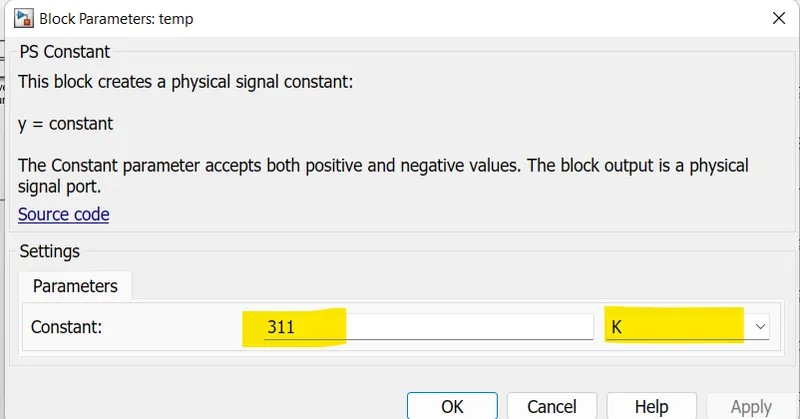
2.7 amplitude as 0.5 C-rate fig given below:
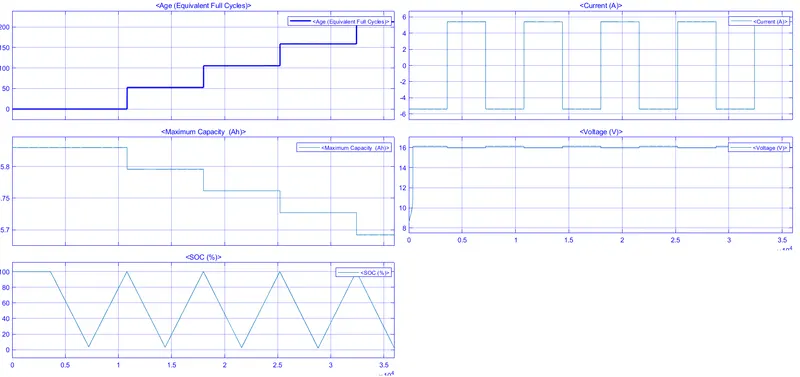
Result Explanation:
- Plot-1 shows the life cycle of the battery pack which is around 55.
- Plot-2, We can see the current is fluctuating between +2.7 A to -2.7 A which indicates the charging and discharging of the battery.
- Plot-3 shows the max capacity of the battery, As we can see the capacity falls at almost 5.77 A W.R.T during the life cycle.
- Plot-4, Shows the voltage of the battery is around 16 volts as we can notice there is a slight fall for that condition voltage gets discharging.
- Plot-5, Shows the % of SOC initially the battery is fully charged and discharged almost 53%, and again it starts charging up to 100% depending on the given input.
- When the display we can see that the ambient temp we can give is 311 K but the cell temp is 338.9 which is around 1.09% increase of ambient temp.
Conclusion:As per my simulation results
- The rise in temp increases the lifecycle of the battery pack.
- The maximum voltage falls down slightly and slowly depending on the rise in temp in both cases.
- Voltage remains the same in both cases.
- The current varies between positive and negative as per the c rate respectively.
- Ther is around 1-1.2 % Increases in the cell temp when compared to ambient temp.
- During 1 C rate, the soc battery is nearby zero but during 0.5C rate it is almost to 50%.