Week 7 State of charge estimation
Aim:
- To run the three test cases from the harness dashboard of closed-loop BMS control.
- To explain the coloumb counting for finding the soc estimation in BMS.
Introduction:1
Download the file and exact that the current version of matlab in my system R2020a and open the closed-loop BMS harness dashboard model.
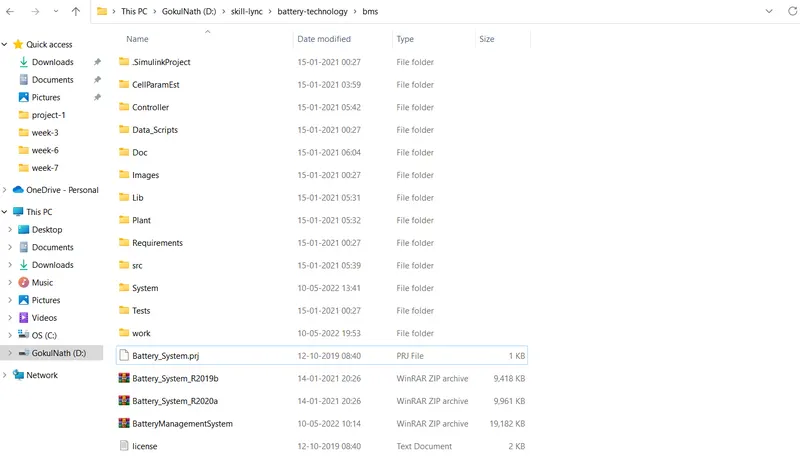
- Open the Matlab software and open the Simulink model file of the closed-loop BMS harness dashboard in test--> system-->--->BMS _closedloop_harness_dashboard model file.
- Then give open project and model in popo-up in the popup dialog box to install all the model-related library files into the current folder and workspace.
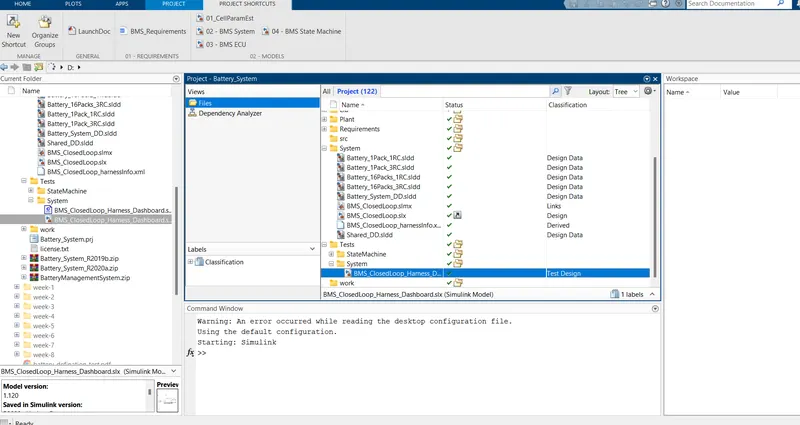
- After completing the model opening steps the model can be opened in the Simulink tool.
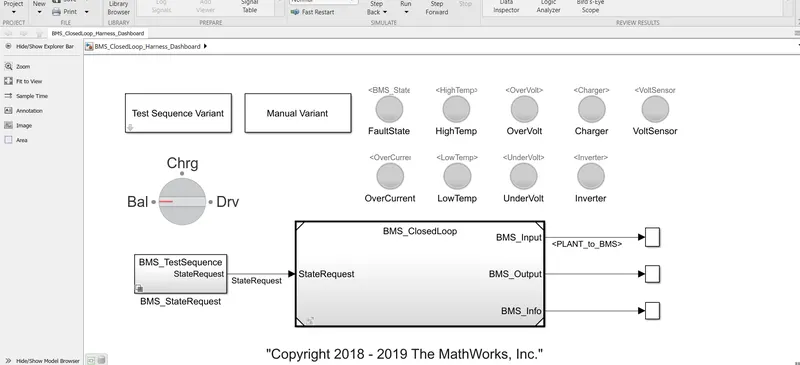
Blocks in the model:
- Test sequence variant (selector)
- manual variant (selector)
- BMS_Testsequence state request (subsystem) to provide state request command.
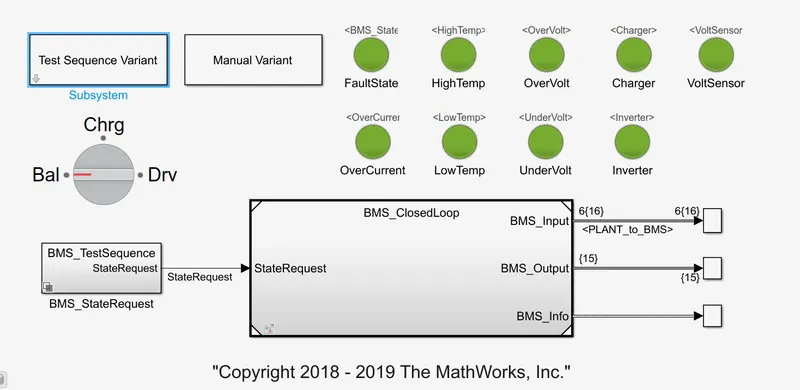
- Lamps to indicate fault state,high temperature,over-voltage,over-current,charging,voltage sensor operating , inverter operating,low temp,under-voltage,Undervoltage.if any fault in this red indication intimates us and all in good condition indicated by green indication.
- Rotating switch for manual variant changes while running simulation.
- In scope results, the soc of module, module current, individual cell voltage, individual cell temp, battery state, call balancing state are seen as outputs.
2. BMS_closed_loop;
- This main block consists of two subsystems,BMS ECU and PLANT units.
- The plant output from the plant is given as input to BMS ECU as BmS_inputvfeedback loop. The state request is given to the EMS ECU unit.
- The BMS output commands are given as input to the plant unit as 'From_BMS, also the state request is given to the plant unit.
- The final output from closed loop model are BMS_input,BMS_output,BMS_info.
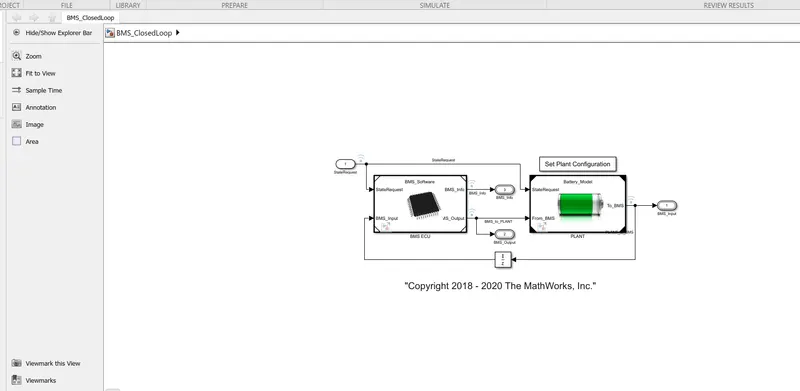
- In the BMS ECU unit the current power limited calculation are done used in state machine block,soc estimation,cell balancing logic.
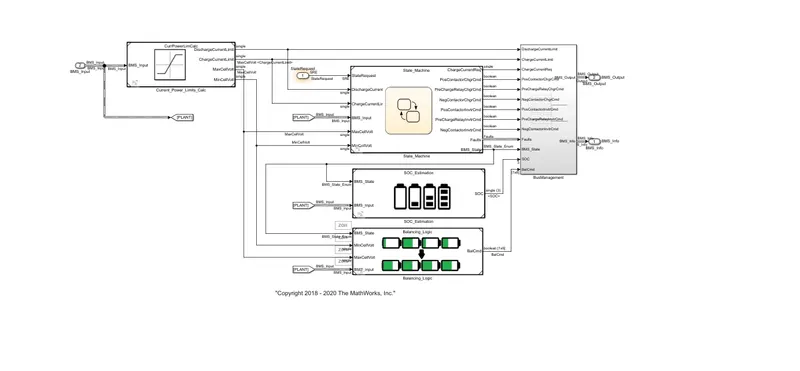
Objective:1 To run the three test cases from the harness dashboard of closed-loop BMS control.
We have test the three cases for this model byb selecting the varient test sequence & select the cases one by one as follow as
Test case-1
Select 1 from the test sequence varient dialogbox and click apply are shown in below,
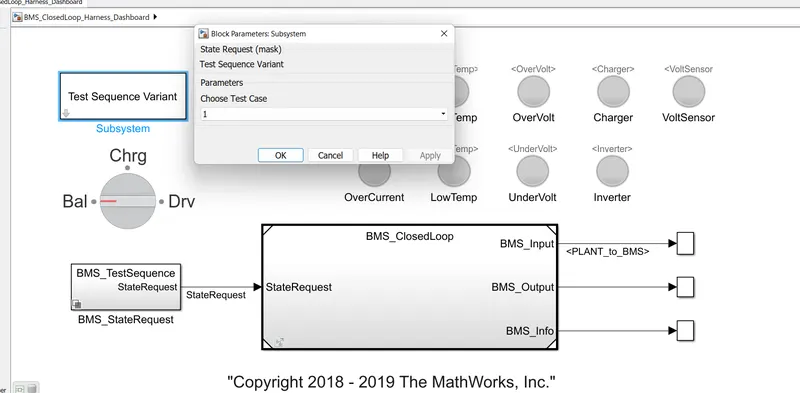
- This selection consist as selection changes in masked BMS_state request subsystem as
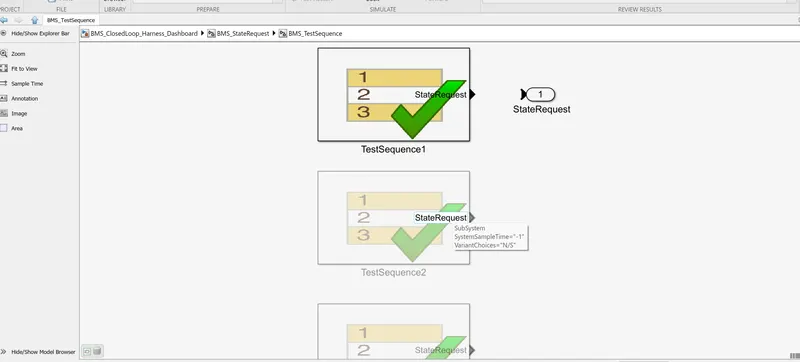
Here the above test sequence editor figure it was set as,
- Driving for first 3000 seconds.
- After 3000 seconds starts balancing operation occurs for the next 1000 sec.
- Then charging and balancing occurs for the next 5000 sec.
- After that sequence post charge balancing operation occurs till the end of the simulation period.
Result:
- The lamp indication are showing green for the overall simulation period showing that there are no faults occurring during the sequence.
Scope explanation:
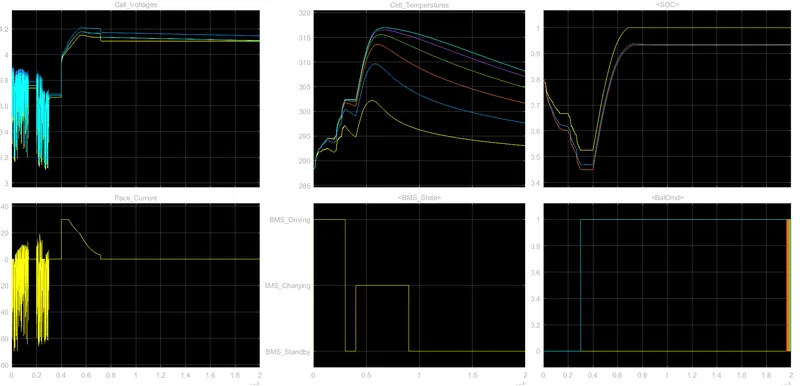
- For the first 3000 secs all 6 cells are in drive mode where discharging occurs majority and in stand by mode for lesser duration at approximately 1000 to 2000 second.
- The voltage varies from 3.1v (min) ti 3.0v(max) in this range.
- From 3000 secs to 4000 sec cell balancing occur and in this stage the module in standby mode and voltage is constant nearly 3.7V.
- After 4000 seconds charging occurs , voltage raised from 3.7 V to 4V.At 4V to 4.2 volt at constant current as nearly 30A to 2.6A.
- For first 3000 sec the battery module in driving mode.
- for first 3000 to 4000 sec the battery is balancing stand by mode
- After 3000 sec cell balancing start with on cell 6 and cell 2 as they raised since the voltage is higher then the cell voltage.
- After this state of charging and balancing are occur.
Test case:2
Select 2 from the test sequence varient dialogbox and click apply are shown in below,
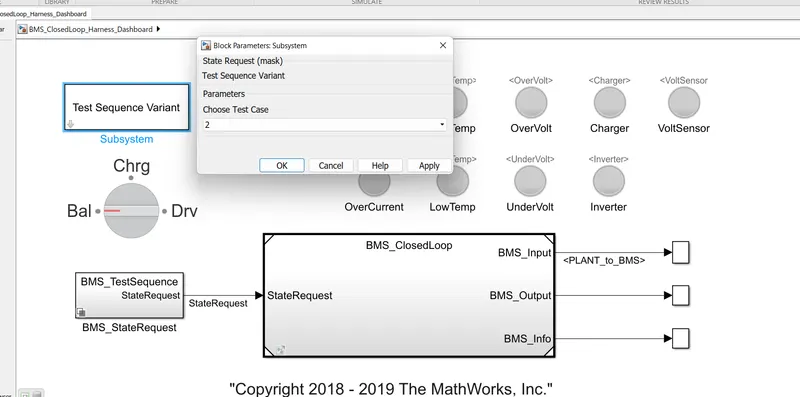
- This selection consist as selection changes in masked BMS_state request subsystem as
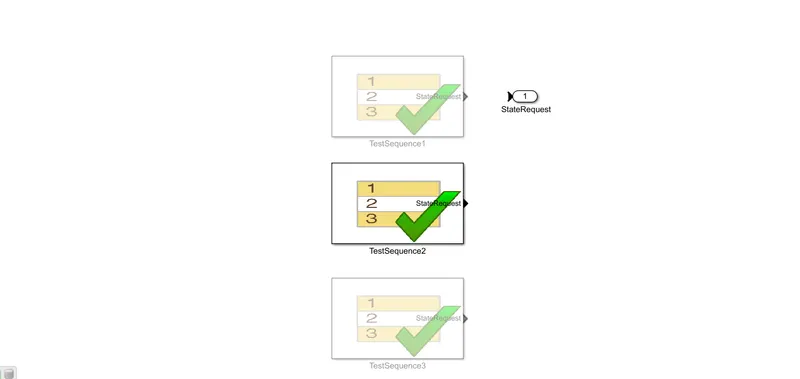
Result explanation:
- The lamp indication are showing green for the overall simulation period showing that there are no faults occurring during the sequence.
Scope results:
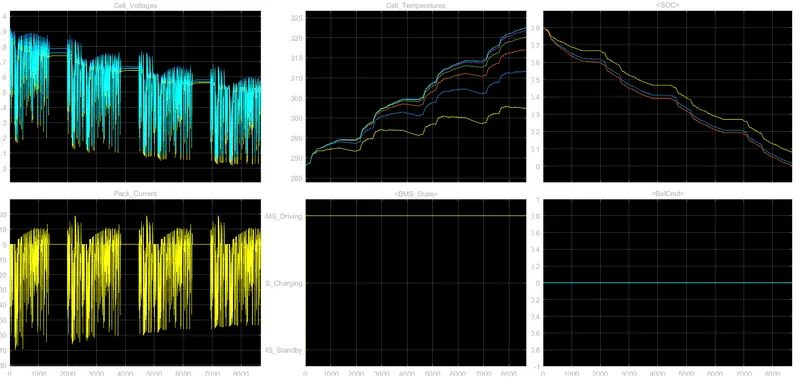
- Here this plot only driving mode can be performed.
- The voltage varies from max 3.9v and reduces to 3.5 V and cutoff voltage up to 9000-sec entire capacity drained at 9000 sec
- Here the SOC reduces from 80% to 0 % ( as the current drained for longer duration)
- Here the balancing cell is not performed.
Test case:3
Select 3 from the test sequence varient dialogbox and click apply are shown in below
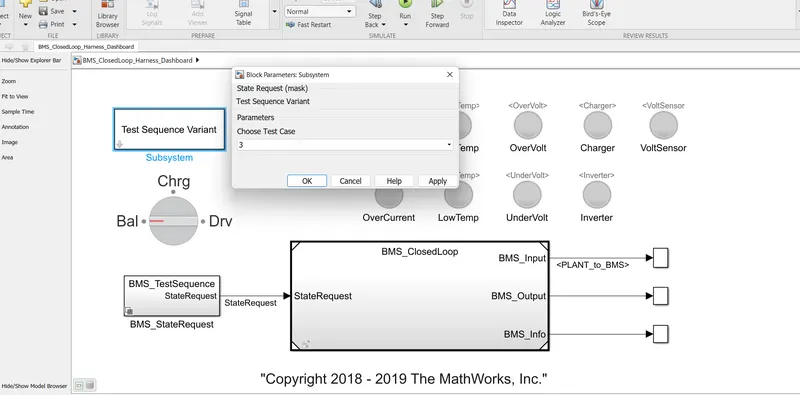
- This selection consist as selection changes in masked BMS_state request subsystem as
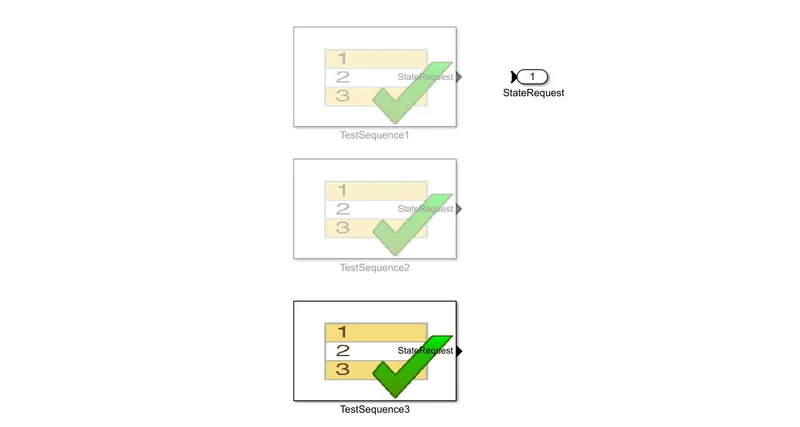
Result Explanation:
- The lamp indication are showing green for the overall simulation period showing that there are no faults occurring during the sequence.
Scope Explanation:
- Initially, cell two voltage rises from 3.9V to max 4.2 V and stability to 4.15 v.
- The pack SOC fully charged at 20000 second remains at fully charge for rest sequence.
- Here the cell balancing here from 0 sec of the cell and 2 start balance with respect of the cell and all are try balancing at end of simulation.
Objective-2 To explain about coloumb counting for find the SOC estimation in BMS.
Coloumb counting method:
It is one of the most used methods, However many other factors like temperature, application of battery, life Cycle of battery, fluctuation of battery voltage, etc, need to be considered along with the coulomb counting method to make a more accurate SoC calculation
State of charge SoC:
In simple words (The State of Charge) is your fuel gauge for battery-operated vehicles or E-vehicle. It is the real-time or actual capacity of the battery compared to its full capacity. Just like your cellphone battery, it is measured in terms of percentage (%). E.g., 100% SoC means the battery is fully charged to its capacity, and 0% SoC means it’s fully discharged.
Coulomb counting method
Mathematically integrated over the time formula to calculate estimated SOC by coulomb Counting is as below:
SoCt=SoCt-1+Ic(t)Qnt
Ic(t) ⇛ Discharging Current at Time t
SoCt ⇛ Estimated SoC at Time t
SoCt-1 ⇛ Previously Estimated SoC at t-1 or SoC value Given by Manufacturer
Qn ⇛ full battery capacity charges
△t ⇛ Difference in time
It is one of the most used methods, However many other factors like temperature, application of battery, life Cycle of battery, fluctuation of battery voltage, etc, need to be considered along with the coulomb counting method to make a more accurate SoC calculation.
SOC estimated in BMS model:
- To notice the model of the coloumb counting technique in BMS model click the subsystem of SOC estimation and click coloumb counting
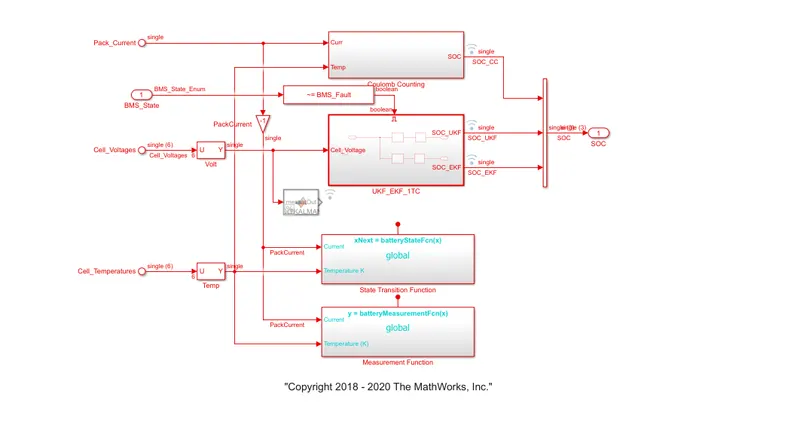
It is developed as shown below:
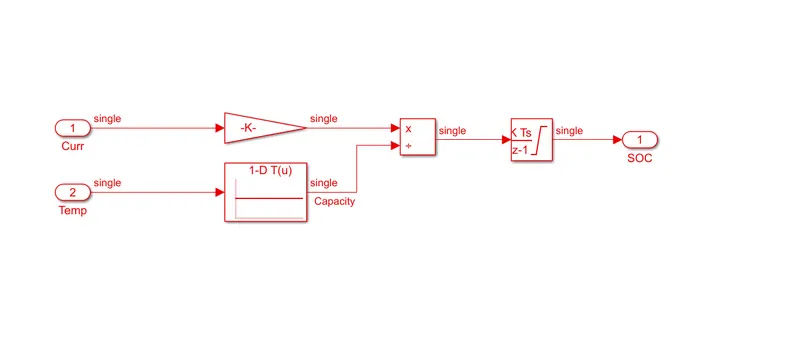
- Here the discharge current from battery given to gain with values as 1/3600 to convert the current to Ahr.
- The values is divided by by capacity due to temp range.then integrated with a gain value of 1 with sample time -1 as we using discrete the integrator.
- The saturation limits are from 0 to 1.
- We will get the SOC values from 0 to 1 multiplied with100 to get in percentage of SoC.