To implement the washing-machine and gear shift using stateflow.
Aim:
- To Implement control logic of a “washing machine” using Stateflow.
- To Make a Simulink chart for the “Gear shift” logic.
Objectives:
- In simulink i have implement a control logic of a washing machine using a state flow.Display the logic output using ramp block.
Introdution
The concept of state flow
- In an event driven system ,the system respond to the event by making a transition from one state to another state.
- The transition occur if the condition defining the change is true.
- MATLAB stateflow is a graphical representation of finite machine.
Explanation of implement control logic of a “washing machine” using Stateflow.
model:
Here model system logic of a washing machine using state flow.In this model i can run the run the wasingmachine as fully autometically with respect to time delay and indicates the working by using lamp.

Given Parameters:
- Soaking - 200 sec
- Washing - 100 sec
- Rinsing - 20 sec
- Drying - 50 sec
Model explanation:
Given input condition:
- If the power supply is available, the system gets activated
- If the Water supply is not available, stop the process & indicate through LED
- Soaking time should be 200s followed by Washing time of 100s.
- Then rinsing happens for next 20s & dryer runs for 50s
step-1:
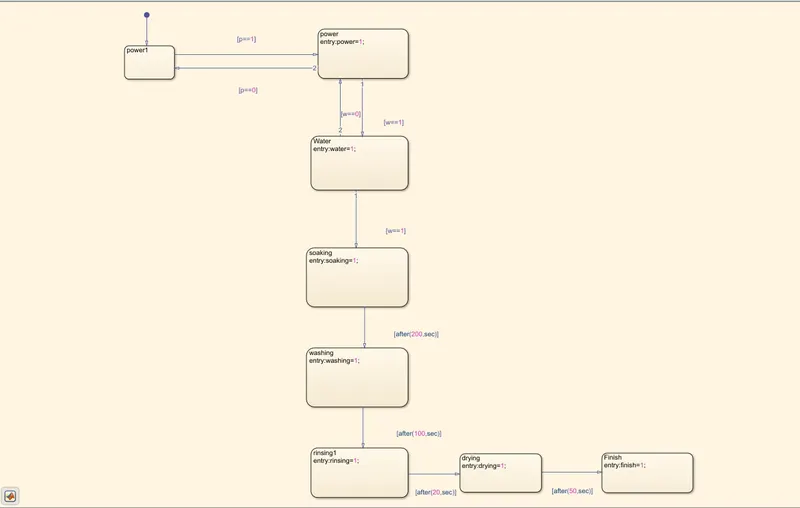
Goto simulink use chart block to create the flow chart by given inputs condition.so, in this flow chart my condition is When the is power is available it transit to the next state which is water available or not, if the water is available means its condition is true so transist to the next state which is soaking.Incase if water is not available means it didnt transfer its state because if the condition is false.after using of time delay the state flow will contineous.
Step-2:
After completation of input condition then using symbol pane option to assign the data of inputs and ouputs.
Important blocks & explanation of this model:
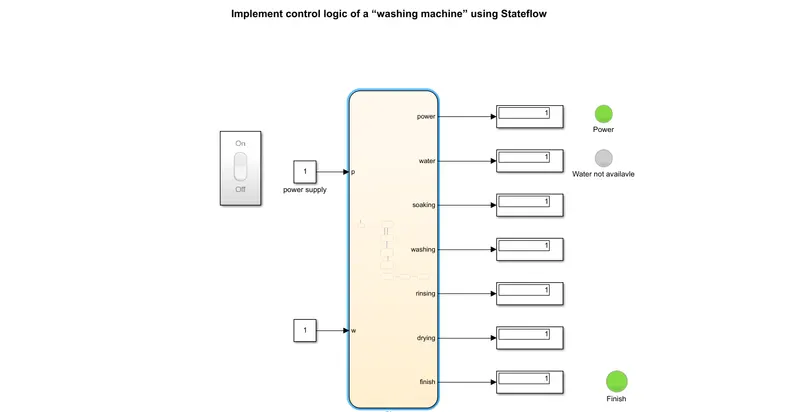
Rocker switch - It is block which available in simulink dashboard if we assign the values of switch on=1 & off=0.then connect it to the constant block,if i press the on buttion the if the rocker switch transmit the value of 1 to constant block then i'll press the off buttion the rocker switch transist the value of 0 to constant block.
Lamp - In this condition when lamp is used to show the signal for power is available or not & water is available or not & if the process is finished or not.
Power is available:
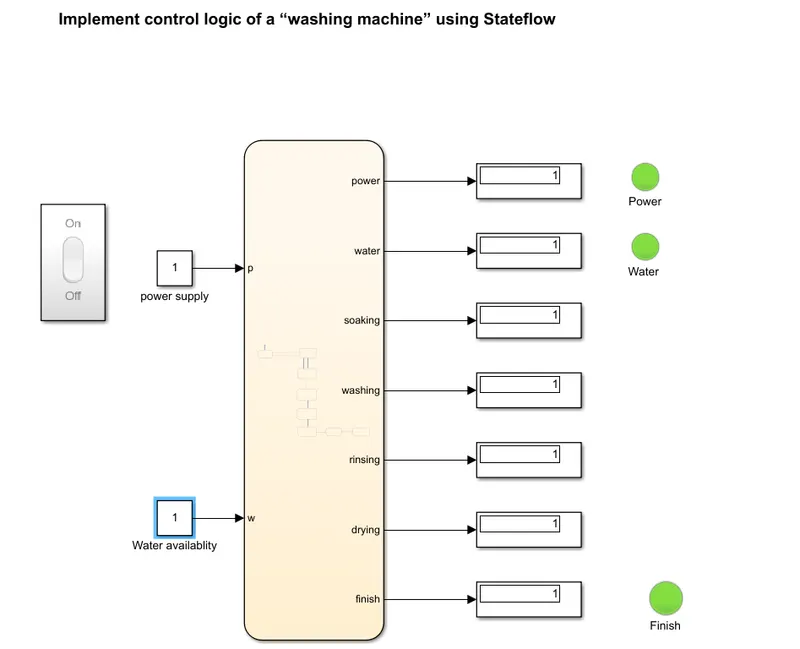
In this case when press the rocker button it transist the value 1 to the constant block - 1 now, power is available then the availablity of water input given by using constant block if constant block-2 shows value = 1 so water availalable,once i press the run the button the lamp indicates on green color and it indicates green color for water supply then the process completes in time delay once its finish its process then it indicates green color for finish .it happens because all of my condition is true and its transit the states and my lamp blink on green color as i mentioned in below figure.
If water is not available:
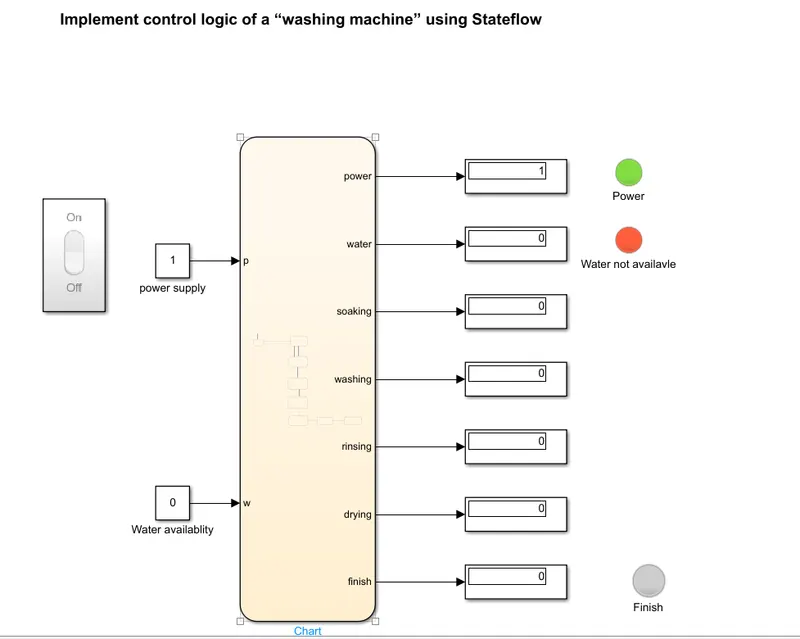
In this case i'll assign input as 0 to constant block now water is not available so the lamp indicates on Red color based on the system condition and state also stopped to transist as i mentioned the below figure.
Objective.2
Here model system logic To Make a Simulink chart for the “Gear shift”.In this i can change the vehicle gear automatically with respect to speed.
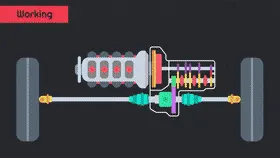
Given parameters:
speed Range(kmph) Gear
0 to 15 1
16 to 25 2
26 to 40 3
41 to 60 4
Above 61 5
Model explanation:
Goto simulink use chart block to create the flow chart by given inputs condition.so, in this flow chart my condition is when the speed is less then 0 its come to idle then the speed is increased more then 0 when gear 1 can assumed and the second state when the speed is increased more then 16 means its automatically moves the second gear and the sped is greater then 25 km/hrits automatically moves to the 3rd gear then the speed is more then 40 km/hr means its automatically select the 4th gear and finally when the speed is increased more 60 per/hr its automatcally move to 5th gear when the speed increased automatically it assumes its gear at the same time the is reduced means the gear also reduced with respect the speed and using the symbol line to assume the input and output.
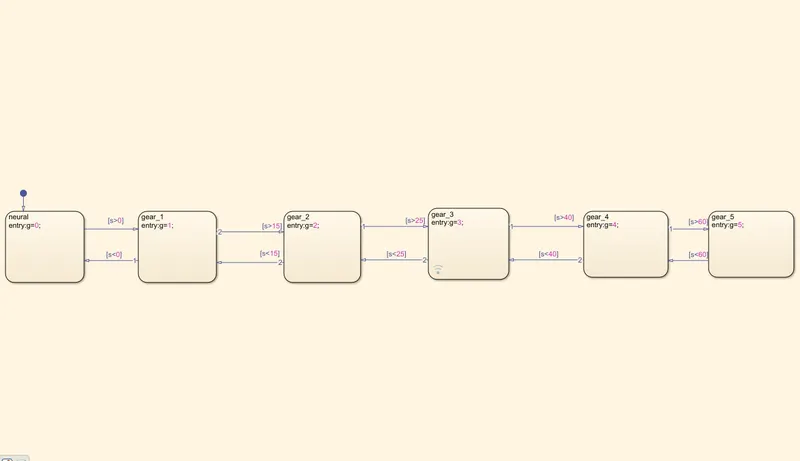
Block model:
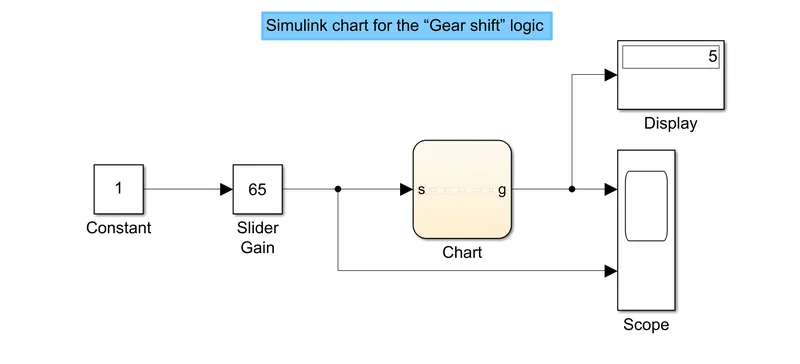
In this case i can adjust the speed with the help of slider gain block when the increases of speed its automatically changes its gear it can be shown in the display window.
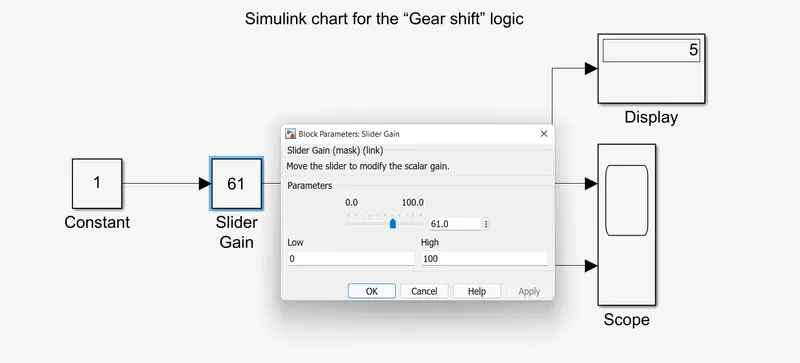
Important blocks used in this model
- slider gain
- scope
- constant block
- chart
Model explanation:
In this concept i can use the slider gain block to act as an speedometer,once i given the value for 0 to 100 km/hr then run the simulation then adjust the speed whlie using the gain slider block and the display shows the gear range with respect to change in speed.and scope is connected to the slider gain and gear output it execute the graphical interferance of change in speed and change in time.
output:
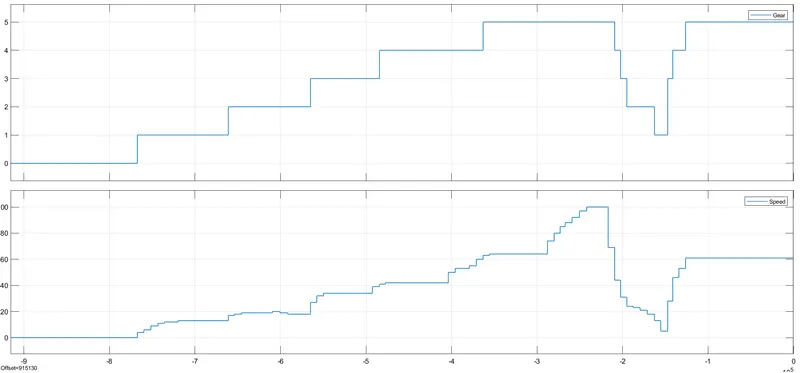
- In this case i have dispaly the two graphical interface using layout option in scope block for the first sub plot shows the gear range with respect to speed and the second sub-plot shows the change in speed which handled by user with the help of slider gain block
- In this graph its clearly shows the values for change in gears with respect to speed.