Week-3 Challenge: ADVISOR Tool
Aim:
- To study the FTP drive cycle of electric vehicles using the advisor tool.
- To study the battery capacity of the FTP drive cycle of electric vehicles using the advisor tool.
- To study the gradeability test with the PRIUS_Jpn_defaults_in file in Advisor tool.
Introduction:
Advisor tool in MATLAB:
ADVISOR, NREL's ADvanced VehIcle Simulator, is a set of model, data, and script text files for use with MATLAB and Simulink. It is designed for rapid analysis of the performance and fuel economy of conventional, electric, and hybrid vehicles.ADVISOR is a MATLAB/Simulink-based simulation program for rapid analysis of the performance and fuel economy of light and heavy-duty vehicles with conventional (gasoline/diesel), hybrid-electric, full-electric, and fuel cell powertrains.In this tool consist of a variety of drive cycles which are pre-defined in this tool but as per the given question I can use the FTP drive cycle to analyze the performance of the electric vehicle. We can also create our drive cycle and can get the result according to the drive cycle. There are some input parameters and kind of wheel drive. The input parameters are motor, torque, axle, and energy storage.
FTP Drive cycle:
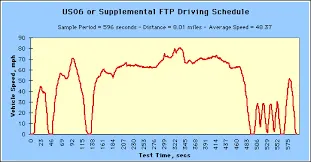
The EPA Federal Test Procedure, commonly known as FTP-75 for the city driving cycle, is a series of tests defined by the US Environmental Protection Agency (EPA) to measure tailpipe emissions and fuel economy of passenger cars (excluding light trucks and heavy-duty vehicles).
Theory.1 - For the EV_defaults_in file, if cargo mass is 500 kg with all other default conditions, can the vehicle travel for 45 km with an FTP drive cycle? Conclude your observations.
There are many numbers of default drive cycles available in the Advisor toll but in this case, I can use the FTP drive cycle as per the given question.
1- Open the Advisor tool select the units in metric format and click start to open the vehicle input in the advisor tool
2- After opening of the vehicle input page then select the EV_defaults_in file from the load file and click the file to open.
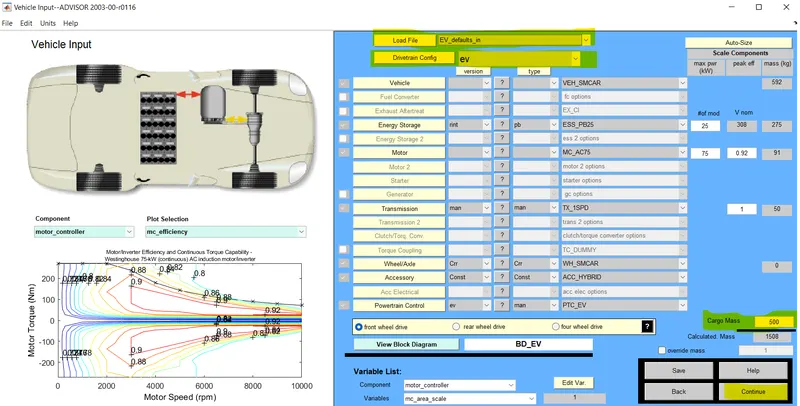
3- The vehicle input page shows the many parameters like (motor, transmission, generator, battery, axle, etc.) as default. so in this case I have to change the parameter for cargo mass from 136 to 500 and analyze the simulation. After updating the cargo mass parameters press continue to open the simulation page simulation parameters consisting of different drive cycles.
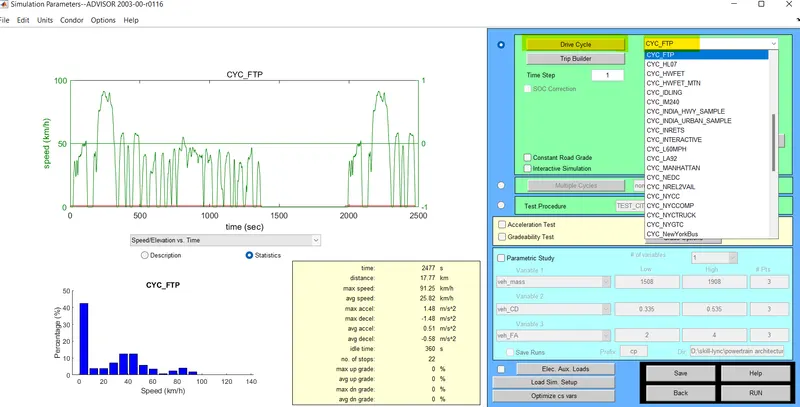
4. As per the given question run the vehicle using FTP drive cycle at 45km so I can select the 4 no's of FTP drive cycle, because each no of FTP drive cycles can runs only at 17.7 km so I can use 3 no's drive cycles to achieve the km of more then 45 .
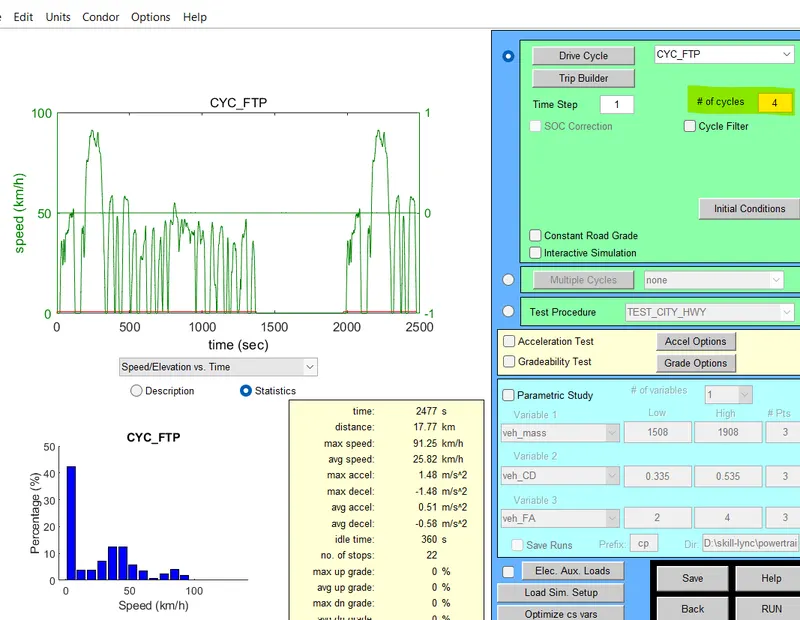
5. Now click the run to analyze the result:
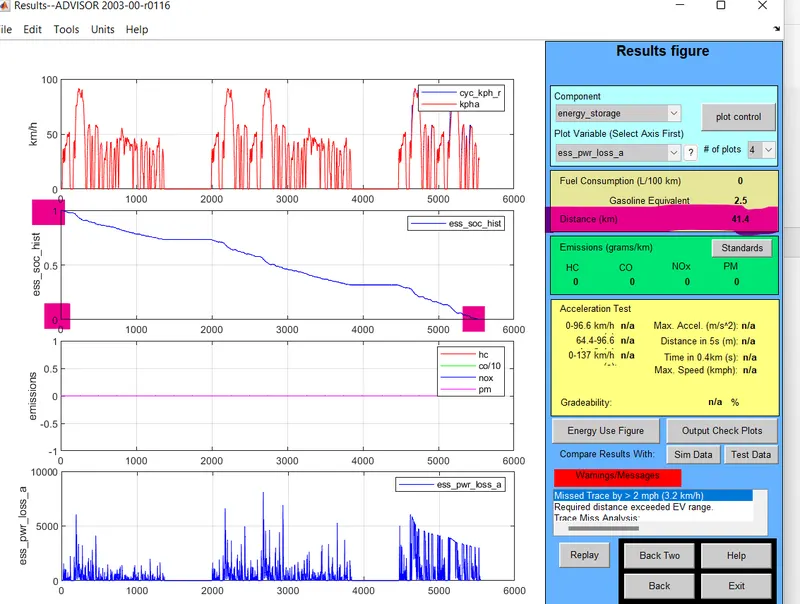
Result
- The simulation result can show 4 results that are (average speed, charge, emission, power loss)
- Avg speed: The vehicle can travel 96.6 km/ph.
- SOC: Battery charge can be reduced by the velocity of the vehicle it shows 100 % charge at 0 km and after travelling of 41 km the battery charge is 0%
- power loss:Power loss in battery due to acceleration of the vehicle.
Conclusion:
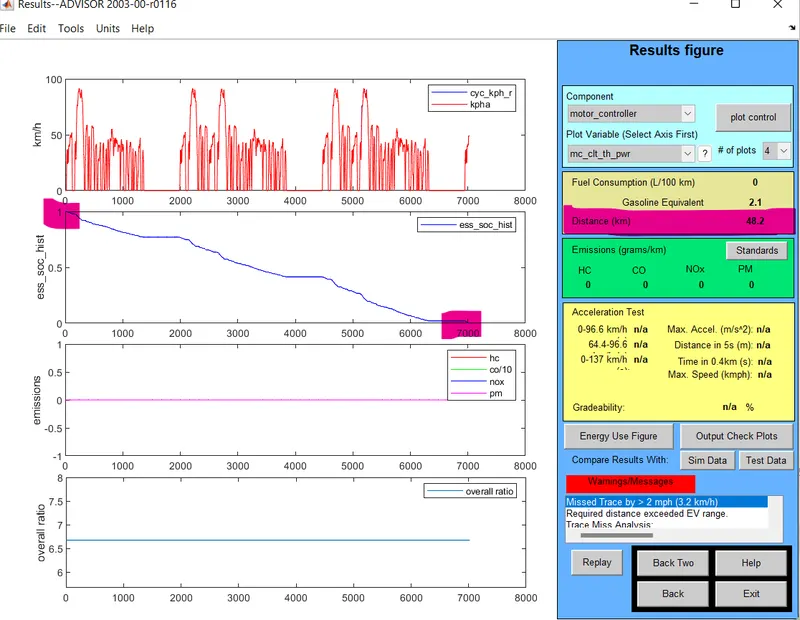
- By the default value of cargo mass load, 136 can travel up to 48 km as drive cycle by the cargo mass changed parameters can travel only 41 km. so when the load can increase the efficiency of the vehicle can decreases.
Theory 2: In the above case, try changing the battery capacity and repeat the simulation.
- As per the last result we get low efficiency due to increases in mass,now we have change the storage capacity with same cargo mass and analyze the simulation for that model.
1.select the vehicle of the V_defaults_in file and change the cargo mass to 500 and this time change the increase the storage parameters to conclude the efficiency.
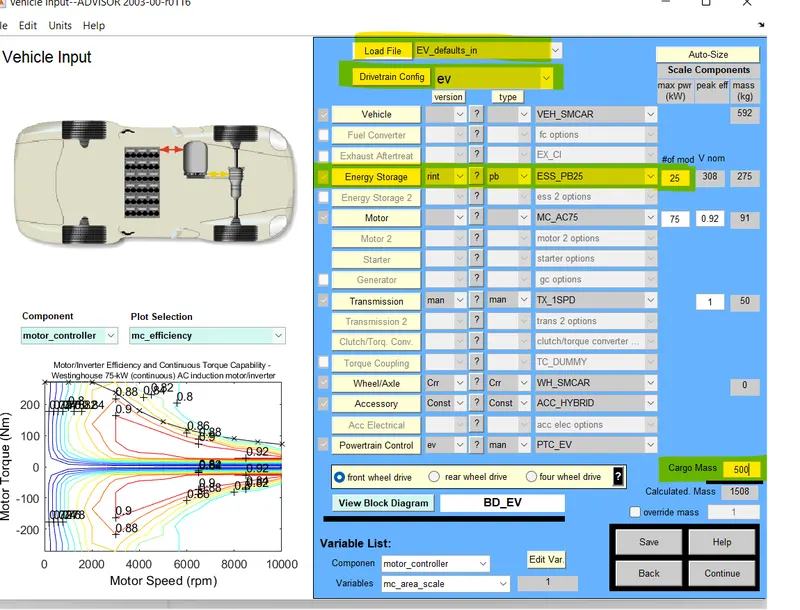
For these parameters, it is given a low efficiency so I have to change the storage capacity from 25 module to 30 module.
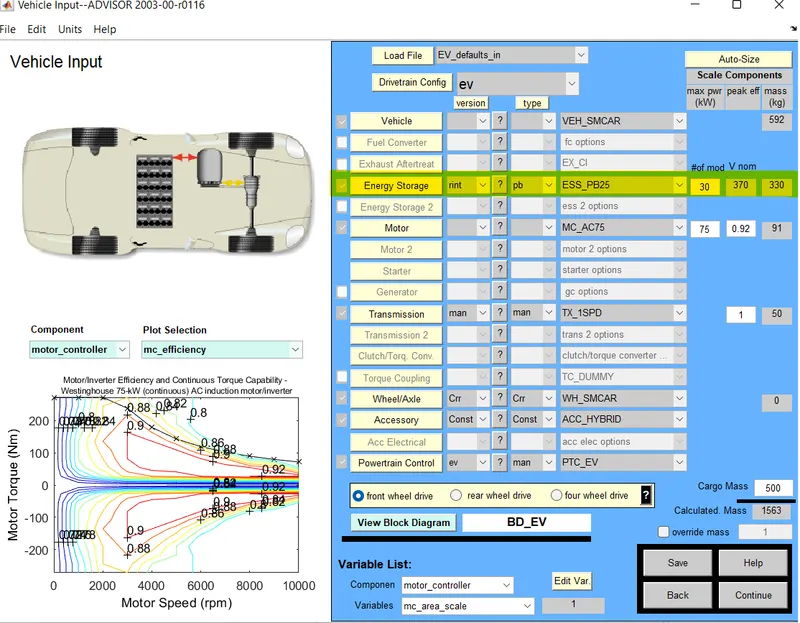
2.Now I have to change the storage capacity module from 25 to 30.after that click continue to select the FTP drive cycle and run it for more that 45 km.
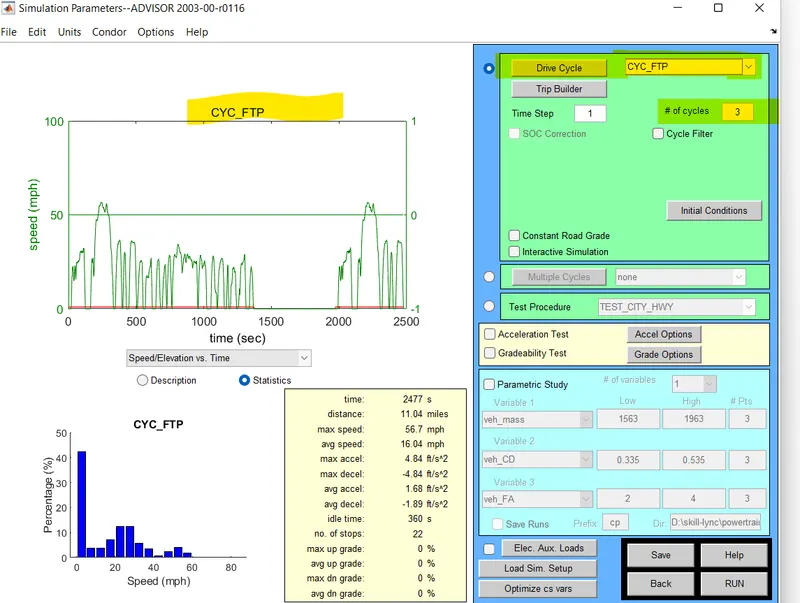
3.result
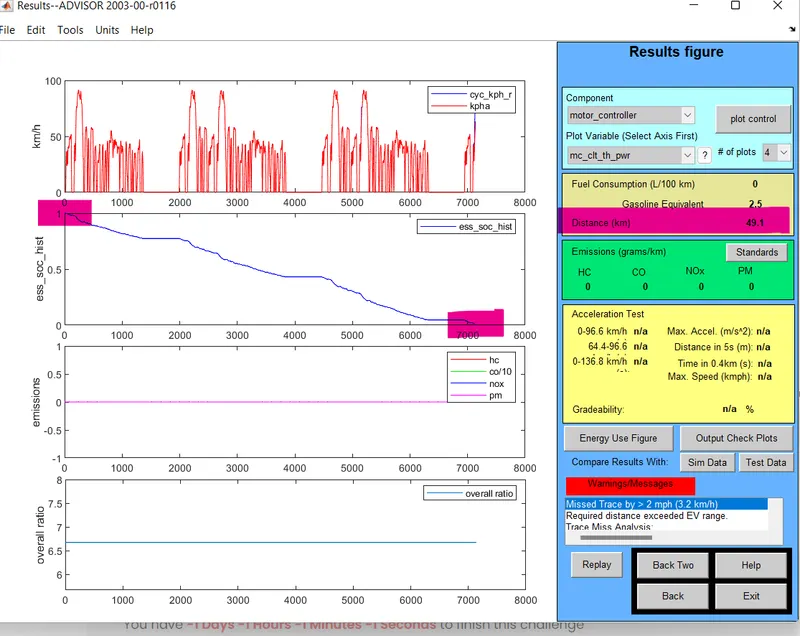
now the FTP drive cycle can travel at 49 km compared to the last efficiency this time efficiency can increase due to increases the storage parameters to tackle the load capacity.
Result explanation:
- As per the given result the max speed of the vehicle is 96.6 km.
- Compared to the last result the efficiency can increases now the vehicle can travel 41 km to 49 km for change in storage capacity.
- Based on the storage capacity it tends to increase the vehicle velocity
Conclusion:
If the cargo mass increases mean we need to model to increase the storage capacity That's one of the ways to achieve the efficiency of the vehicle and reduce the loss
Q.3: Perform gradeability test with PRIUS_Jpn_defaults_in file
Theory
A car's gradability is its ability to climb slopes. Gradability is measured either in degrees or percentage. A 45 degrees gradient is equivalent to 100 per cent. Gradability is dependent on engine power, drivetrain type, gear ratio, weight, weight distribution, car's centre of gravity and traction.
1. Open the advisor tool and click start to open the vehicle input in Advisor simulator,after that select the PRIUS_Jpn_defaults_in file in load file option.
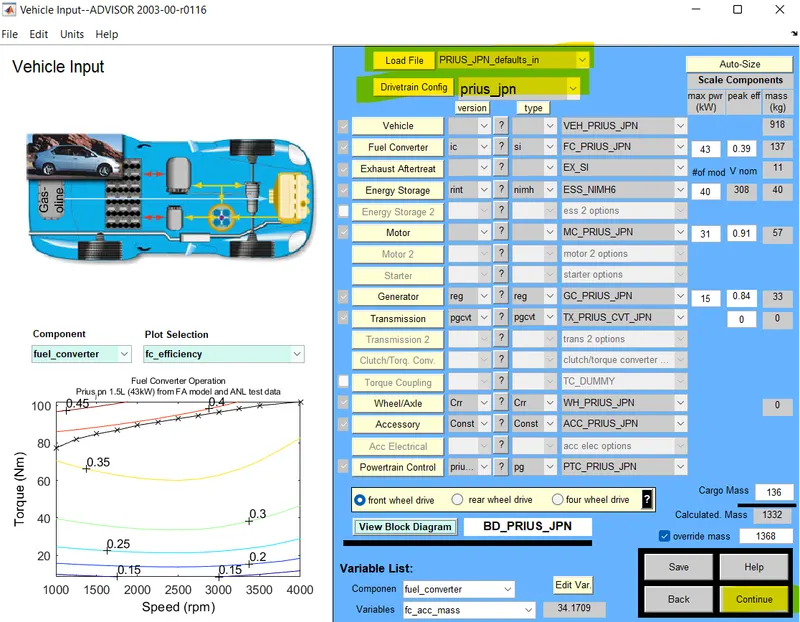
In the above fig shows the input parameters available from the tool and can be modify the mass value and other parameters like motor,generator,axle,etc based on out requirements .
2-Then click the continue to open the simulation parameters and select the drive cycle and gradeability.
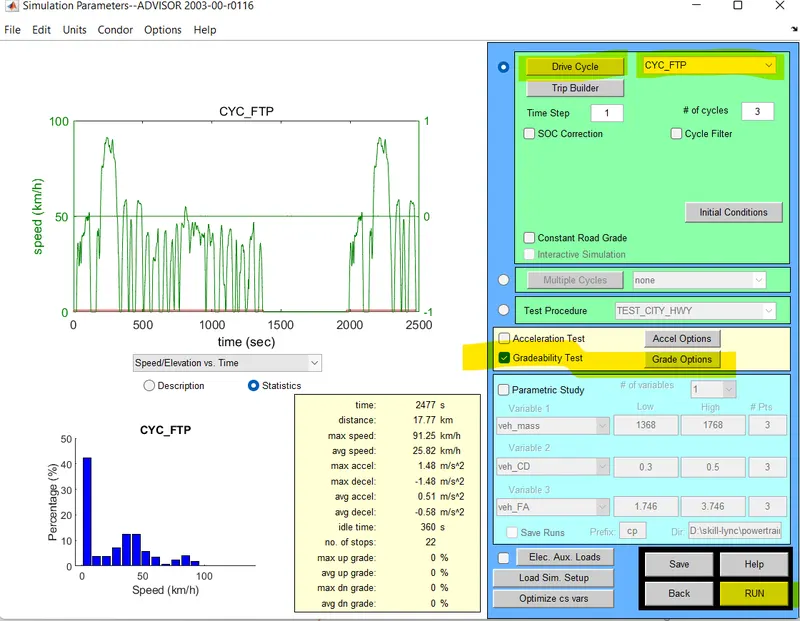
And select the drive cycle and to select the FTP drive cycle.and select the gradeability option to open that to change the speed as 55mph.and select the ok .and press the run button for simulation.
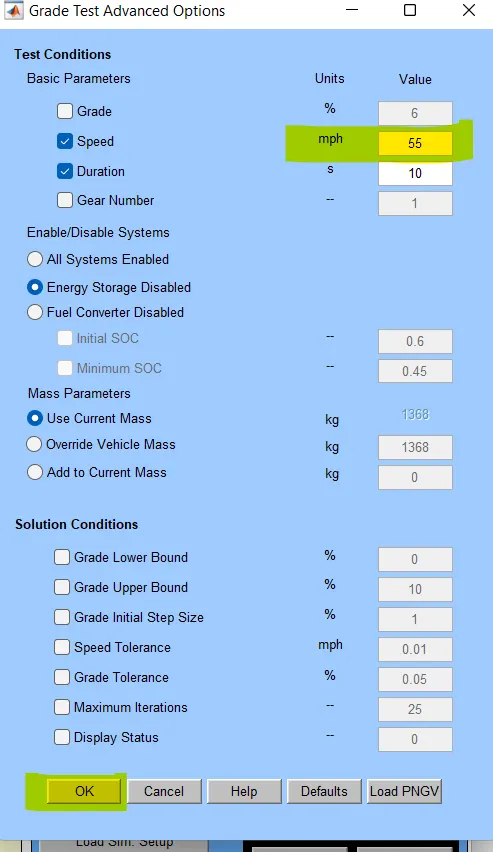
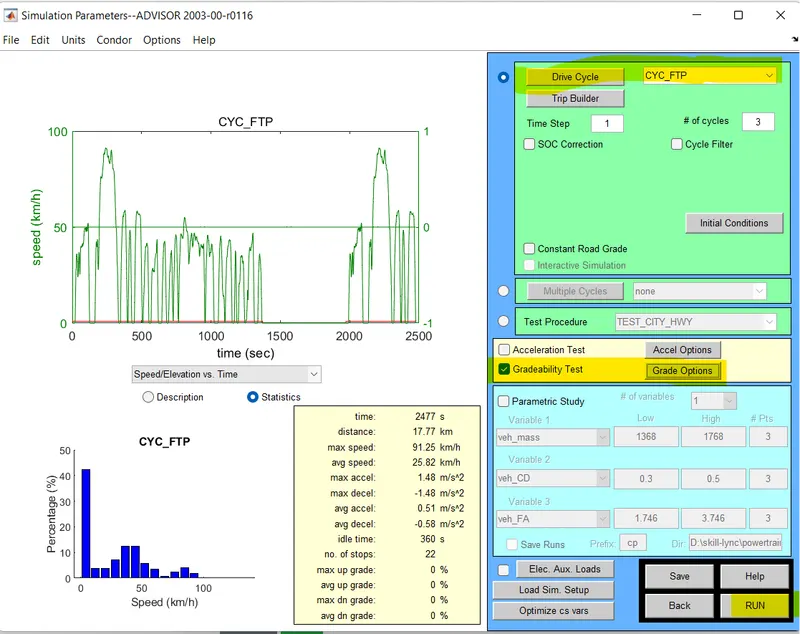
Now perform the gradeability test
After the simulation check the gradeability in the result page.Now the changing the value of the speed in grade option menu we get the gradeability percentage.
speed at 55 kmph which gives 8.9% of Gradbeality
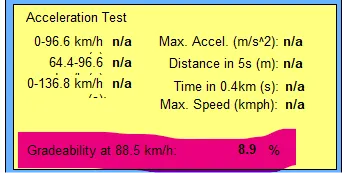
By changing the variation of speed in the gradeability option we may obtain different gradeability in the result.
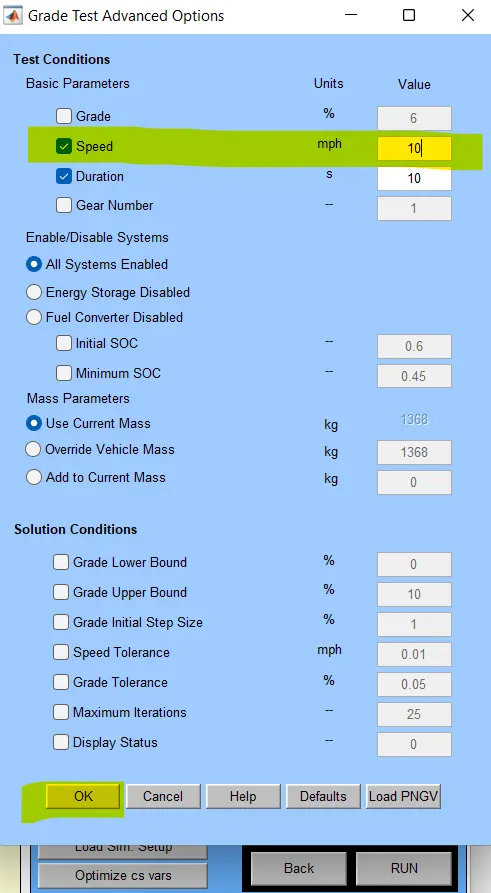

- By changing the speed of 10 kmph gradeability 30.3% at 16.1 km/ph
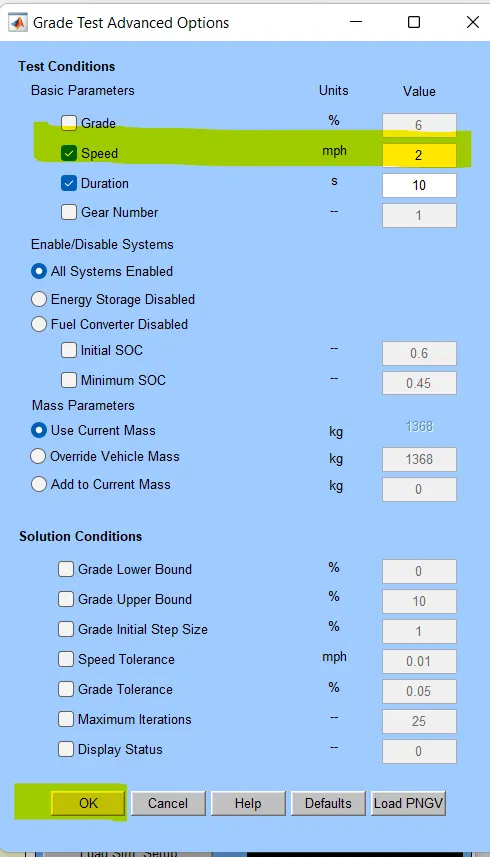

By changing the speed to 2km/ph the result in gradability is 31.8 % at 3.2 km/h
Result observation:
- if we increase the speed and reduce the torque means the gradeability % is less.
- At the same time if we reduce the speed means the gradeability % can increase.
- so speed and gradeability are inversely proportional to each other.