calculating the brake energy in EV required for this For the UDDS drive cycle.
Aim:
- To take udds driving cycle data and calculate the energy required for braking.
- To explain electric motor can’t develop braking torque at a high speed similar to starting? How electric and mechanical brakes are coordinated.
- To Make a MATLAB program that plots the contour of given motor speed, torque, and efficiency values. Attach the code as a .m file attach a screenshot of all the plots.
Objectives:1- To take udds driving cycle data and calculate the energy required for braking.
I can find out the braking energy by using the Matlab tool.
Brake energy formula-`1/2 (mass(velocity_i - velocity_f)`
matlab code:
clear all
close all
clc

% Given parameters and importing the given file
udds=xlsread('udds.xlsx'); % import udds data cycle
kerb_weight=2000; % assuming the mass parameters
pay_load=0.5*(2000); % assuming the mass parameters
total_mass=kerb_weight+pay_load; % assuming the total mass parameters
g=9.81; %acceleration due to gravity
time=udds(:,1); % taken the values of all row os first coloumn should be consider as time
velocity=udds(:,2); % taken the values of all row of second coloumn should be consider as velocity
speed=(velocity).*0.2778; % convert velocity kmph to mps
instan_braking_energy=zeros(1,length(time));

for i = 1:(length(velocity)-1) % creating the values if 1369 values for equation
if speed(i)>speed(i+1) % from the formula assign the statement as final value is always less then initial value
instan_braking_energy(i)=0.5*total_mass*0.001*(speed(i)).^2-(speed(i+1)).^2; % applying braking energy formula
end
end

% plotting

subplot(2,1,1)
plot(time,speed)
xlabel('time(sec)')
ylabel('velocity(m/s)')
title('UDDS CYCLE')
subplot(2,1,2)
plot(time,instan_braking_energy)
xlabel('time(sec)')
ylabel('braking_energy')
title('udds braking energy data')
Code explanation:
Line:(1-15)- To import the udds drive cycle data using xlsread command after that providing the parameters of total mass acceleration due to gravity. when the data consist of 2 columns so I can take all row of the first column as time and all rows of the second column as velocity.my velocity value should be kmph to convert m/s and give the name as speed.
line:(16-20)-Created the loop with respect to the length of time and make a statement for the final value is always less the initial value once the statement was true means applying the formula.
line:(24-33)-after that plotting the brake energy result.
Result:
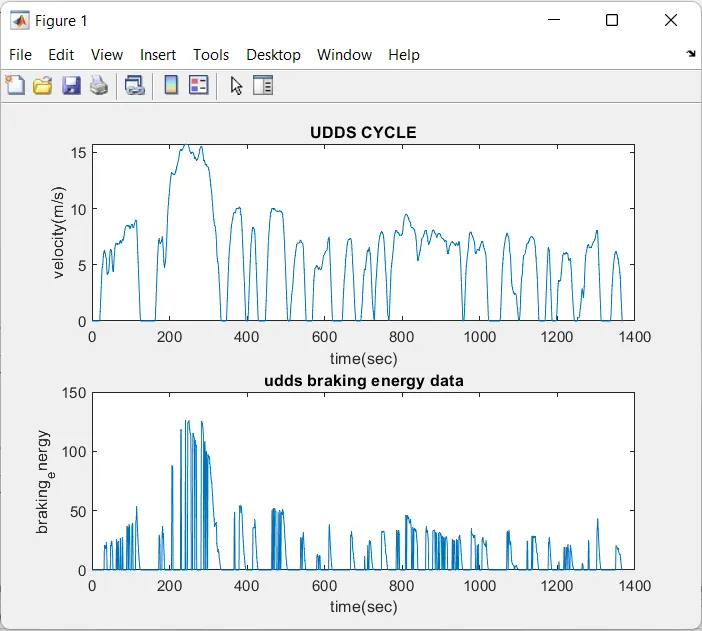
- This result, it displays the values of the drive cycle and the breaking energy generated in the fall on deacceleration.
objective:2 - To explain electric motor can’t develop braking torque at a high speed similar to starting? How electric and mechanical brakes are coordinated.
Braking torque of an electric motor cannot be developed at a higher speed due to the following:
- As the motor running at a rated speed when the vehicle speed increases beyond the rated speed the torque decreases and cannot attain the required brake torque demand as it was given at starting speed.
- So, the electric motor cannot develop braking torque at higher speed because wheel lockup can happen which is not recommended and it is harmful to the vehicle.
- In such a situation, a mechanical brake can be assigned to reach the required brake torque demand.so there will need both electrical and mechanical braking at high speed.
- In that situation, mechanical breaking can assist to reach the required brake torque demend.so,there will need for both electrical braking and mechanical braking at high speed.
- At starting of motor draws a large current due to tracncient.as the torque is proportional to the square of the current,therefore torque value is also high at the starting of the motor.when the vehicle is running at high speed we apply brakes at the time current value is less therefore torque value also less.
Torque speed characteristic:
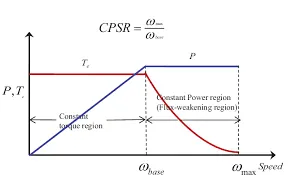
Motor torque characteristic:
- The rated torque of the machine. This is the design operating point.
- The start torque of the machine, when the machine is at standstill.
- The maximum torque or pull-out torque occurs at the slip s=spo">s=spos=spo. Once a machine has reached the rated operating point, this is the maximum torque that can be applied without stalling the machine (pulling out). In reality, since this torque is significantly more than the design-rated torque, operation at maximum torque is not possible due to thermal heating issues. (Currents will be above rated values, and I2R">I2RI2R losses will be excessive.)
- τpu">τpuτpu. The pull-up torque of the machine. In some machines, the lowest point on the torque-speed curve between starting and pullout is not the start torque. In this case, it is important to know the pull-up torque. This is the minimum torque that the motor can accelerate up to the desired operating speed.
In steady-state operation, an induction motor will operate at the speed where the mechanical load torque equals the torque developed by the motor. At low speeds, the difference between the motor torque and the load torque accelerates the machine. Normal operation is to the right of the maximum torque (s<spo)">(s<spo)(s<spo). In this region, an increase in the load torque will cause the motor to slow, increasing the motor torque until an equilibrium is reached. To the left of the pullout torque, no such equilibrium can be reached. Mechanically,
objective-3 Make a MATLAB program that plots the contour of given motor speed, torque, and efficiency values. Attach the code as a .m file attach a screenshot of all the plots.
The efficiency of a motor is determined by intrinsic losses that can be reduced only by changes in motor design. Intrinsic losses are of two types: fixed losses - independent of motor load, and variable losses - dependent on load. Fixed losses consist of magnetic core losses and friction and windage losses. Magnetic core losses (sometimes called iron losses) consist of eddy current and hysteresis losses in the stator.
They vary with the core material and geometry and with input voltage. Friction and windage losses are caused by friction in the bearings of the motor and aerodynamic losses associated with the ventilation fan and other rotating parts. Variable losses consist of resistance losses in the stator and in the rotor and miscellaneous stray losses. Resistance to current flow in the stator and rotor result in heat generation that is
proportional to the resistance of the material and the square of the current (I2)
Constant losses:
Constant losses are those losses that are considered to remain constant over the normal working range of an induction motor. The fixed losses can be easily obtained by performing a no-load test on the three-phase induction motor. These losses are further classified as-
- Iron or core losses,
- Mechanical losses,
- Brush friction losses.

Matlab code
clear all
close all
clc

% Input parameters
velocity=linspace(0,1000); % assuming velocity rad/sec
torque=linspace(0,300);    % assuming torque values n-m
c_l=0.18;                  % copper loss parameters
i_l=0.006;                 % iron loss parameters
w_l=0.00015;               % windage loss
m_l=20;                    % motor loss

% calculation
[A,B]=meshgrid(velocity,torque); % vector form values conver into matrix form

% power calculation
p_output=(A.*B); % power=torque * velocity
p_c=(B.^2)*c_l; % copper loss
p_i=A.*i_l;   % iron loss
p_w=(A.^3)*w_l; % windage loss
p_input=p_output+p_c+p_i+p_w+m_l; % total input

% efficiency calculation
efficiency=(p_output)./p_input; % overall efficiency

% setting the efficiency now which the values can be plotted
N=linspace(0.7,0.95,10);

% plotting
figure(1)
box off
grid off
contourf(A,B,efficiency,N)
colorbar
title('torque speed efficiency contour of an induction motor')
xlabel('rotor speed in rpm')
ylabel('induced torque in N-m')
zlabel('motor efficiency')
saveas(figure(1),'speed-torque')
Code explanation:
- In this program I can take the value of torque and speed values using linspace command.
- Then the motor constant values has been assigned as copper loss, iron loss, winded loss, motor losses can be assumed,
- The mesh grid command is used to changing the 2 d arrays into 3d array
- Output power is calculated by product torque and speed
- Once we add all the losses we got the input values now we have input and output values the formula for efficiency is output/input
Result:
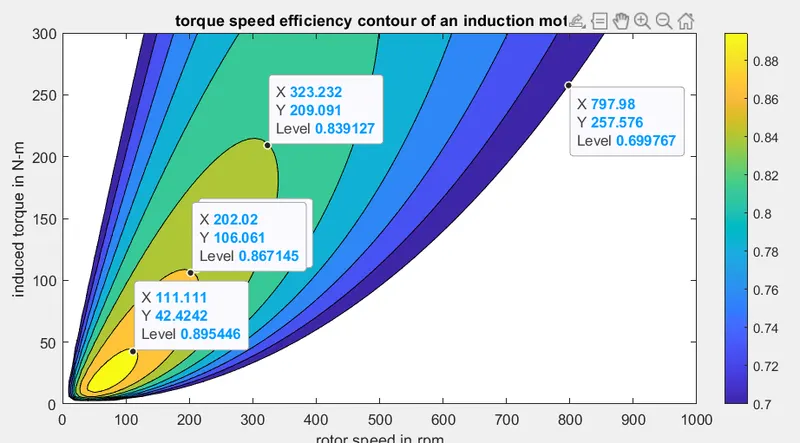
Result Explanation:
Here the best efficiency is achieved by the bottom of the contour image.
Conclusion:
- For the drive cycle day to fine the brake energy required for braking has been calculated.
- To explain the fundamentals of why regenerative braking not working at high speed.
- Using matlab script to find the torque speed efficiency of the motor.