Assignment 6
Crash Analysis
A crash simulation is a virtual recreation of a destructive crash test of a car or a highway guard rail system using a computer simulation to examine the level of safety of the car and its occupants. Crash simulations are used by automakers during CAE analysis for crashworthiness in the CAD process of modeling new cars. During a crash simulation, the kinetic energy, or energy of motion, that a vehicle has before the impact is transformed into deformation energy, mostly by plastic deformation of the car body material (body in white), at the end of the impact. Data obtained from a crash simulation indicate the capability of the car body or guard rail structure to protect the vehicle occupants during a collision against injury.
- Frontal-impact tests: which is what most people initially think of when asked about a crash test. Vehicles usually impact a solid concrete wall at a specified speed, but these can also be vehicles impacting vehicle tests.
Objective
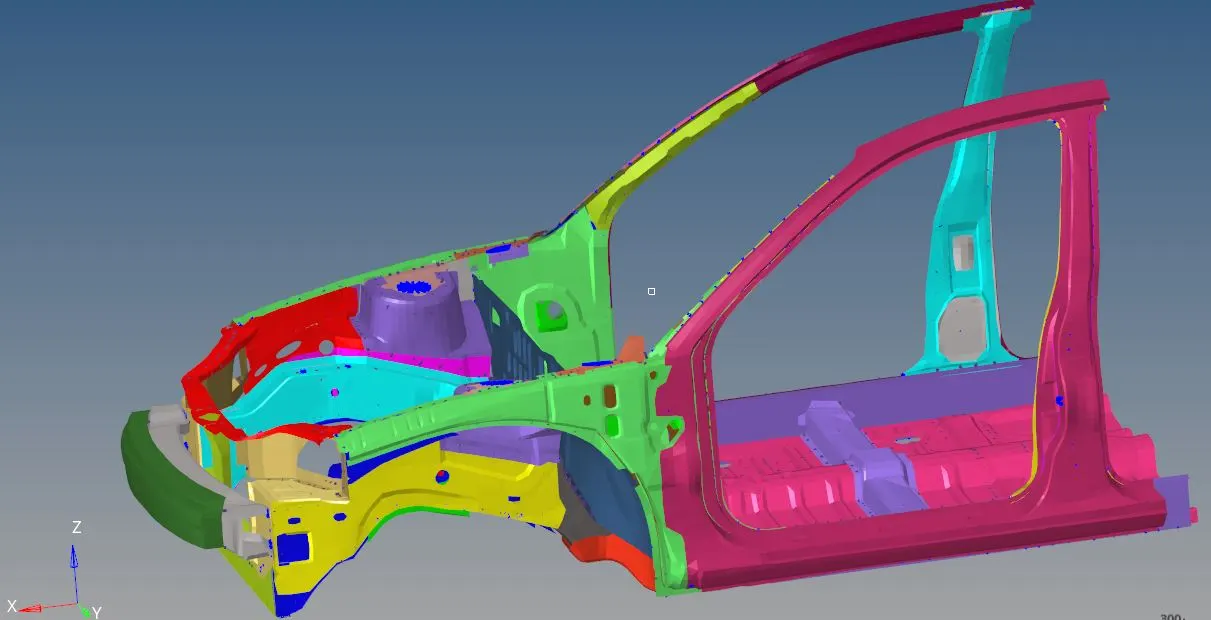
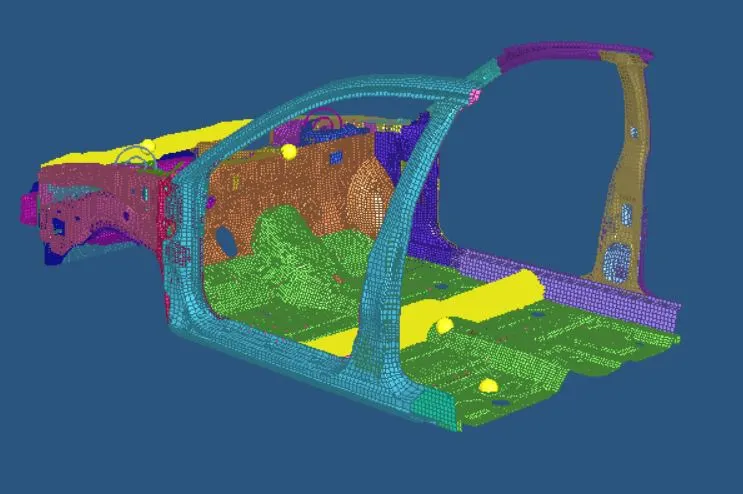
The project aims to perform the frontal crash analysis of a neon BIW model on the rigid wall. The preprocessing is done in the Hypermesh and analysis is done in Radioss solver and the results are interpreted using Hyperview and Hypergraph.
Task
To calculate the below:
- Sectional force in the rails at the location of indicated node 174247.
- The axial force received on the rails from the bumper.
- Shotgun cross-sectional forces.
- A pillar cross-section.
- Acceleration curve received on the accelerometer at the base of B pillar (on B pillar rocker).
- Intrusions on the dash wall 66695,66244.
Procedure
- The rad file of the reduced car model is imported.
- The unit system is length(mm), time(ms), mass(kg), force(kN), velocity(mm/ms)

Crash Impact Application
Type 7 - A general-purpose interface & can simulate all types of impact between a set of nodes and a master node.
Type 11 - Simulation of impact between edge to edge contact application.
Type 24 - Simulation of impact between the surface to surface contact application.
Import Interface parameters
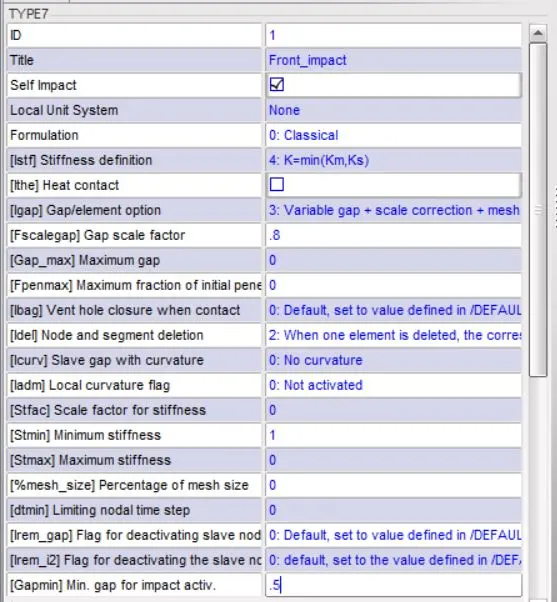
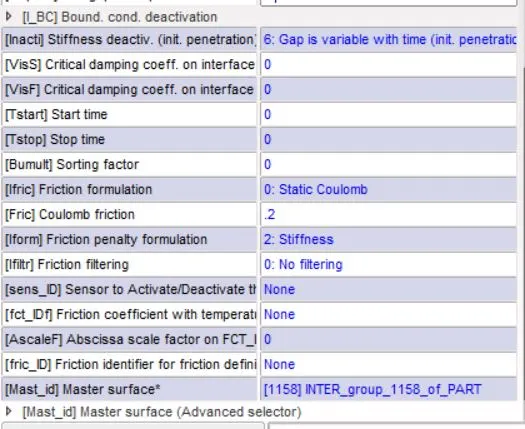
Igap - Determines how the size of the gap is calculated.
Gapmin - It specifies the minimum thickness of the model to avoid numerical issues.
Inacti - Check for the penetration of the elements & removes initial penetration in the model.
Istf - The provide the stiffness of the interface based on the master & slave.
Iform - Sliding forces are computed using the stiffness parameter of the interface.
Stmin - Minimum stiffness to use for the interface.
Idel - It deletes the element if it fails.
- The type 7 interface is used since it can simulate all types of impact between a set of nodes & master nodes. In hypercrash under contact interface --> new --> Multi usage (type 7) and recommended parameters and friction 0.2 is set.
Type 7 Parameters
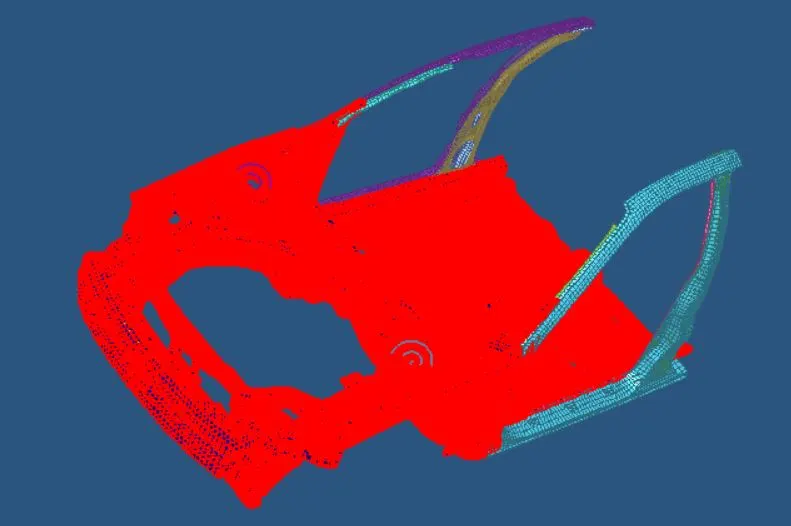
- The penetration of the model is checked using Quality --> check all solver contact interface and penetration of the model is zero.
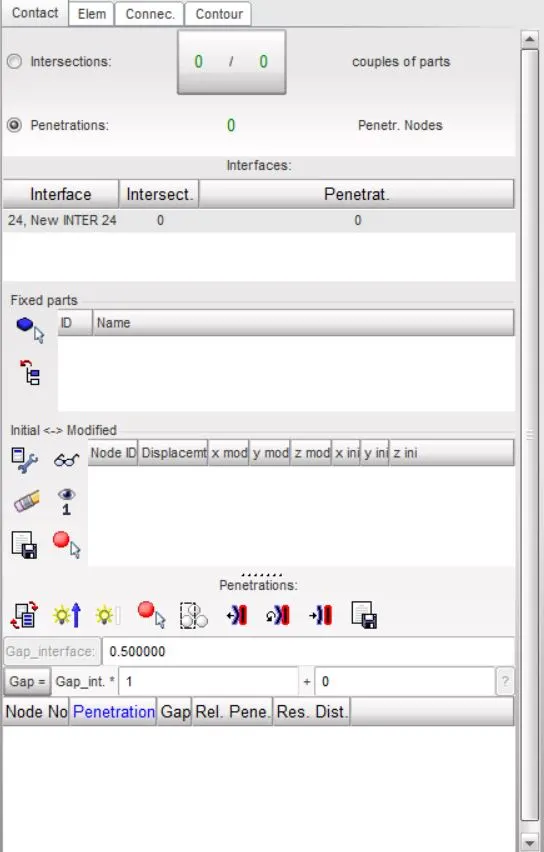
Penetration check
- The rigid wall with friction 0.1 is created. The Rigid wall is used for the analysis of the crash test against the wall.
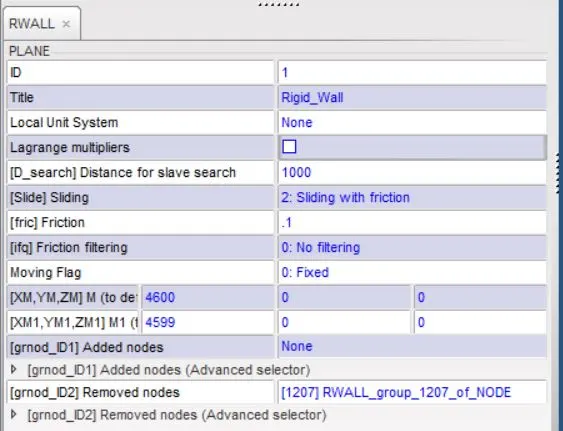
Rigid wall parameters
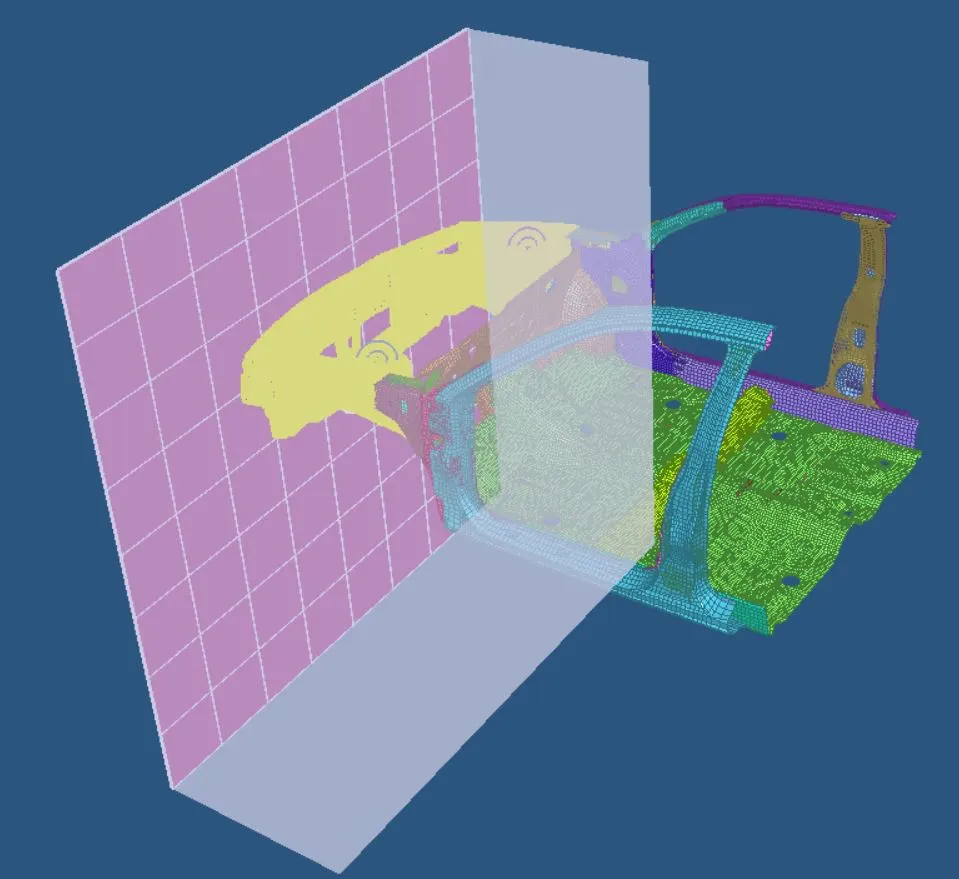
Rigid Wall
- The reduced model is used and impact analysis rotates about its center of gravity so the total mass of the reduced & full model must be the same so the few mass are added to the model. The load case --> add mass option is used to add the mass on the model.
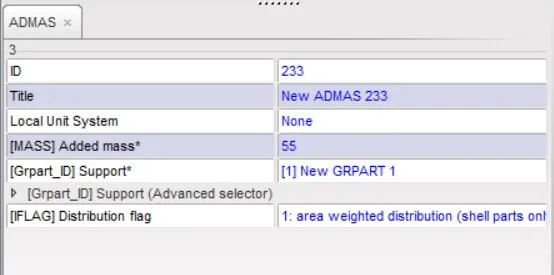
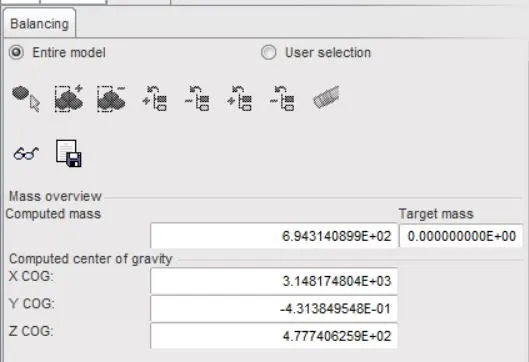
- Mass --> balancing option is used to calculate the COG of the model.
- Initial velocity is set using load case --> Initial velocity. Select the type as translation & provide the X velocity as 15.6 mm/ms.
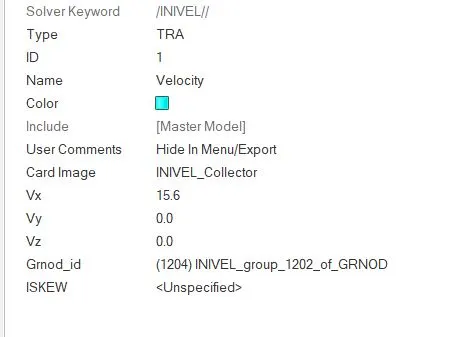
Initial Velocity parameters
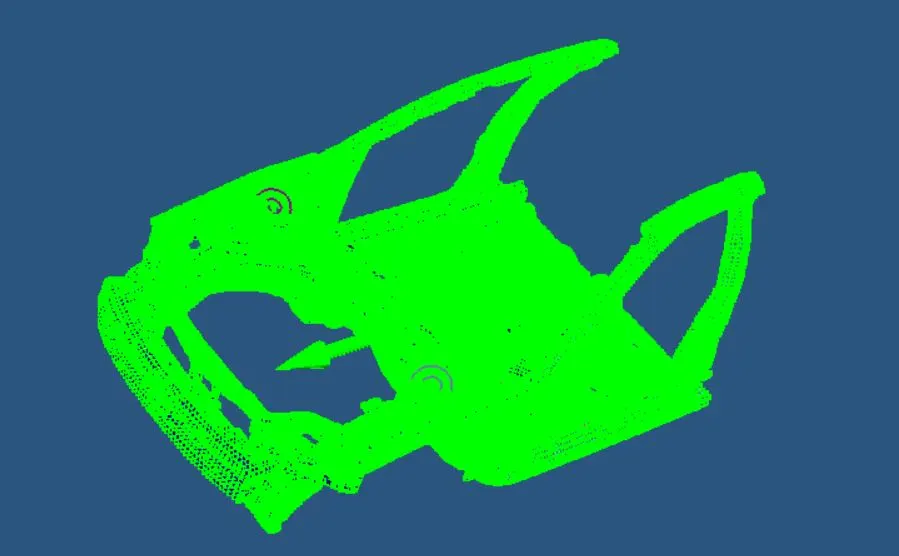
The green arrow indicates the velocity direction along the x-axis.
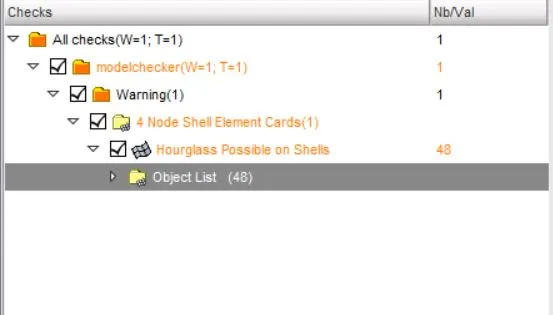
- Use model checker to ensure good quality. The errors are selected & the run option is used for the automatic correction of the errors in the model.
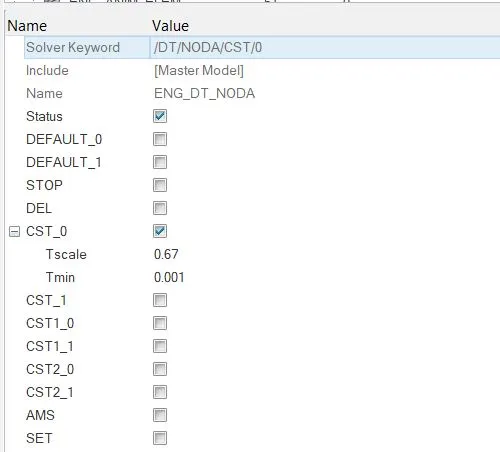
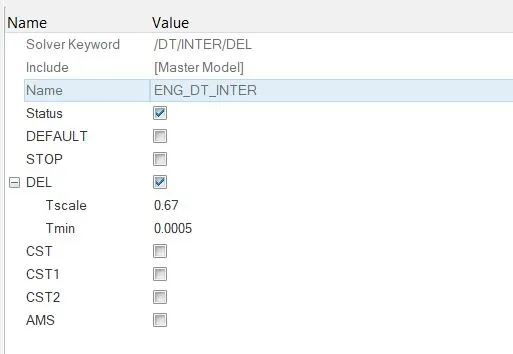
- Timestep :0.5 to 0.1 microseconds.
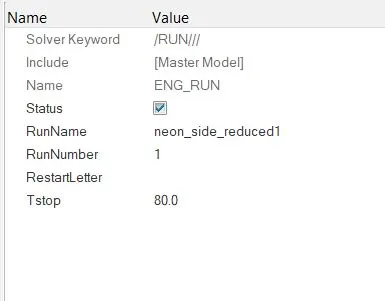
- The simulation is run for 80 ms.
Output Request
A local frame of reference is created in the cross member & the time history TH card is created and sectional force in the rails, axial force in the bumper, shotgun cross-sectional forces, A-pillar cross-section, Acceleration curve at the base of B pillar.
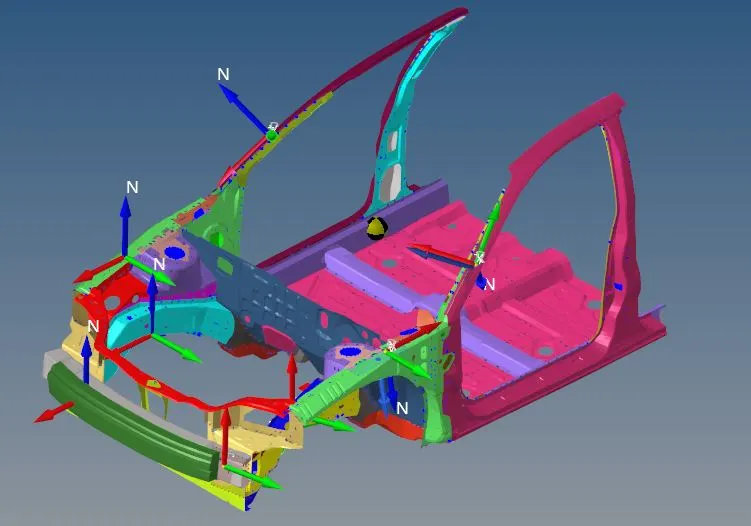
The output blocks for the right & left side of the car are calculated.
Results
Simulation
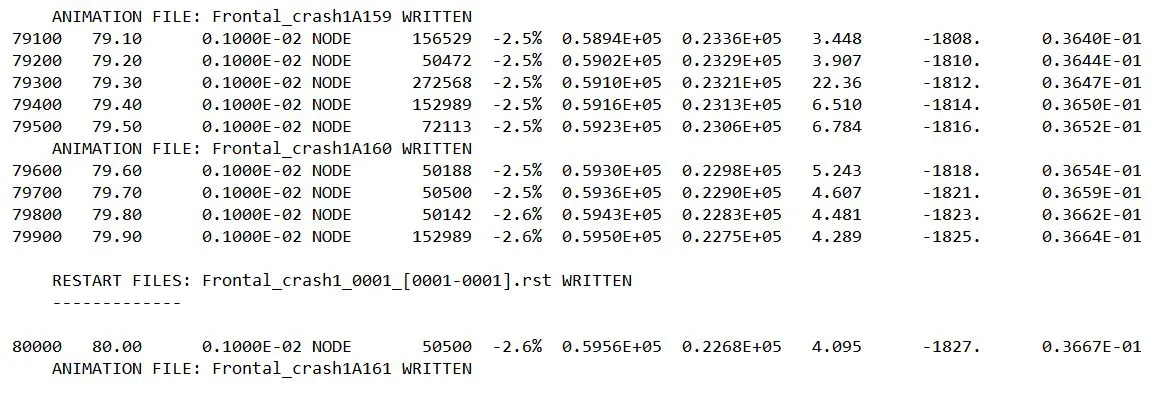
The energy error value is around 2.6% which is in the acceptable range of the element type used & the mass error is 0.3664e-1 which indicates that the added mass to overcome the minimum element failure criteria is very less the increase in kinetic energy will be less.
Contour plot
Displacement
The maximum displacement occurs at the front of the car where the car hits the rigid wall & the value is 1.168e+3 mm.
Plastic strain
The plastic strain depicts the deformation of the component during the crash. The peak value of the strain is 1.994 mm which is less & component hasn't deformed much during the crash.
Specific energy
Von misses
Bumper Sectional forces
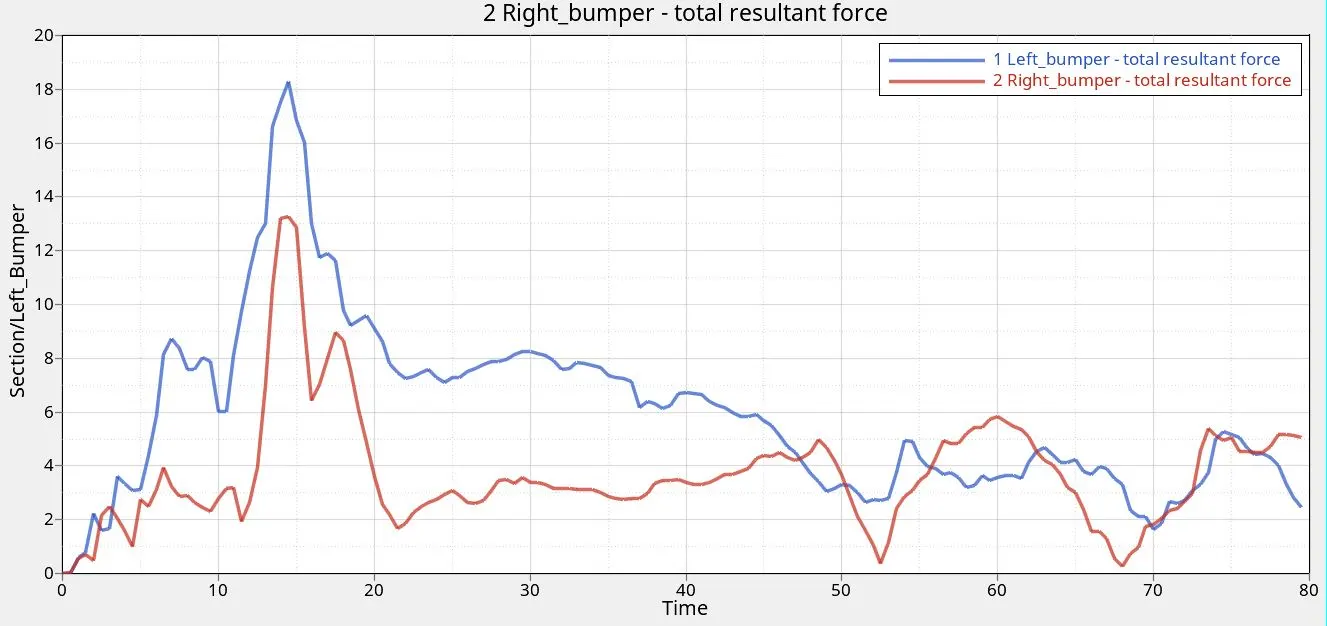
The Bumper gets deformed first since it contacts the rigid wall first & the function of the bumper absorb most of the impact during low speed collisions to help protect your vehicle and passengers from more serious damage. The force reaches its maximum at 10-15 ms & the deforms gradually reduces.
Maximum forced at right bumper - 13 kN.
Maximum forced at left bumper - 18.2 kN
Sectional forces at Rails
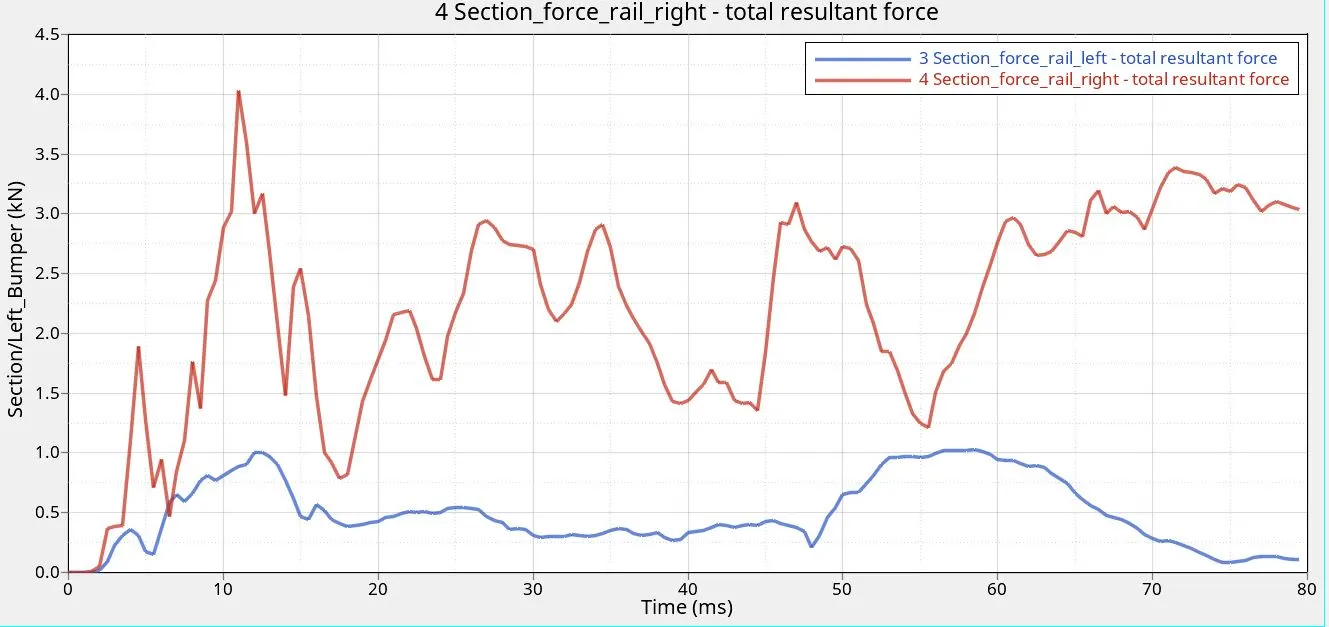
The front rails helps to absorb the energy after the bumper gets deformed completely the remaining force from the rigid wall affects the rail component & the deformation doesnt start at T = 0 because the load transfer occurs after the bumper deformation. The right side component deformed more than the left since in the bumper left absorbs more than the right so the force transfer is more in the right side.
Section force at right rail = 4 kN.
Section force at left rail = 1kN.
Shotgun forces
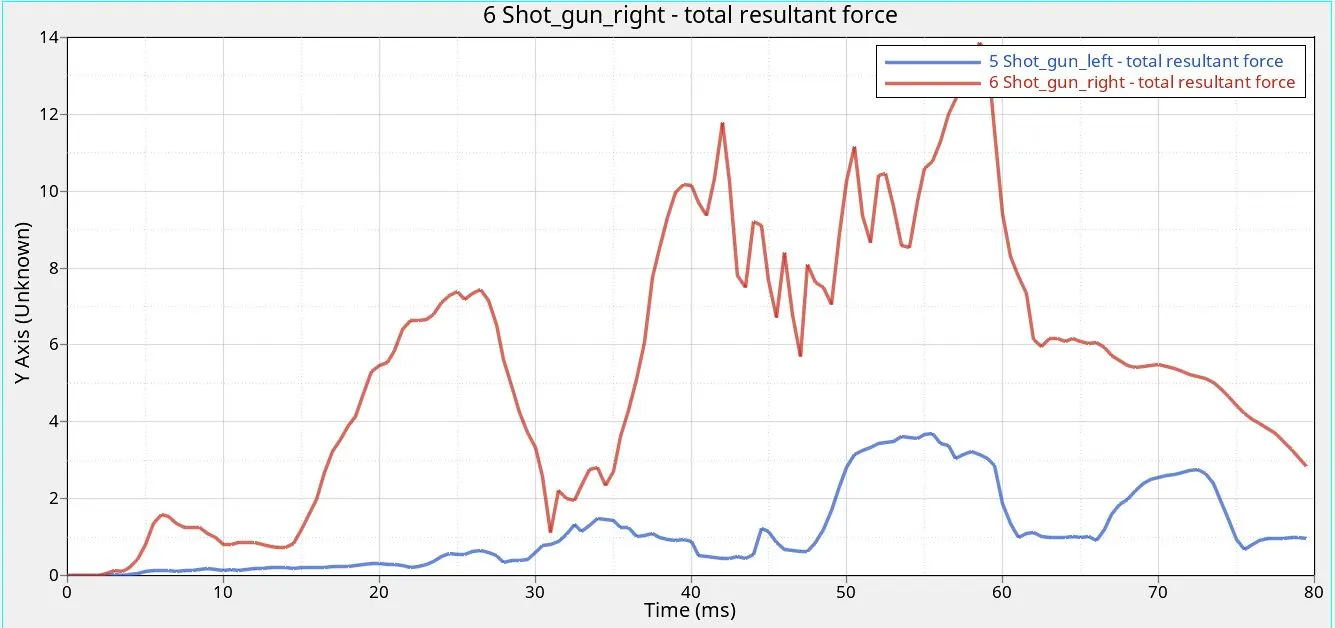
The energy transfer occurs from bumper to the rails to the shot gun & then to the A pillar. It is similar to the rails that the force transfer doesnt start at T=0. It helps to reduces the energy transmitted to the occupant area. The maximum value occurs after the 50 ms.
Sectional force on right shotgun - 14 kN.
Sectional force on left shotgun - 4 kN.
A pillar forces
Acceleration curve
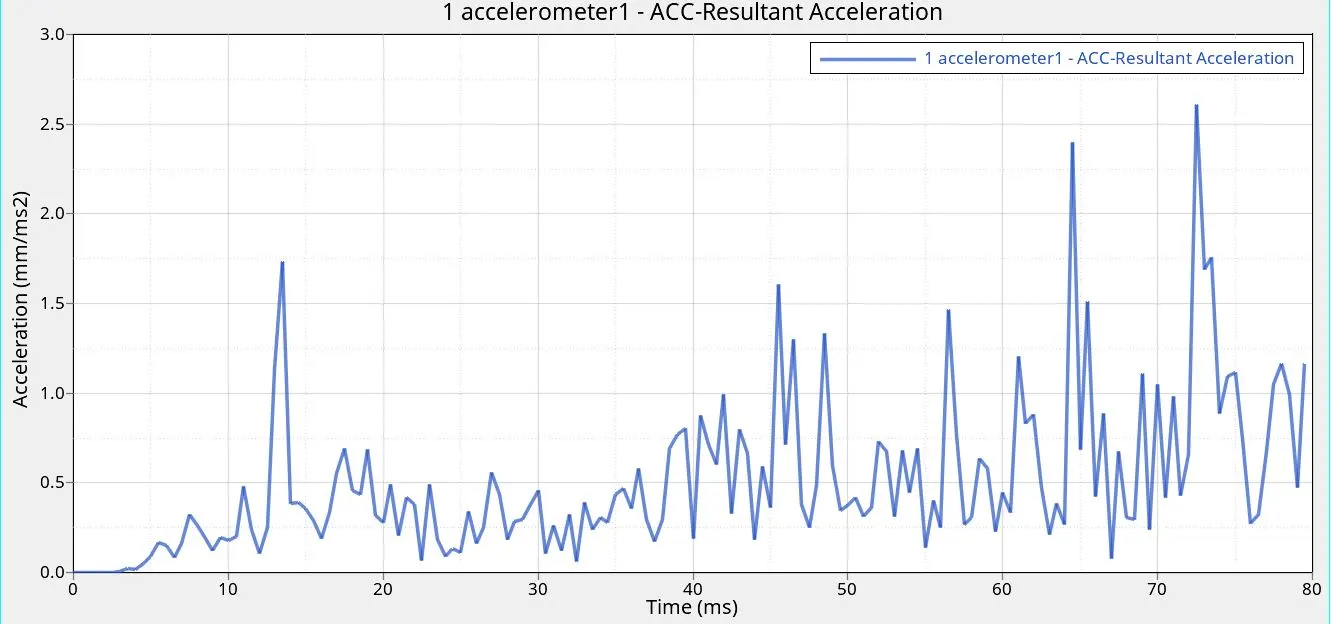
The maximum acceleration occurs after 70ms which is 2.5mm/ms^2.
Intrusion dash
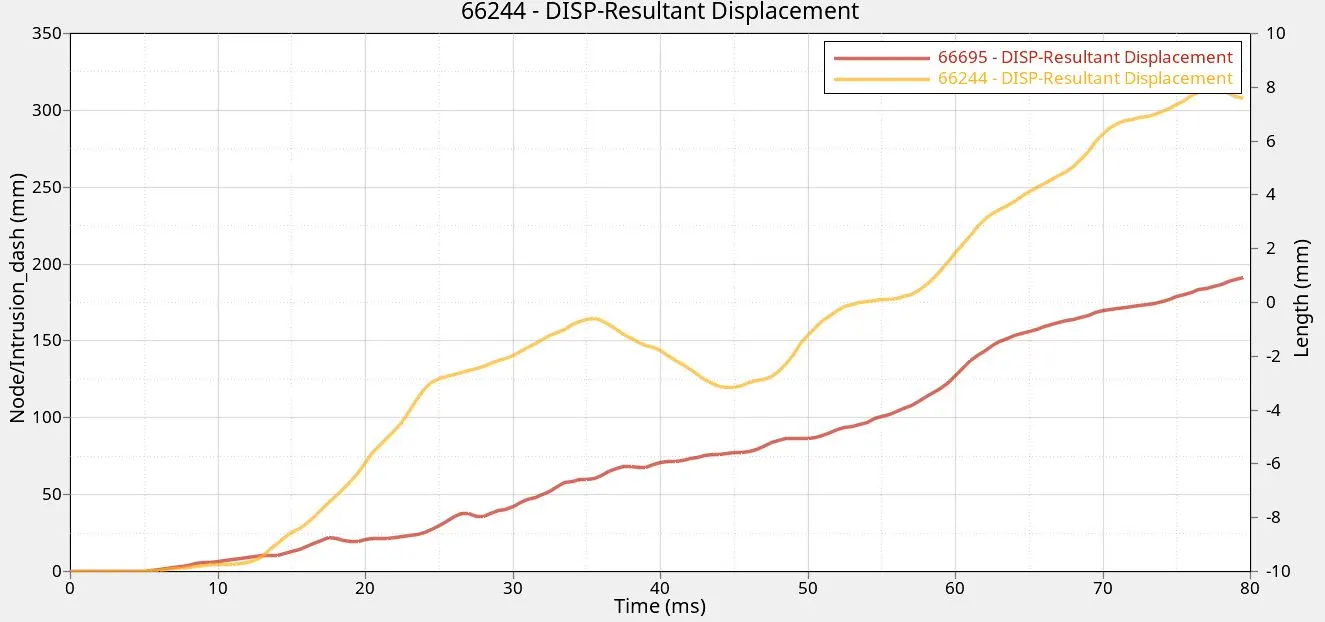
The displacement of the dash wall is high due to the absence of the engine components which helps to absorb energy before transferring to dash. By increasing the material grade and thickness of the dash wall components that will increase stiffness and reduce the intrusion.
Displacement at node 66244 - 310 mm.
Displacement at node 66695 - 200 mm.
Conclusion
The front crash analysis of the Neon Chrysler model was performed & the results of the simulation are provided below
Peak acceleration = 2.5 mm/ms^2.
Sectional force in left side bumper = 18.2 kN.
Sectional force in right side bumper = 13 kN.
Sectional force in left side rails = 1 kN.
Sectional force in right side rails = 4 kN.
Sectional force in left side shotgun = 4 kN.
Sectional force in right side shotgun = 14 kN.
Sectional force in left A-pillar = 1 kN.
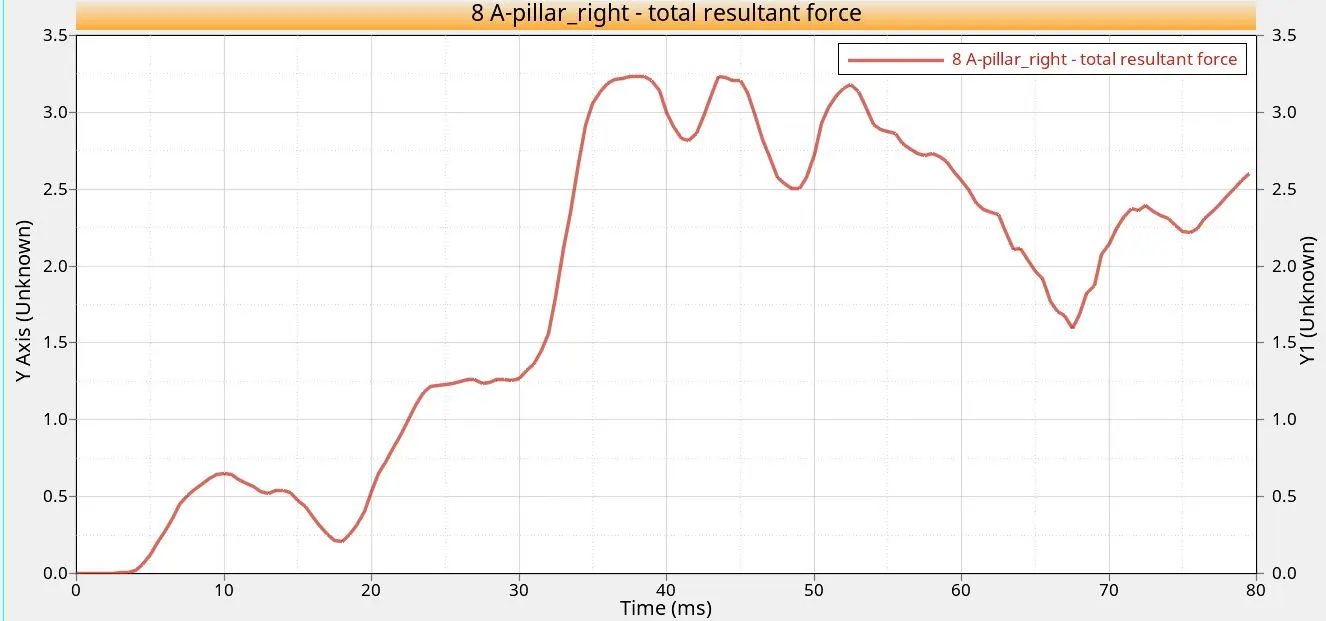
Sectional force in right A-pillar = 3.25 kN.
Displacement at node 66244 = 310 mm.
Displacement at node 66695 = 200 mm.
The half model of the simulation is used & we add masses to position the center of gravity & to get the realistic value the full vehicle body is analysed for accurate validation.