Week - 4 - Crash Box Simulation
Aim:
To simulate the crash test for the given crash box with 1.2mm thickness and generate the output results and compare the stress , strain and acceleration value with crashbox 1.5mm thickness.
- D3plot file
- ASCII Option like (glstat, rcforc, sleout,secfor, nodout)
- Animation file
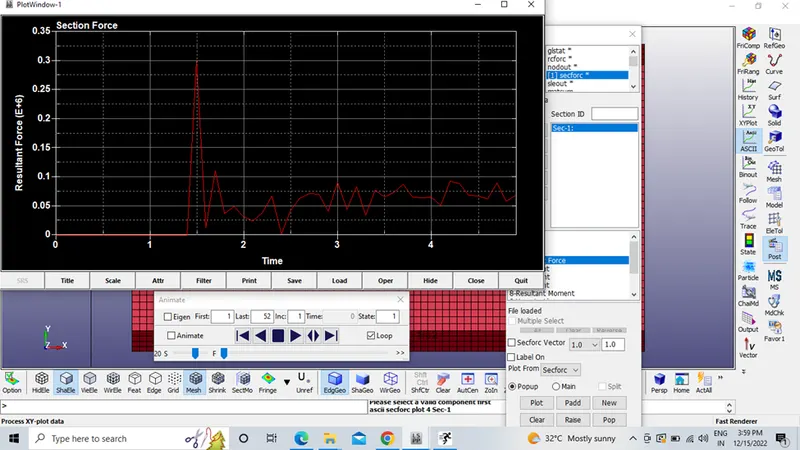
- Cross sectional force generated at the middle of the crash box
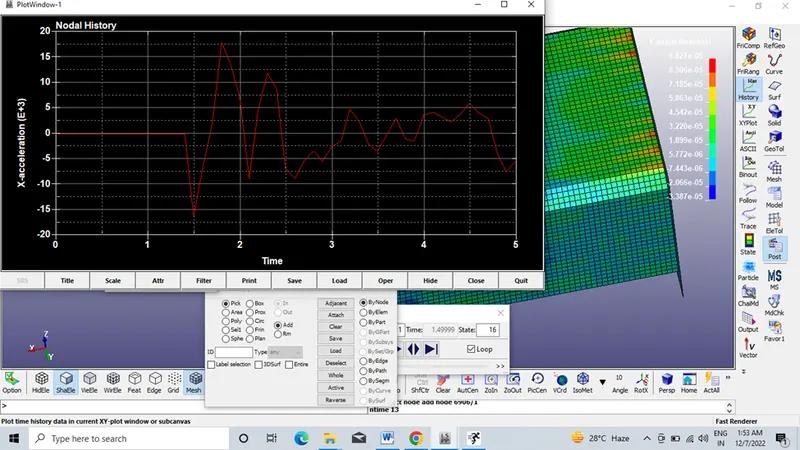
- Acceleration plot of a node in the middle of the crash box
- Maximum directional stress and strain along the length of the crash box (X strain, Y strain etc.,)
- Plot of all energies (total, internal, kinetic, Hourglass , sliding)
- Compare the accelerations and stress/strain plots of 1.2/1.5mm crash boxes.
Procedure:
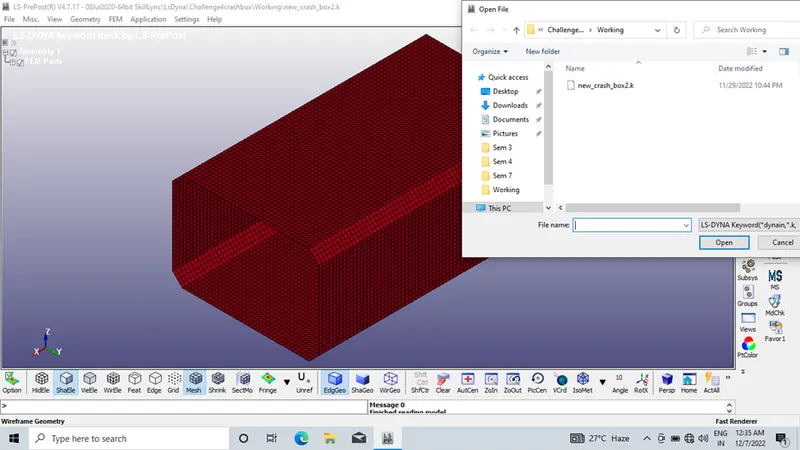
Step 1: Import the .k file.
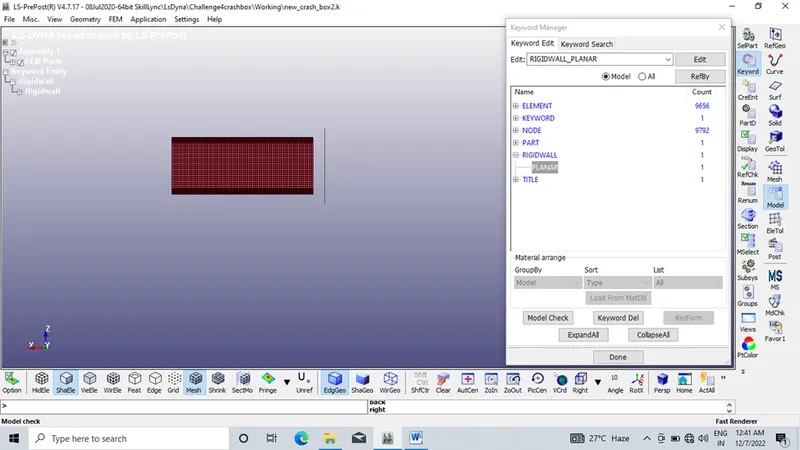
Step 2: Creating rigid wall in keyword manager
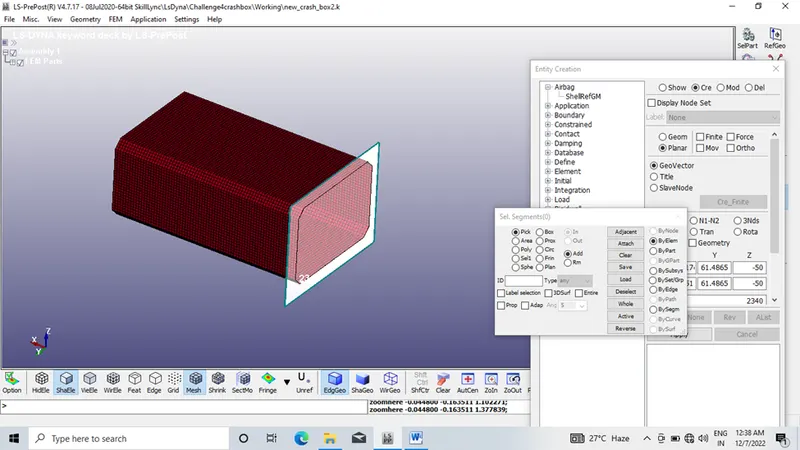
Translating the rigid wall to -20mm in x direction to have a proper hit
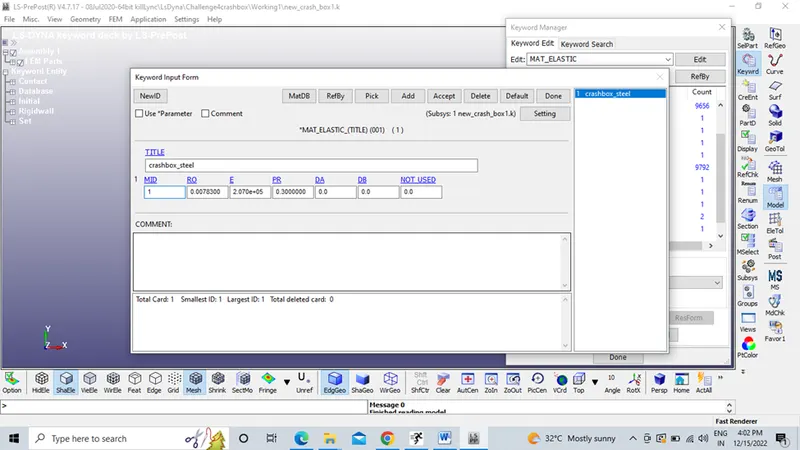
Step 3: Assigning Material property key as Elastic Material in keyword manager
- Density – 7.8e-3 gm/mm3
- Youngs Modulus – 2.07e5 gm/mm2
- Poisson ratio -0.30
Step 4: Selecting section shell thickness as 1.2mm
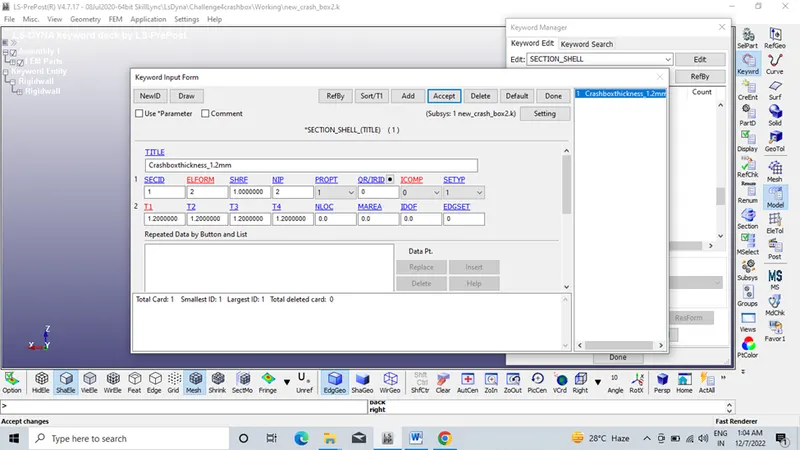
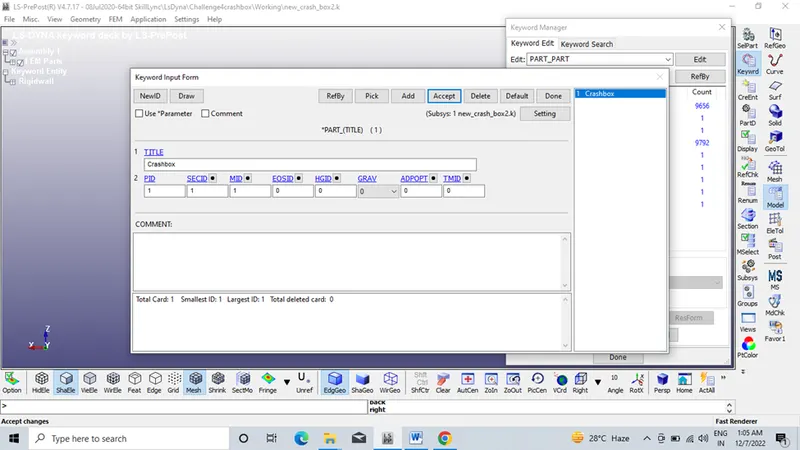
Step 5: Assigning Thickness and Materials to the part
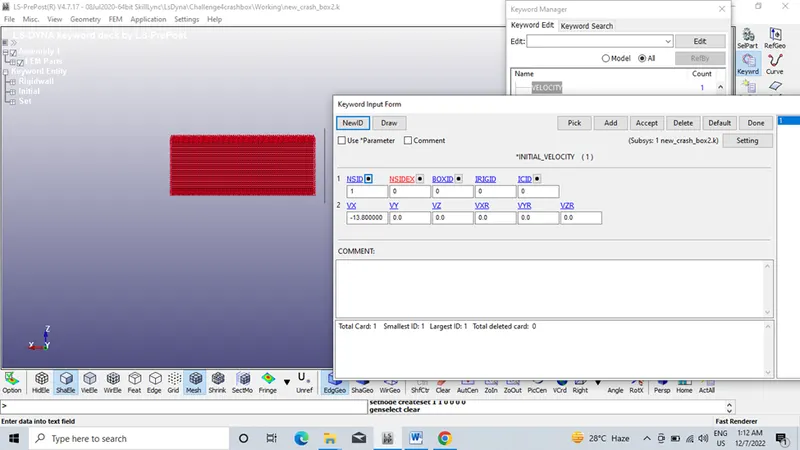
Step 6: Fixing boundary condition in Initial as velocity -13.89 mm/ms
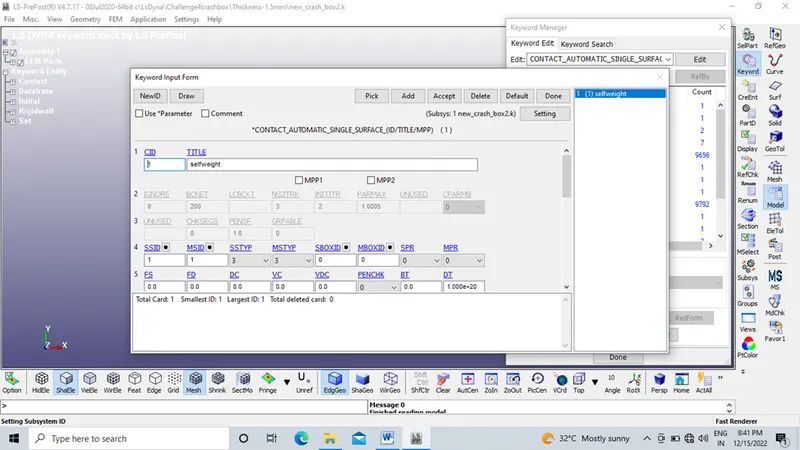
Step 7: Assigning contact as automatic single surface contact- Self weight
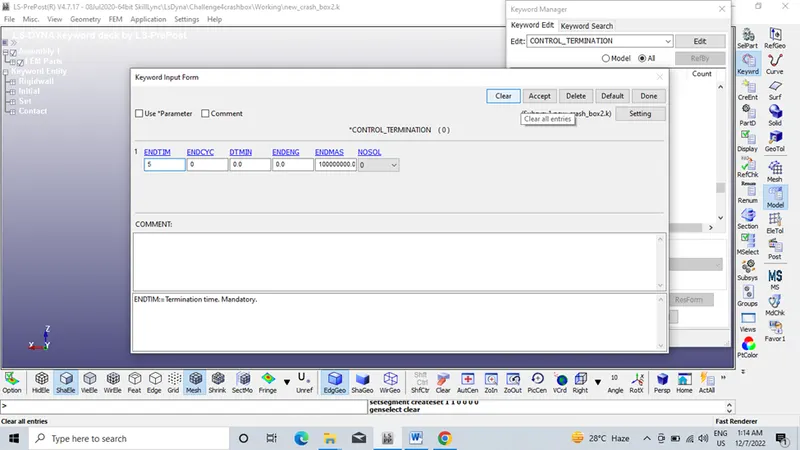
Step 8: Assigning Control Termination as 5ms
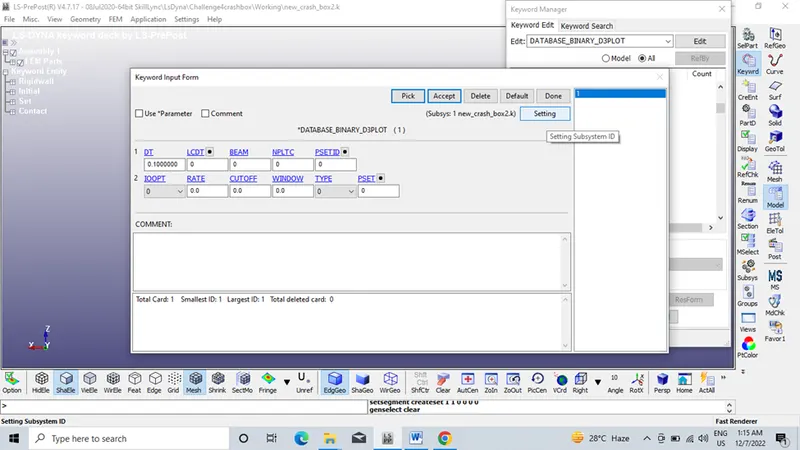
Step 9: In Database card select BinaryD3Plot to view the output result in the form of d3plot file.
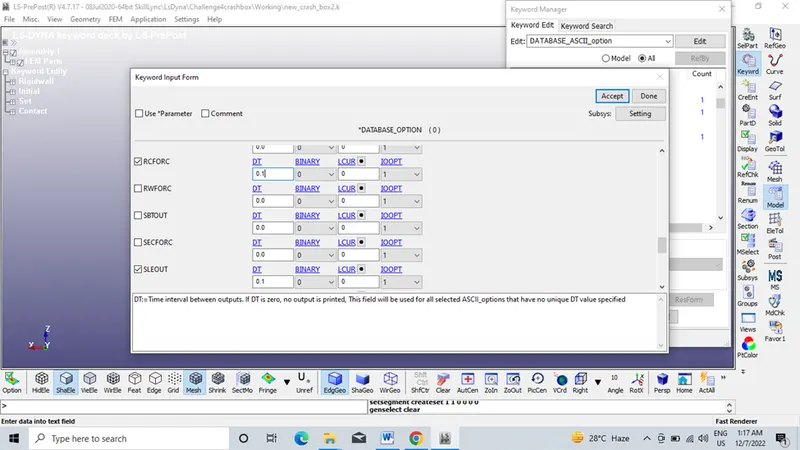
Step 10: Assigning AscII option – GLSTAT – Global Statistics,
RCFORC- Resultant Interface Force,
SLEOUT – Sliding Interface Energies
SECFORC – Cross sectional force
NODOUT- Nodal displacement/Velocity/ Acceleration
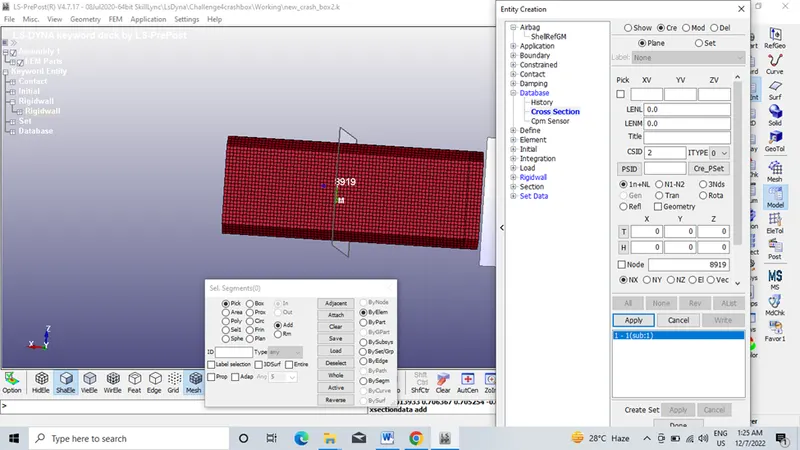
Step 11: Applying cross section to know the middle of the results
Step 12:Model Check done for the given crash box.
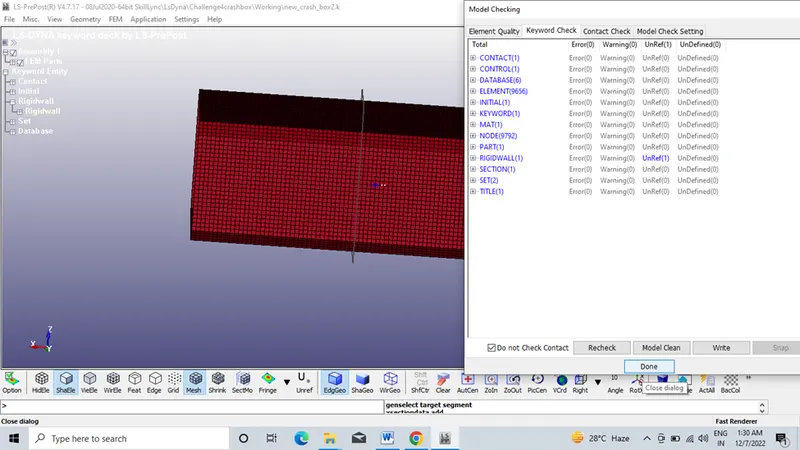
Step 13: Run the .k file in Ls Run manager and file gets normally terminated.
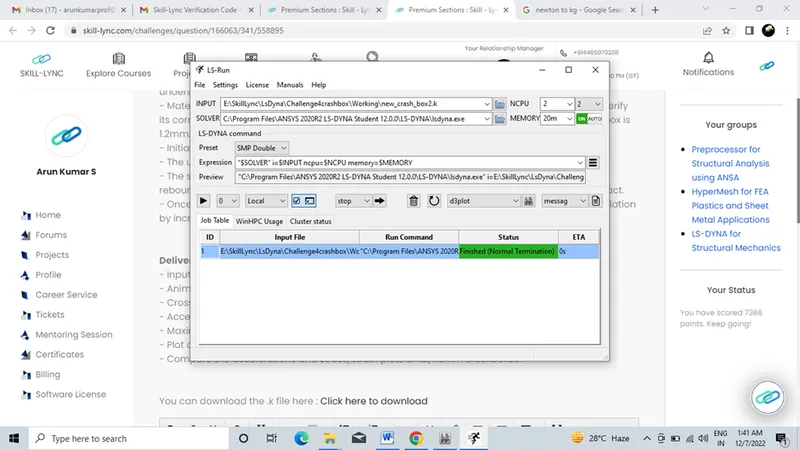
Step 14: Results and Discussions
Cross sectional force generated at the middle of the crash box for thickness 1.2mm
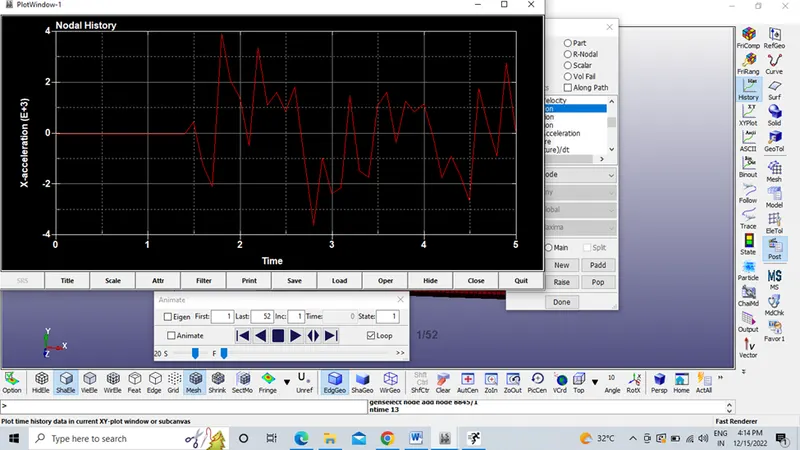
Acceleration plot of a node in the middle of the crashbox for thickness 1.2mm
Acceleration plot of a node in the middle of the crashbox for thickness 1.5mm
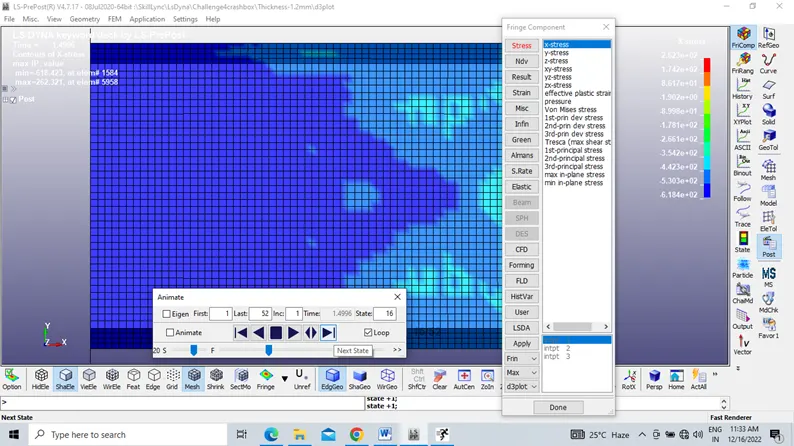
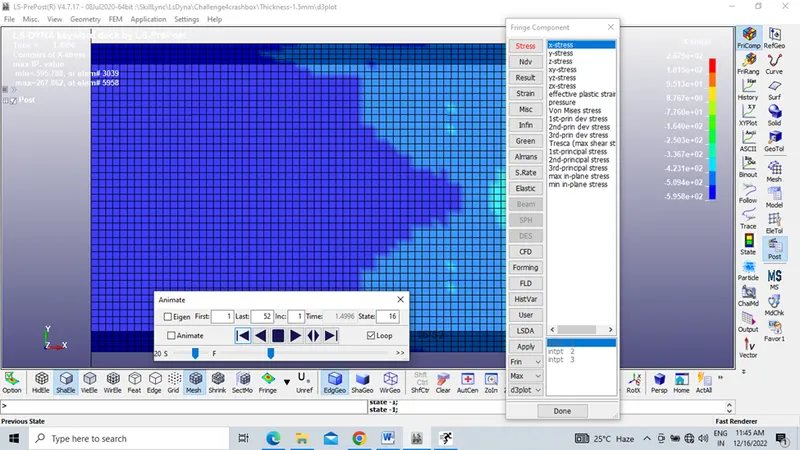
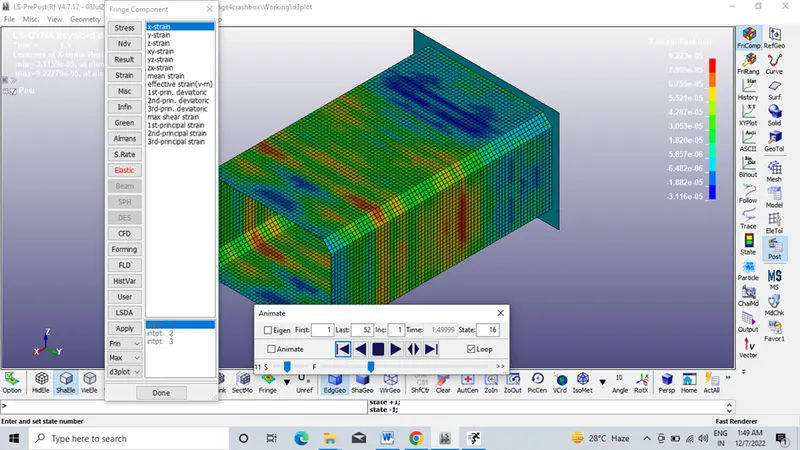
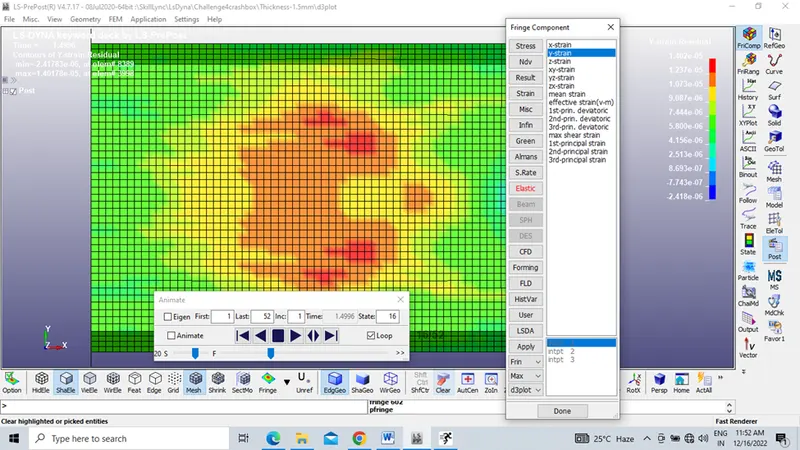
Maximum directional stress and strain along the length of the crashbox (X strain, Y strain etc) for thickness 1.2mm & thickness 1.5mm
Compare the accelerations and stress/strain plots of 1.2/1.5mm crash boxes.
Maximum stress in x direction – 262.3MPA (Thickness-1.2mm)
Maximum stress in x direction – 269.1MPA (Thickness-1.5mm)
Maximum stress in Y direction – 450.1MPA (Thickness-1.2mm)
Maximum stress in Y direction – 437.1MPA (Thickness-1.5mm)
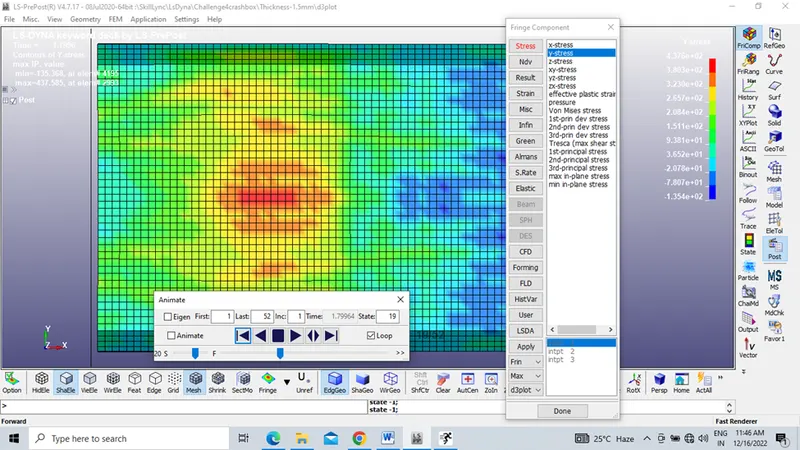
Maximum Strain in X direction -7.51e-6 (Thickness-1.2mm)
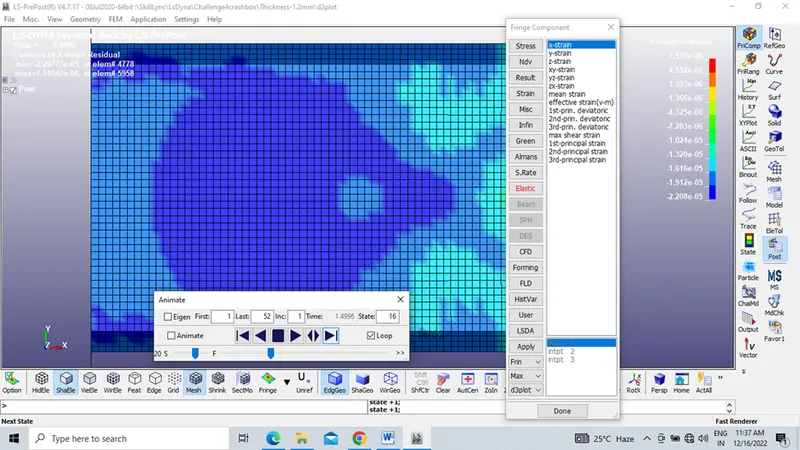
Maximum Strain in X direction -7.68e-6 (Thickness-1.5mm)
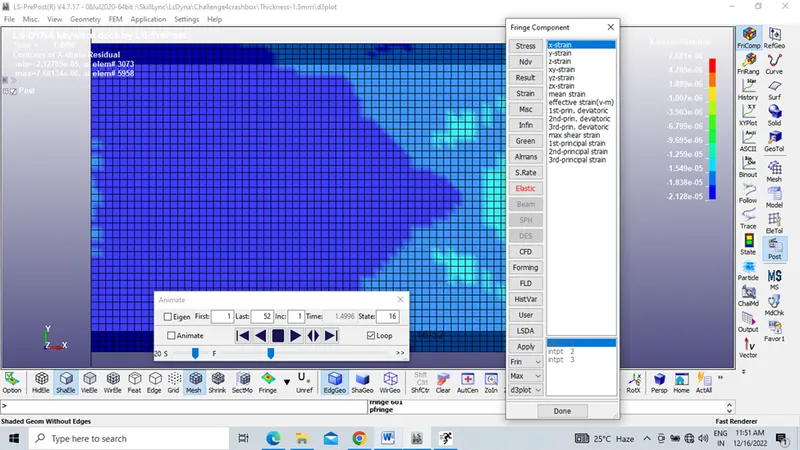
Maximum Strain in Y direction -1.37e-5 (Thickness-1.2mm)
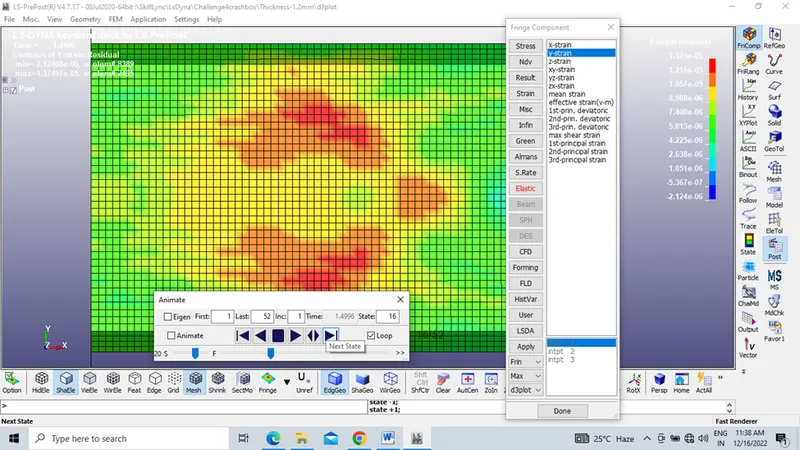
Maximum Strain in Y direction -1.402e-5 (Thickness-1.5mm)
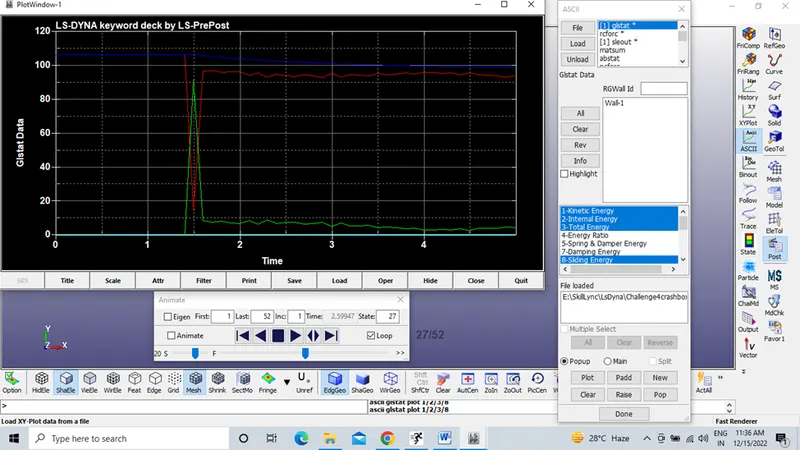
Plot of all energies (total, internal, kinetic, hourglass sliding) for crashbox thickness 1.2mm
From the results it is observed that total energy remains almost constant but kinetic energy at 1.5ms it drastically reduced due to at that point crash box hits the wall where as at the same time 1.5ms internal energy remains drastically increased due to crash happens at that time.
Learning Outcomes:
From the above results it is evident that crash box with thickness 1.5mm and 1.2mm exhibit more or less same stress and strain value.
- Maximum stress in x direction – 262.3MPA (Thickness-1.2mm)
- Maximum stress in x direction – 269.1MPA (Thickness-1.5mm)
- Maximum stress in Y direction – 450.1MPA (Thickness-1.2mm)
- Maximum stress in Y direction – 437.1MPA (Thickness-1.5mm)
- Maximum Strain in X direction -7.51e-6 (Thickness-1.2mm)
- Maximum Strain in X direction -7.68e-6 (Thickness-1.5mm)
- Maximum Strain in Y direction -1.37e-5 (Thickness-1.2mm)
- Maximum Strain in Y direction -1.402e-5 (Thickness-1.5mm)
Conclusion:
From this project I have learned about how to assign keyword manager for the given condition and to interpolate the results while comparing the crash box of thickness 1.2mm and thickness 1.5mm.