External aerodynamics simulation over an Ahmed body.
Objective:
As the body is perfectly symmetric, we can run the simulation by considering the only half body. This is the best practice where you can save on the number of cells and get the results faster as well.
The geometry which is provided with the challenge needs a modification which you should be able to do at this stage of a course. You need to use the 'split body' command in SpaceClaim to perform the operation and then you can use the symmetry boundary condition in fluent to perform the simulation.
Run the simulation for the velocity of 25 m/sec with the default air properties in fluent.
For this challenge, you will have to provide answers to the following questions:
Q1. Describe Ahmed's body and its importance.
Q2. Explain the reason for the negative pressure in the wake region.
Q3. Explain the significance of the point of separation.
Expected Results:
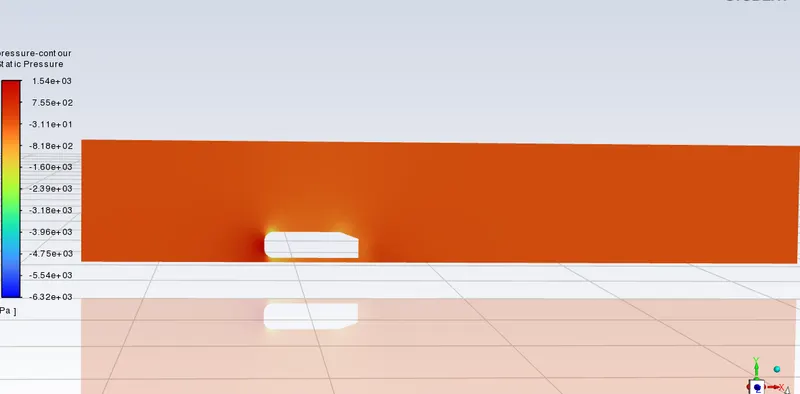
1. Velocity and pressure contours.
2. The drag coefficient plot for a refined case. ( For a velocity of 25m/sec, the drag coefficient should be around 0.33).
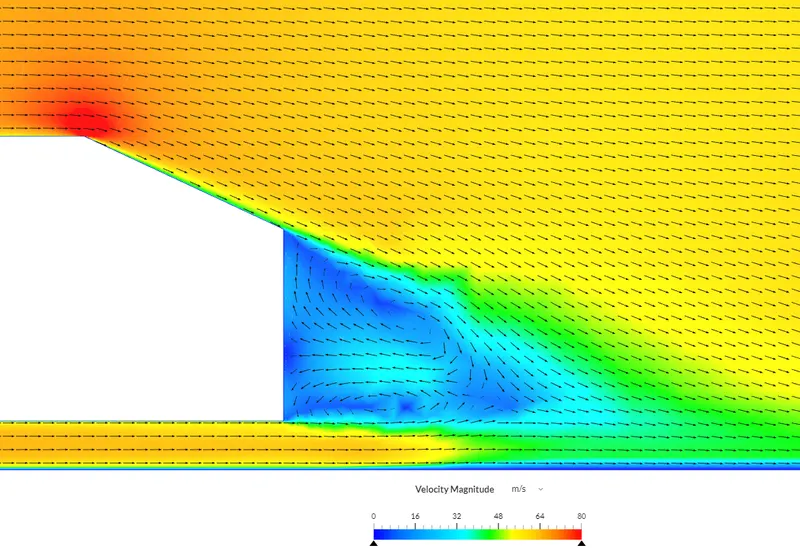
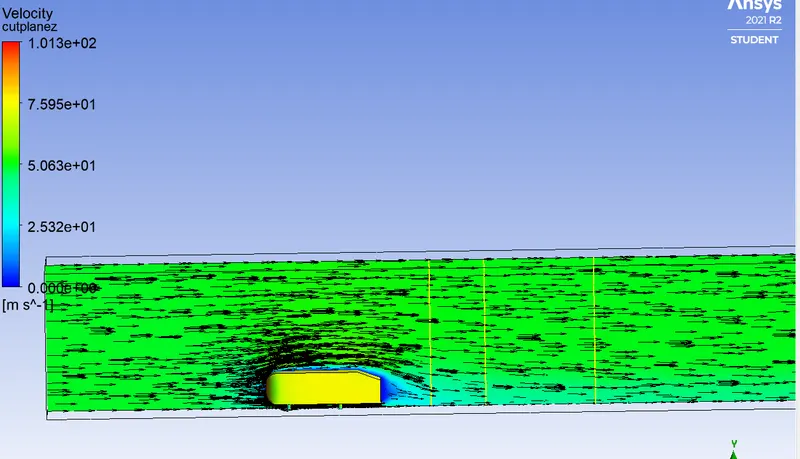
3. The vector plot clearly shows the wake region.
4. Perform the grid independence test and provide the values of drag and lift with each case.
Reference Research papers:
Flow and Turbulence Structures in the Wake of a Simplified Car Model
Experiments and numerical simulations on the aerodynamics of the Ahmed body
Solution:
We are about to simulate external aerodynamics around the Ahmed body and the flow phenomenon. But Before we jump into the flow analysis for the same we are going to understand the concept behind the aerodynamics behavior around Ahmed's body.
What's Ahmed Body and its significance:
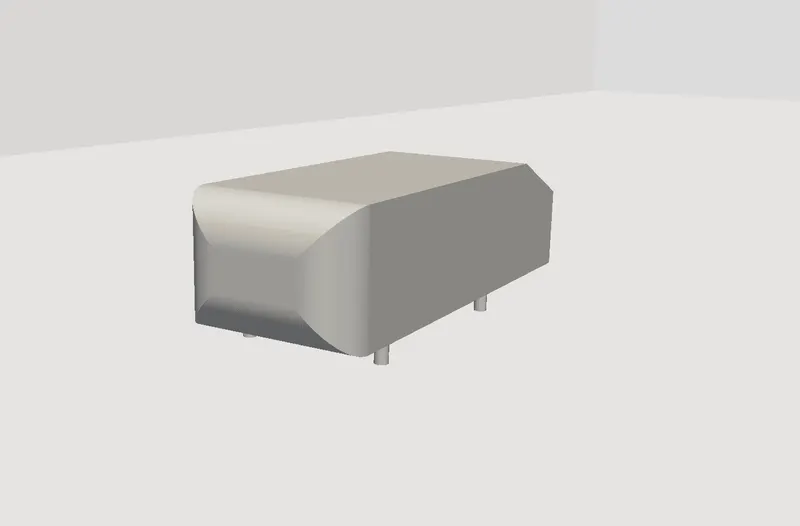
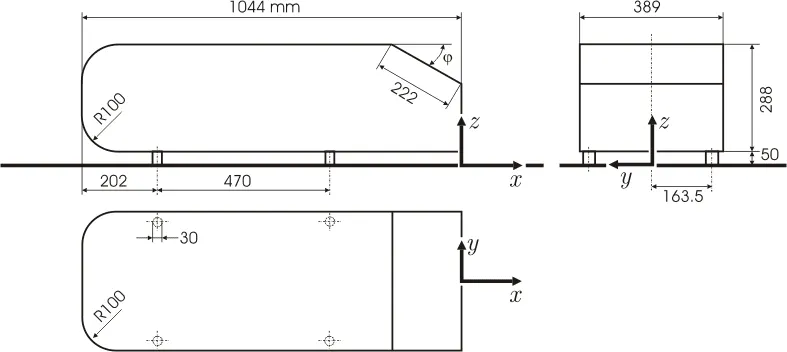
The Ahmed body was at first put forward by Ahmed et al. (1984). is a general car model which is used by the automotive industries (Morel (1978), Good and Garry (2004), Guilmineau and Chometon (2009), Heft et al. (2012) and Huminic and Huminic (2012)), to examine the wake forces and dynamics which is experienced in a verity of configurations. The Ahmed body is designed to have a smooth-edged front end with a flat roof and a flat bottom section and an angled back slant which basically acts as the rear window of a car and ends with a vertical base. The back-slant angle which is commonly designated as ϕ is very critical to the flow patterns which are fashioned at the near wake region and subsequently has an impact on the aerodynamic forces which act on the body. Car companies make numerous attempts to develop modified designs to effectively reduce the aerodynamic drag force which occurs at the rear end without putting any constraints on the stability, comfort, and safety of the passengers. The aerodynamic drag of road automobiles is firmly connected to the vehicle’s wake downstream flow. The separation zone size and the drag force FD directly rest mainly on the position of flow separation over the Ahmed body.
Subsequently, comprehensive facts regarding the wake flow characteristics and their connection with the geometry of the body are essential for the successful design of upcoming future cars. The application of Computational Fluid Dynamics (CFD) in determining fluid flow patterns has been observed to be very common among researchers in the present day. CFD modeling in determining the flow line of fluid around the Ahmed body has been utilized since the early 21st century. In many open kinds of literature, the CFD application in determining airflow pattern and the changes in flow motion with altering the geometry of the Ahmed body has been found. Certain modifications in the Ahmed body aid researchers and designers to determine the effect of modification on the resultant drag and lift force which can be calculated using Preprints.
Significance
The chief purpose of automotive aerodynamics is the reduction of drag, lessening noise emission, increasing fuel economy, and eliminating unnecessary lift forces and other origins of aerodynamic unsteadiness which arise at high speeds. The conventional Ahmed reference model has been considered as the standard model in this research work for carrying out numerical simulations for researching on the aerodynamic parameters. The Ahmed body has alike featured like a general car and is broadly utilized for authentication of new codes in the automobile industry. This simple geometric model has a length of 1.044-meter, a height of 0.288 meters,s and a width of 0.389 meters. It consists of cylindrical legs of a 0.5-meter radius attached to the bottommost part of the body. The rearmost surface has an inclination of 25 degrees. Ahmed's body characterizes the simplified geometry of a ground vehicle as a bluff body type. Its geometry is adequate enough for precise flow simulation and retains a few vital practical features relevant to cars. This model aids engineers and designers to generate turbulent flow fields surrounding the simple car model by the use of the k-epsilon model.
In spite of neglecting quite a few numbers of features of a real car like rough underside, rotating wheels, surface projections, etc. The Ahmed body generates the crucial features of flow pattern around a car for instance flow impinge-mentation and the displacement around the nose, relative uniform flow of air around the middle portion, and flow separation along with the wake generation at the rear. Since the Ahmed body is easy to model, it can be effortlessly utilized for researching various properties like turbulence, drag coefficient, wake region, lift forces, velocity magnitude at various regions of the car, the magnitude of pressure around the car which helps in determining what will be resistance, fuel efficiency, etc. of the car thereby providing designers a clear idea on which region needs to be optimized for better effectiveness. The main objective of this study is the stimulation of turbulent flow within the wind tunnel and around the Ahmed body to capture the flow pattern at the rear and wake region. Local refinement of mesh inside the concerned body is done with the necessary body and face sizing of the parts of the Ahmed body to generate well-defined plots for pressure and velocity contours and its grid dependency test is the primary focus of this paper.
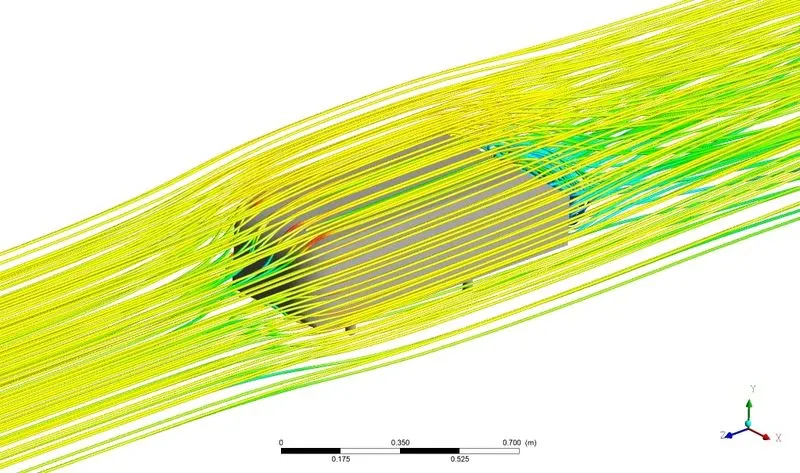
Velocity pathlines over Ahmed body
COARSE CASE:
Now we are going to try to run different cases in fluent and analyze the data ourselves. The aerodynamic behaviors over Ahmed's body are the pondered engineering for all the solid dynamics that can be used in the aerospace and automobile sector. We have the.STEP file through which we're going to run a few simulations.
And we open fluent and run Spcaclaim where we first introduce and run a simulation as a base mesh setup and then we move to a more refined setup.
we used the ENCLOSURE tool to box the Ahmed body so we can visualize the physical phenomenon of the flow. W have also sued the SPLIT BODY tool for geometry.
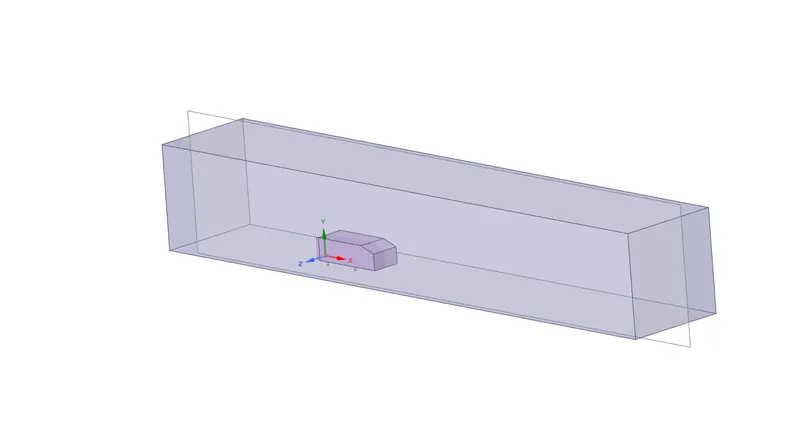
We moved to the mesh part.
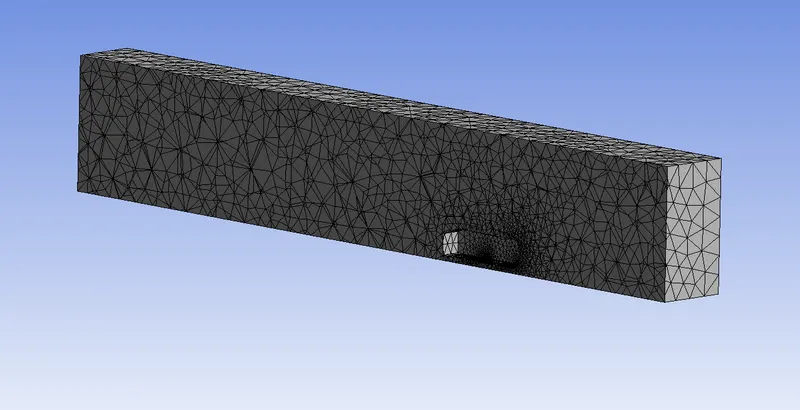
Influent we tried t simulate the geometry and have the following setup tool.
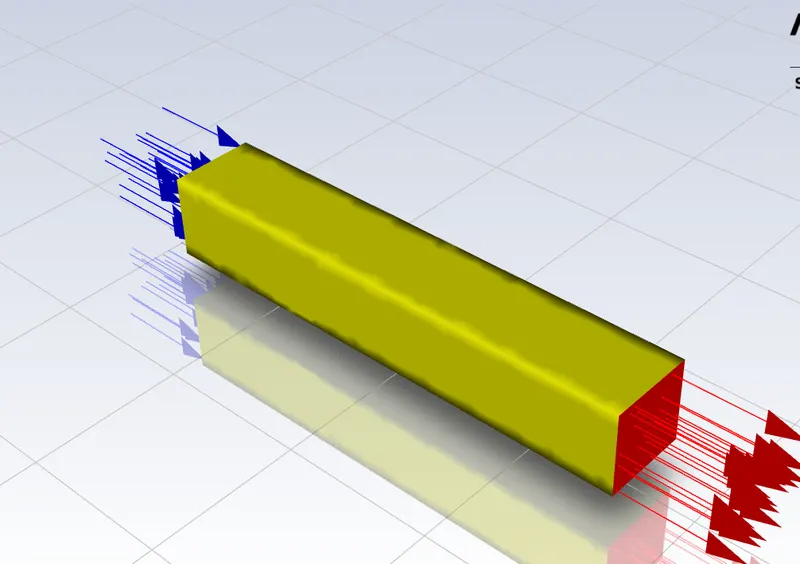
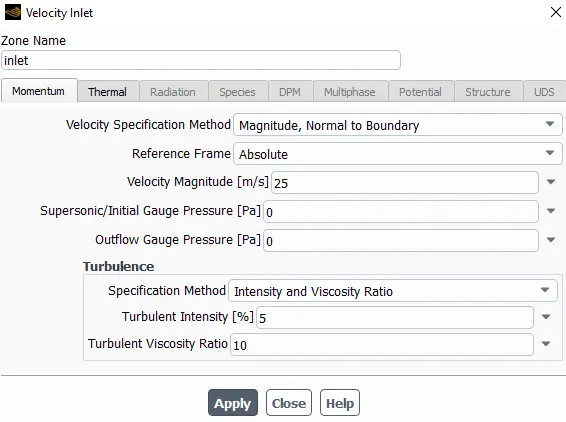
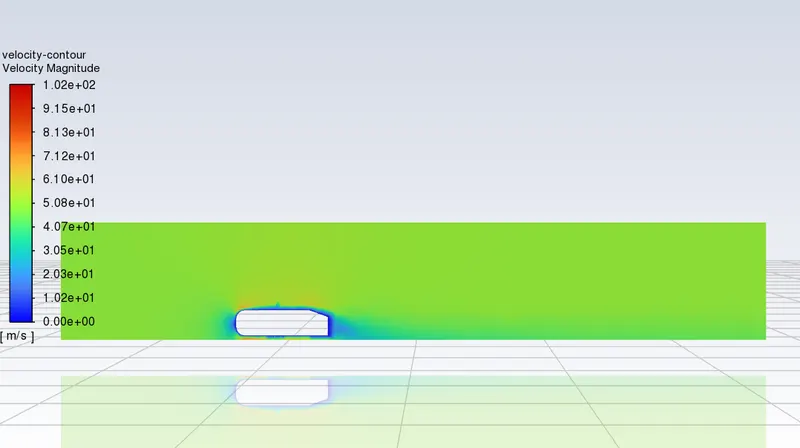
running at the velocity 25ms-1.
Velocity contour:
Pressure Contour:
Vector plot lines.
Coefficient of drag = 0.27
NOTE: TO REDUCE THE COMPUTATIONAL LOAD AND LIMITATION OF THE LICENSING WE ARE RUNNING SIMULATION WITH SECTIONAL VIEW MAKING HALF OF THE GEOMETRY.
REFINED CASE:
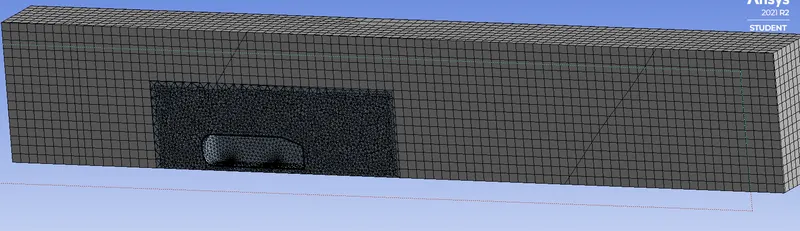
Then we moved on to the Refined setup where we make the mesh finer so that we are able to validate the drag coefficient correctly. As before we export geometry in SpaceClaim. and USE DOUBLE ENCLOSURE command to make it finer.
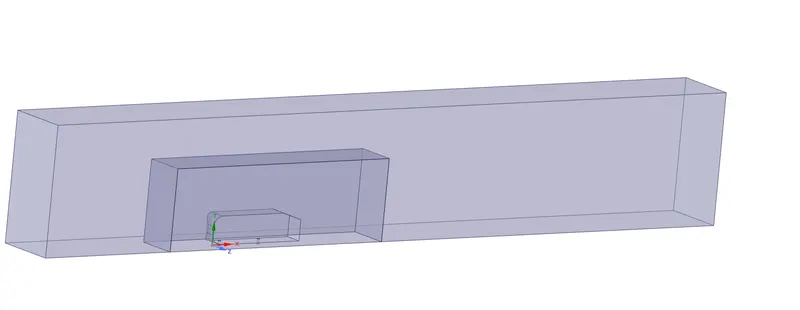
This is what mesh represents after adding a double enclosure.
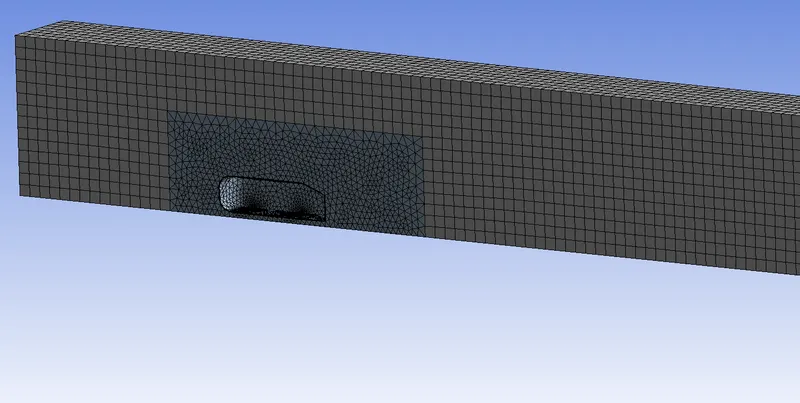
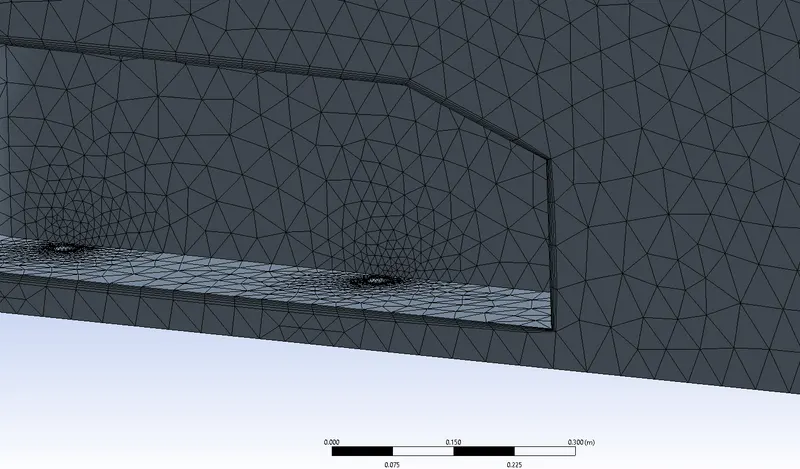
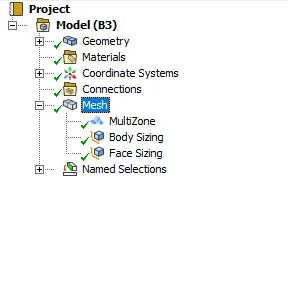
The Big block meshes around 0.1mm and the small box around 0.05mm and the Ahmed body refined down to 0.001mm.
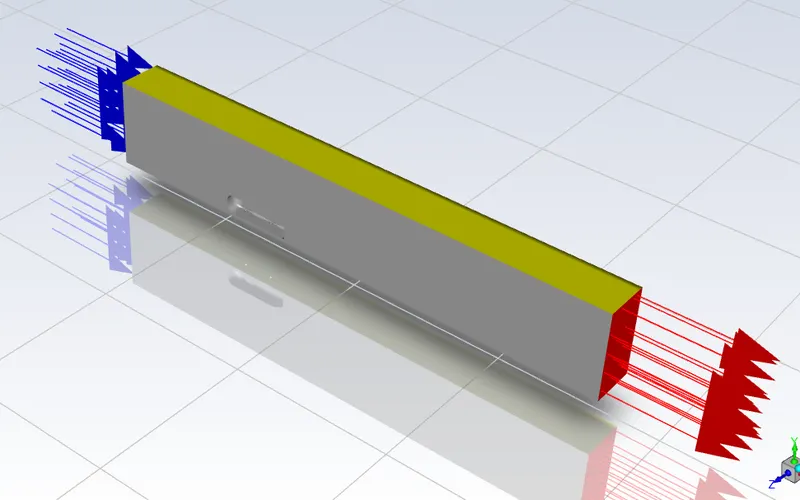
the drag coefficient of the refined case setup is 0.29
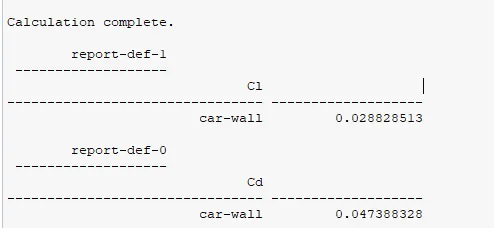
Coefficient of drag: 0.047
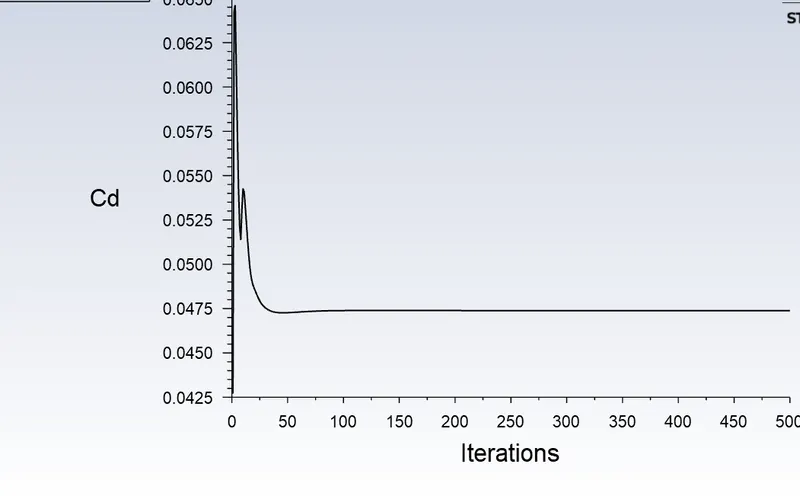
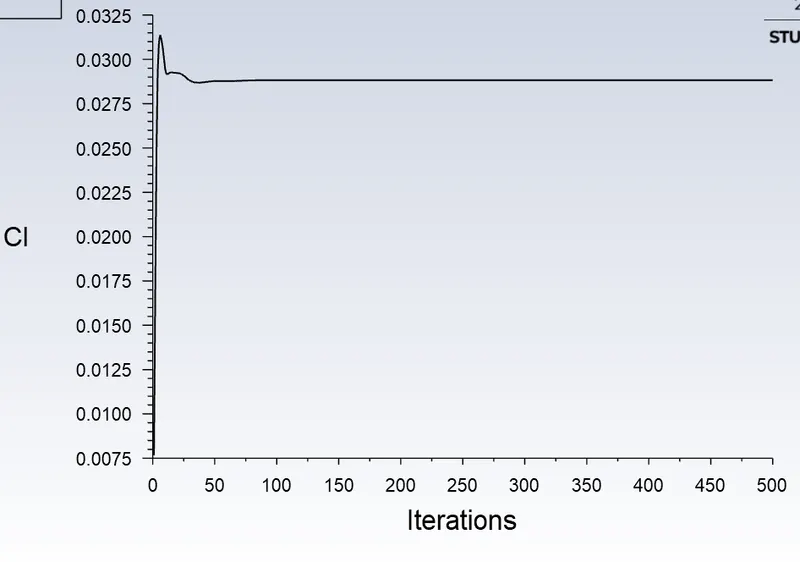
The above values are meant for velocity magnitude as 25ms-1 with no reference values with pressure gradient. The following are the values with the reference values considering the dimensions of the Ahmed body to be around 1044mm long, 338mm high, and 389mm wide.
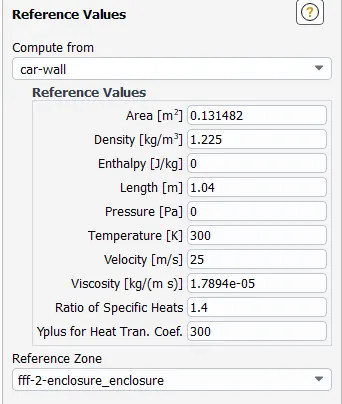
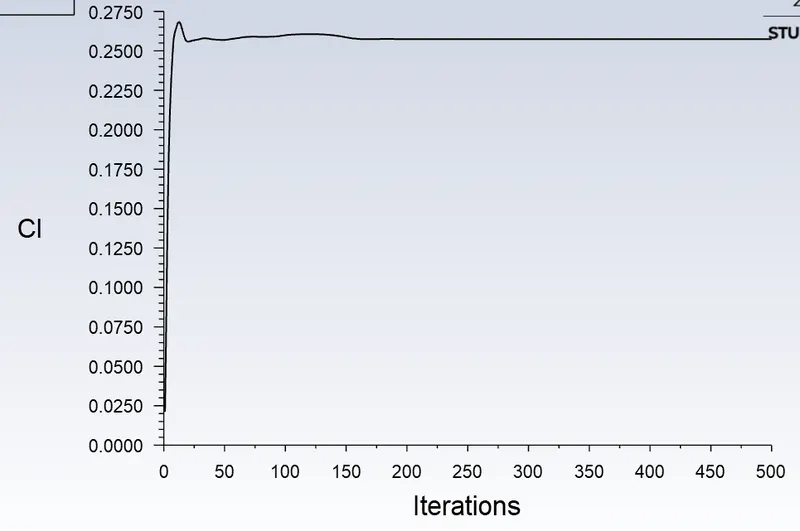
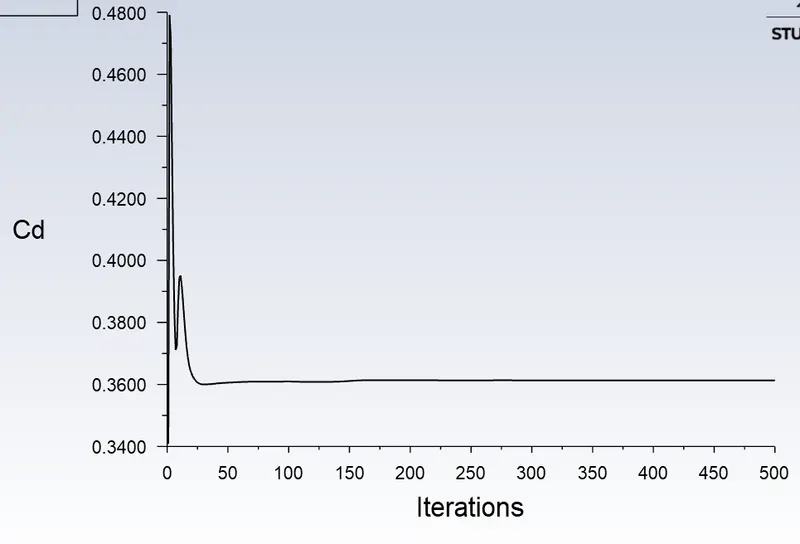
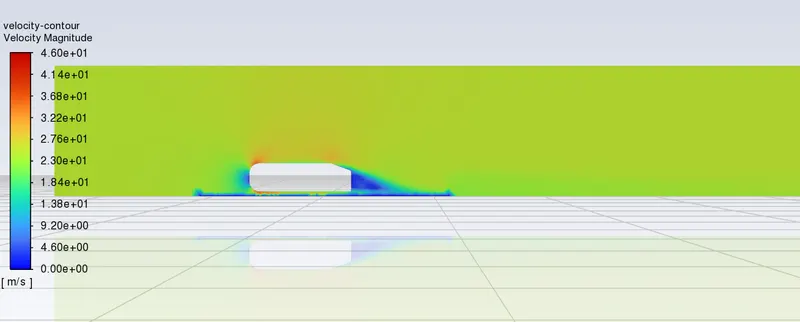
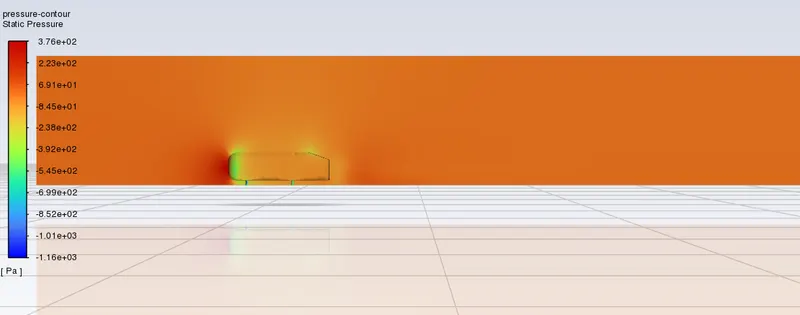
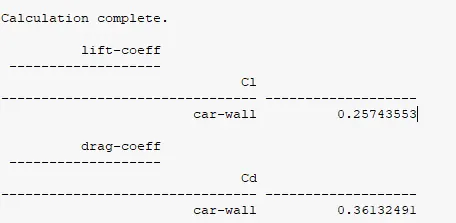
Coefficient of drag: 0.36 which is around 0.33 at 25ms-1 velocity magnitude. With a Lift coefficient as 0.257
Vector Plot
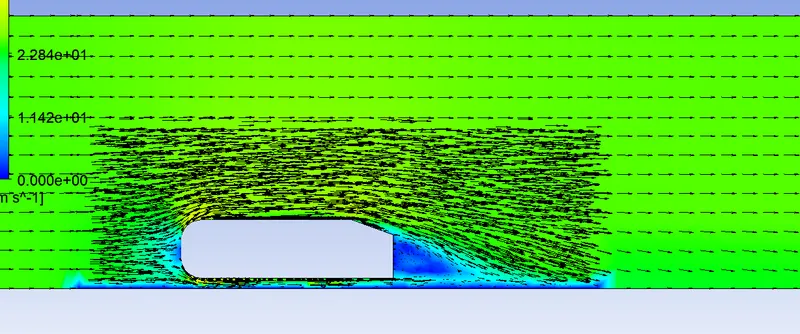
Different Cases with varying mesh quality and values of coefficient of drag and Lift
Refined Case : Major Enclosure (Big BOX): 0.1m / 100 mm and Max Size : 0.1m / 100mm
Small Enclosure (Smal Box): 0.05m / 50mm
Ahmed body and Stand faces: 0.01m / 10 mm
Mesh Quality and Cell numbers: 174563 cells
Case 1: Major Enclosure (Big BOX): 0.095m / 95 mm
Small Enclosure (Smal Box): 0.043m / 43 mm
Ahmed body and Stand faces: 0.01m / 10 mm
Mesh Quality and Cell numbers: 233253
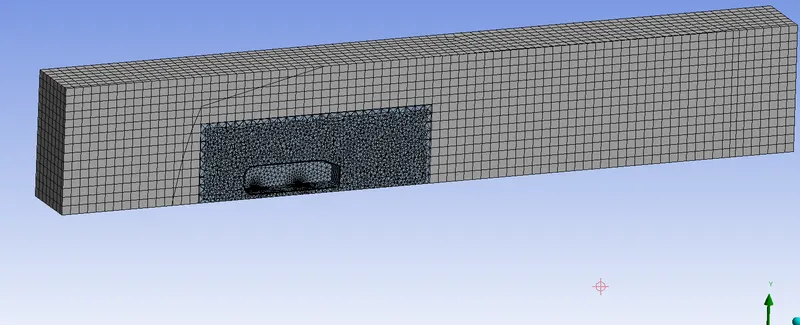
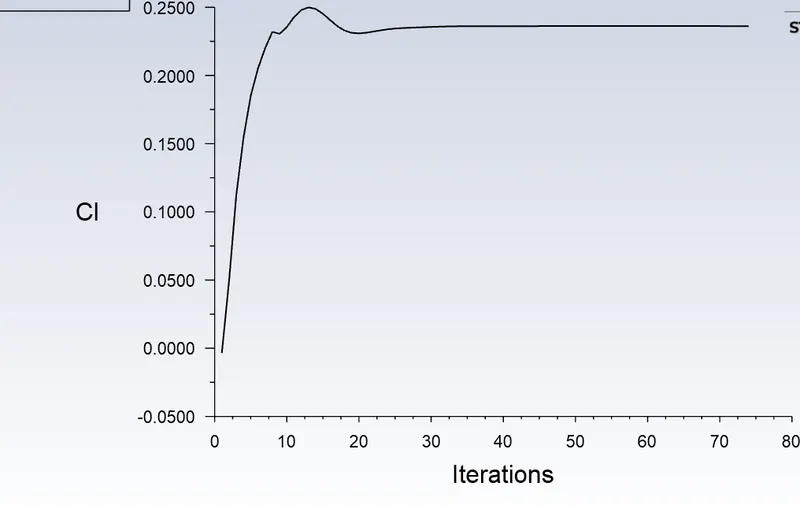
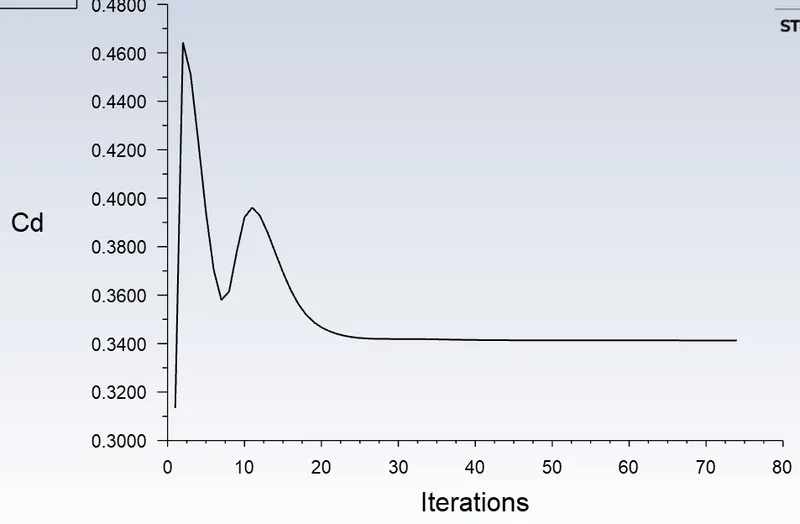
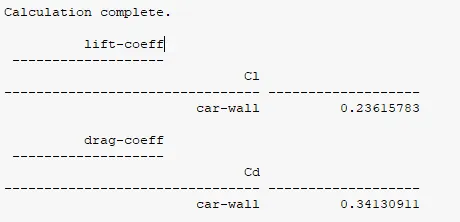 Coefficient of drag = 0.34 & Coefficient of lift = 0.23
Case 2: Major Enclosure (Big BOX): 0.090 m / 90mm
Small Enclosure (Smal Box): 0.038m / 38 mm
Ahmed body and Stand faces: 0.01 mm / 10 mm
Mesh Quality and Cell numbers: 313769
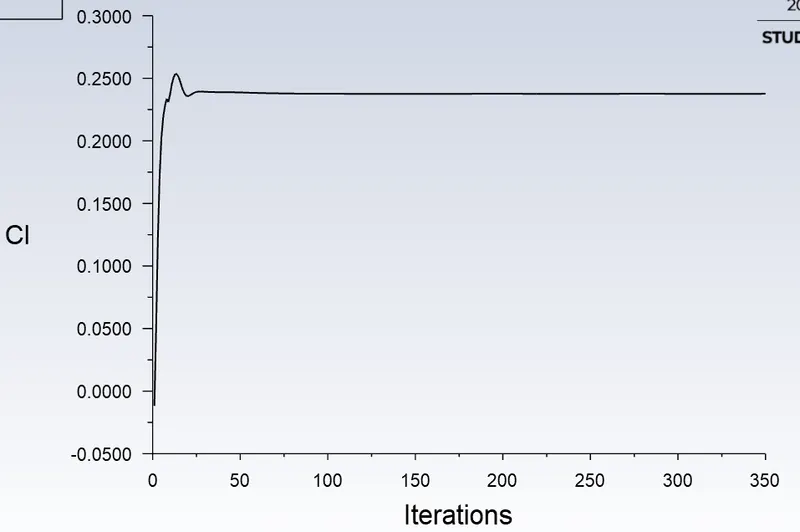
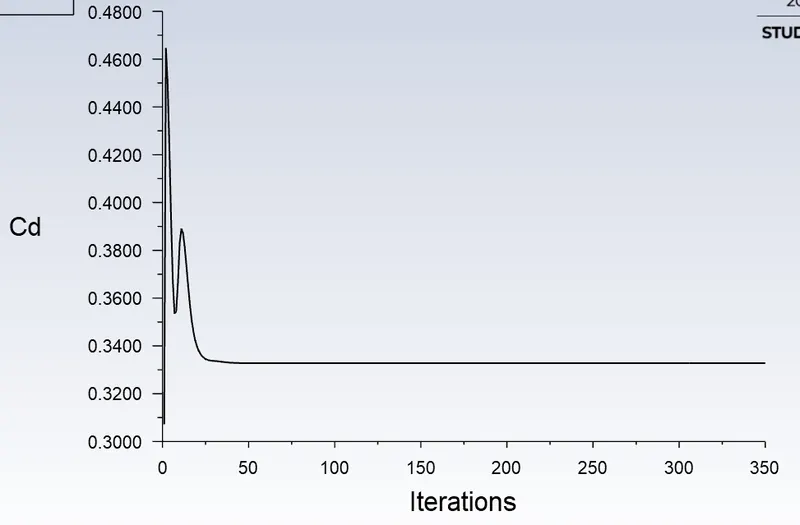
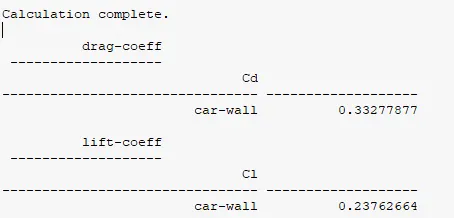 Coefficient of drag = 0.33 & Coefficient of Lift = 0.23
Case 3: Major Enclosure (Big BOX) : 0.088 m / 88mm
Small Enclosure (Smal Box): 0.035m / 35 mm
Ahmed body and Stand faces: 0.003 mm / 3 mm
Mesh Quality and Cell numbers: 419943
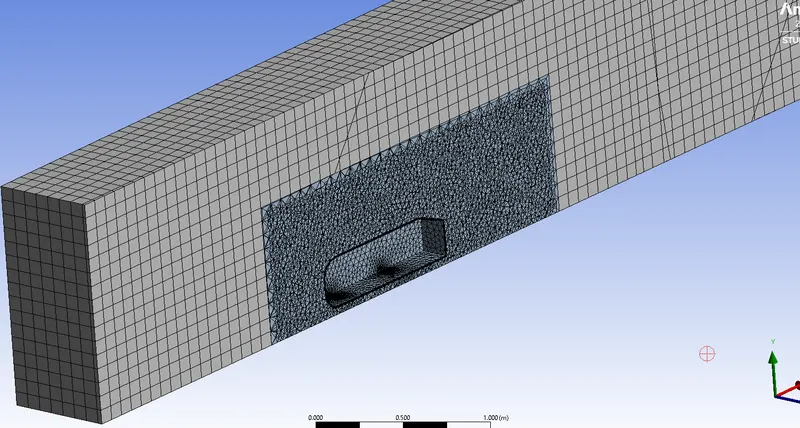
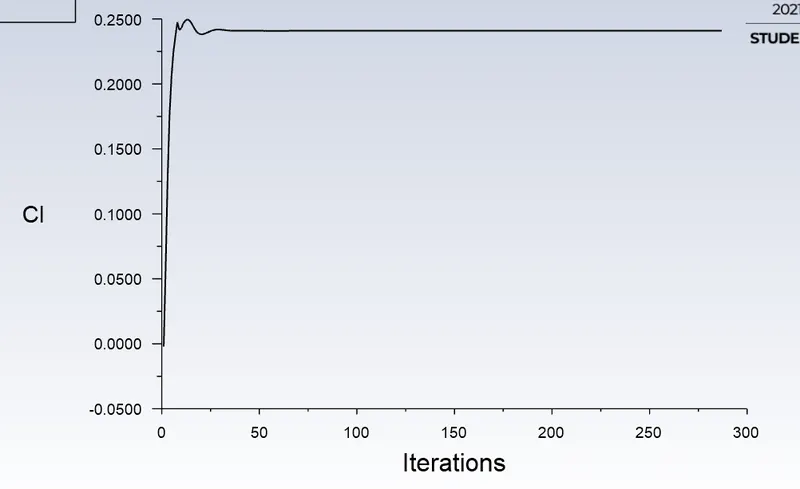
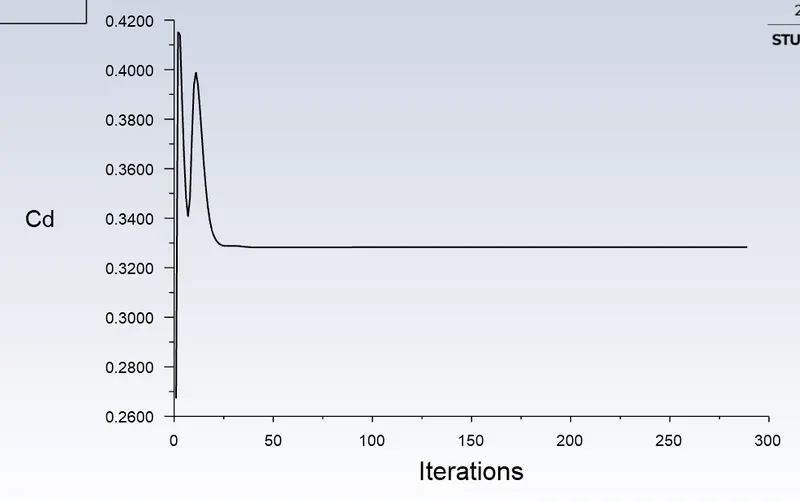
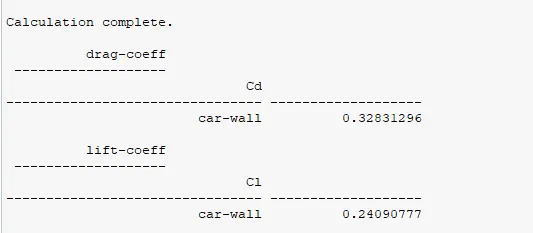 Coefficient of drag = 0.32 & Coefficient of Lift = 0.24
Q2. Explain the reason for the negative pressure in the wake region.
The Negative pressure in the wake region depends on the pressure gradient and vortex shedding at the rear end. When the air moves over the vehicle the flow takes place in such a way that it is separated at the rear end. Due to this separation, it leaves a large low-pressure turbulent region behind the vehicle known as the wake. This wake contributes to the formation of pressure drag, which eventually reduces the vehicle's performance.
The wake of an Ahmed body may be divided into high- and low-drag regimes where the rear slant angle (φ) is in the ranges of 12.5°–30° and larger than 30°, respectively. This work aims to gain a relatively thorough understanding of unsteady predominant coherent structures around an Ahmed body of φ = 35° in the low-drag regime. Extensive hot-wire, wall pressure, flow visualization, and particle image velocimetry measurements have been conducted at Reynolds number Re∈[0.3,2.7]×105">Re∈[0.3,2.7]×105Re∈[0.3,2.7]×105, based on the square root of the model's frontal area. A total of five distinct Strouhal numbers have been identified in the wake. One of them, Stw ≈ 0.30, is captured behind the vertical base, which is associated with the structures that emanate from the upper recirculation bubble and pinch off from the lower bubble, respectively. It is found that Stw scales with a characteristic length αS, which reflects physically the bubble size, and the Strouhal number Stw+">St+wStw+ based on αS is a constant 0.20, irrespective of the value of φ. A corner vortex rolling upstream is observed near the lower end of the slanted surface, whose formation mechanism and dynamical role are discussed. The Reynolds-number effect on the flow is also documented. Based on the present and previously reported data, a conceptual flow structure model is proposed for a low-drag Ahmed body, including both steady and unsteady coherent structures around the body.
Q3. significance of the point of separation.
Separation takes place due to excessive momentum loss near the wall in a boundary layer trying to move downstream against increasing pressure, i.e., which is called adverse pressure gradient.
With high-speed computers, the boundary layer equations for Lamina flow can be solved exactly, and consequently, the laminar separation point can be determined almost exactly. In addition, there are several “simple” methods that do not require the solution of the boundary layer equations in their differential form and that can be used to predict the separation point quite satisfactorily.
The accuracy of calculating the flow separation point in turbulent flows has been investigated by Cebeci et al. In that study, several experimental pressure distributions that include observed or measured boundary layer separation were considered. The CS method (the differential method of Cebeci-Smith, Chapter 8), Head's, Stratford's, and Goldschmidt's methods were evaluated. Before we present a sample of results from that study, it is important to note that near separation the behavior of these methods with an experimental pressure distribution is quite different from that with inviscid pressure distribution. The following are the observation that is handy to comprehend samples.
- The pressure distribution near the point of separation may be a characteristic of the phenomenon of separation, and its inclusion of it in the specification of the flow is equivalent to being told the position of separation.
- For this reason, the use of these separation-prediction methods with an experimental pressure distribution will only show their behavior close to separation and indicate whether the theoretical assumptions used in the methods are self-consistent.
- When one considers an experimental pressure distribution with separation and uses the CS method, it is quite possible that the wall shear stress at the experimental separation point may not reach zero. It may decrease as the separation point is approached and may then start to increase thereafter.
Separation Point - an overview | ScienceDirect Topics
References:
Aerodynamics: Flow around the Ahmed Body | SimScale
Ahmed Body TCFD Simulation Benchmark (cfdsupport.com)
Flow structure around a low-drag Ahmed body | Journal of Fluid Mechanics | Cambridge Core
- Kandibanda Akhilhow to get ideal temperature source.