Challenge on Combustion
Aim: To perform a combustion simulation on the combustor model and plot the variation of the mass fraction of different species.
Objective:
Part I
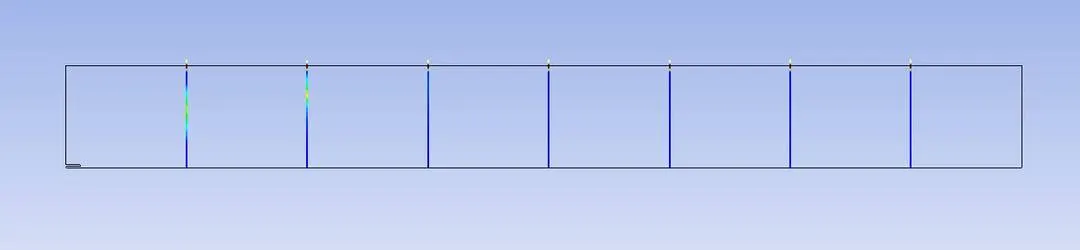
Perform a combustion simulation on the combustor model and plot the variation of the mass fraction of the different species’ in the simulation using line probes at different locations of the combustor as shown in Fig. You need to plot for CO2, H2O, CH4, N2, O2, NOx emissions & Soot formation.
Part II
As you must have observed from the above simulation, the Nox and soot is getting formed at the outlet of the combustor. Such formation has harmful effects on the environment and humans. The stringent government norms also demand the least formation of Nox and soot and to satisfy those requirements, you need to check the effect of adding the water in the fuel.
In this part, you need to add the water content in the fuel from 5% to 30% by mole and observe the effect of it on the results. It is necessary to provide line plots and contours to prove your claim.
You can use the parametric study approach if required.
Introduction:
In this project the agenda is to check the mass fraction of different species such as 02,N2,h20,ch4,Nox and soot formation that the after products of a combustor of which some species such as Co2,soot and Nox has detrimental effects on environment and human health.
Theory:
Combustion is a process where fuel or combustible substances is burned in the presence of oxygen and after burnt gases are released into the atmosphere. Due to combustion heat energy is released.In combustion of methane with air leads to a near temperature around 2100 kelvin and major carbon dioxide and water is produced as a primary after burnt substances along with many other species. These species like Co2,CO,NOx are harmful to atmosphere and humans.
Workflow:
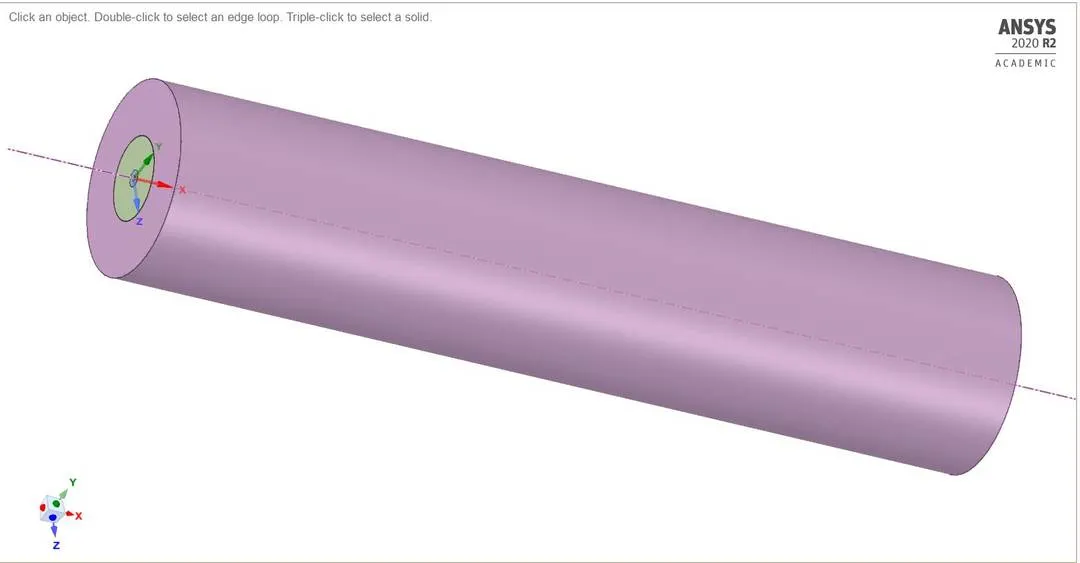
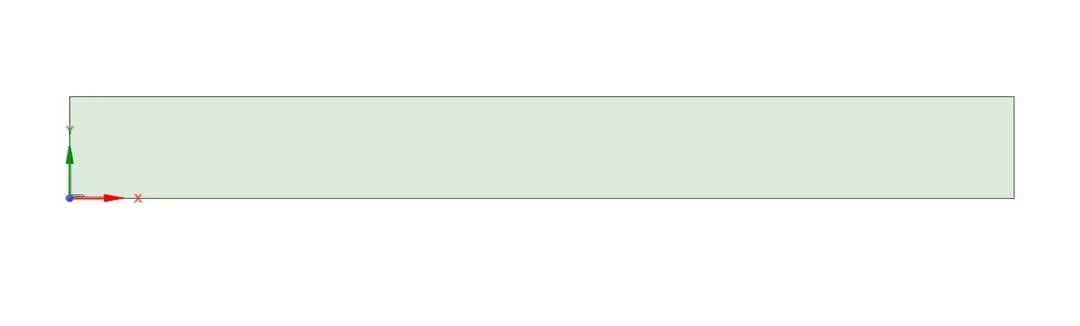
- Import model into spaceclaim and make a 2d geometry.
- Mesh the model and assign named selection.
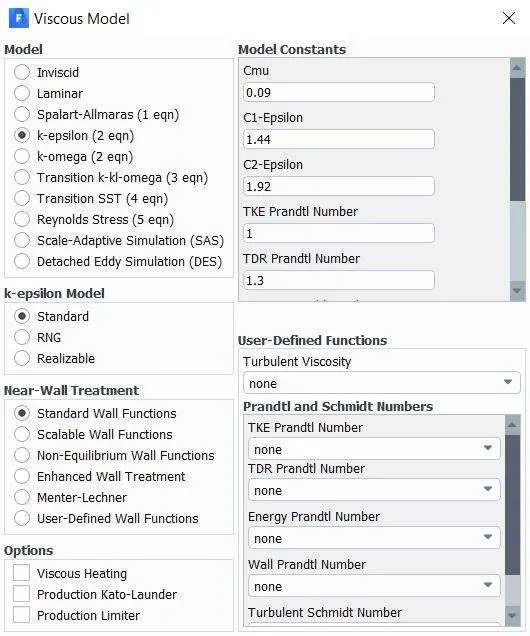
- Setup the steady state simulation with species on and k-epsilon turbulence model.
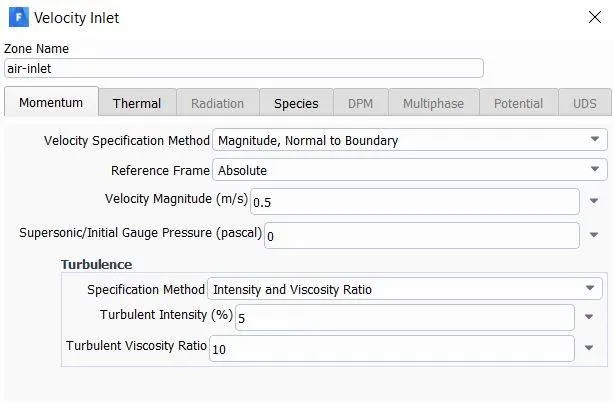
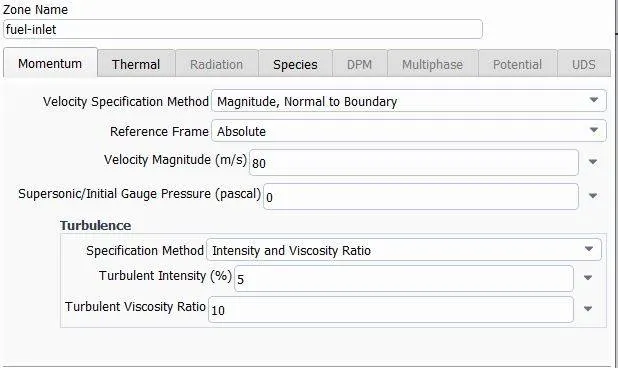
- Intake fuel at 80m/s and intake air at 0.5 m/s with methane and air inlet.
- Post process the results for mass fraction of species.
Model:
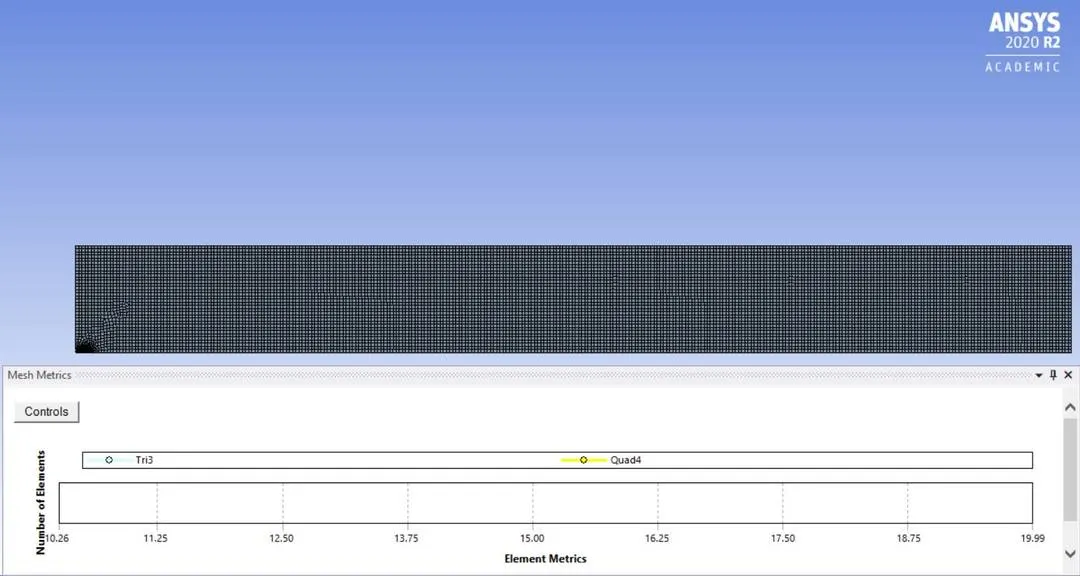
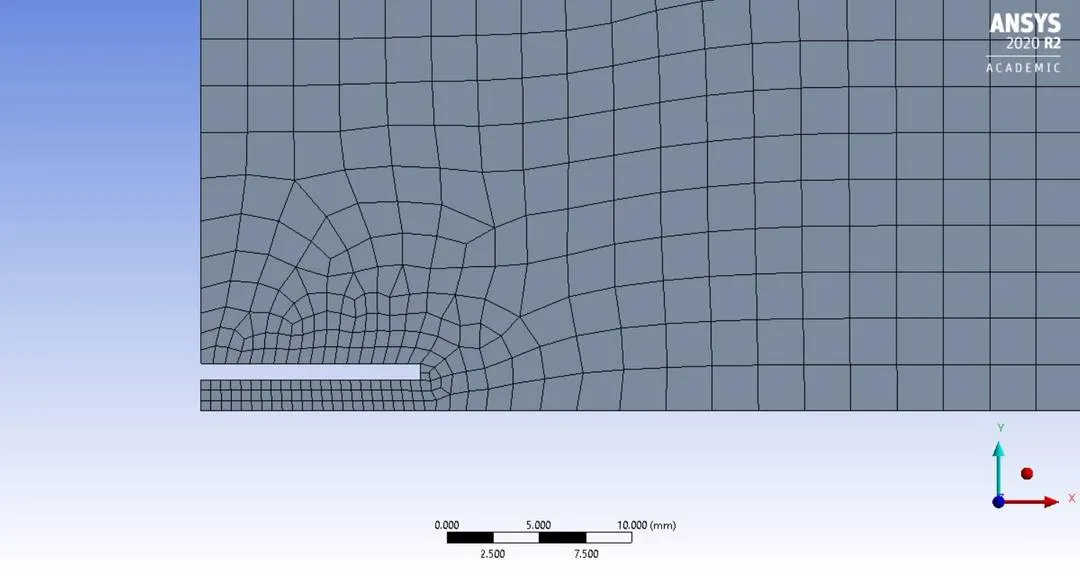
Mesh:
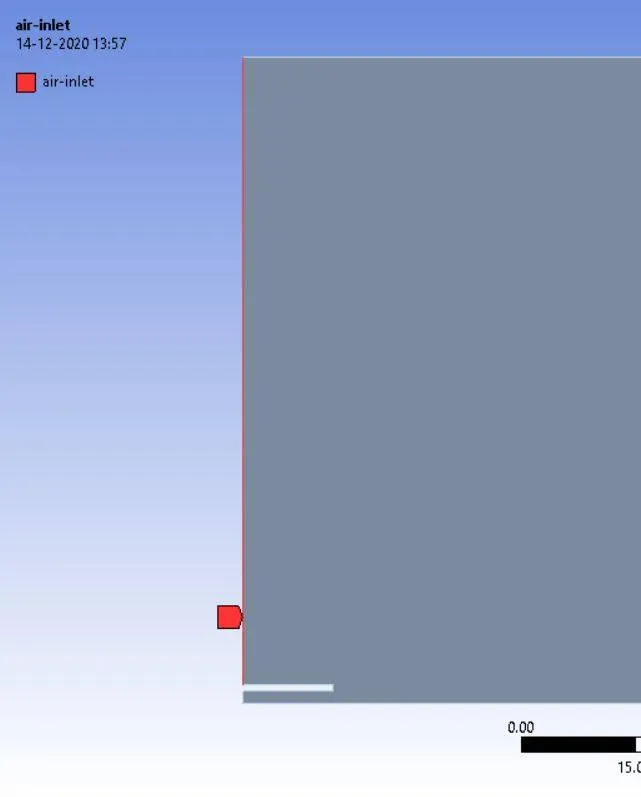
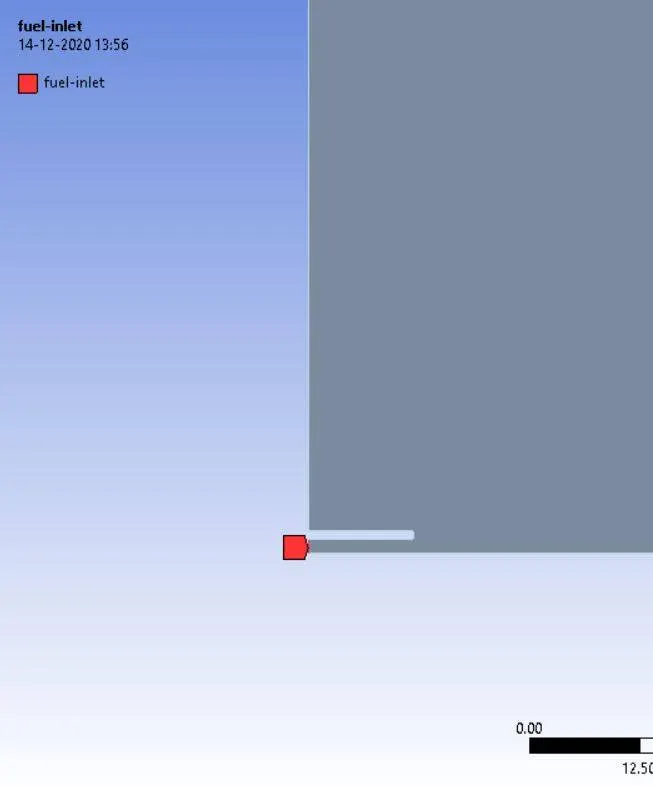
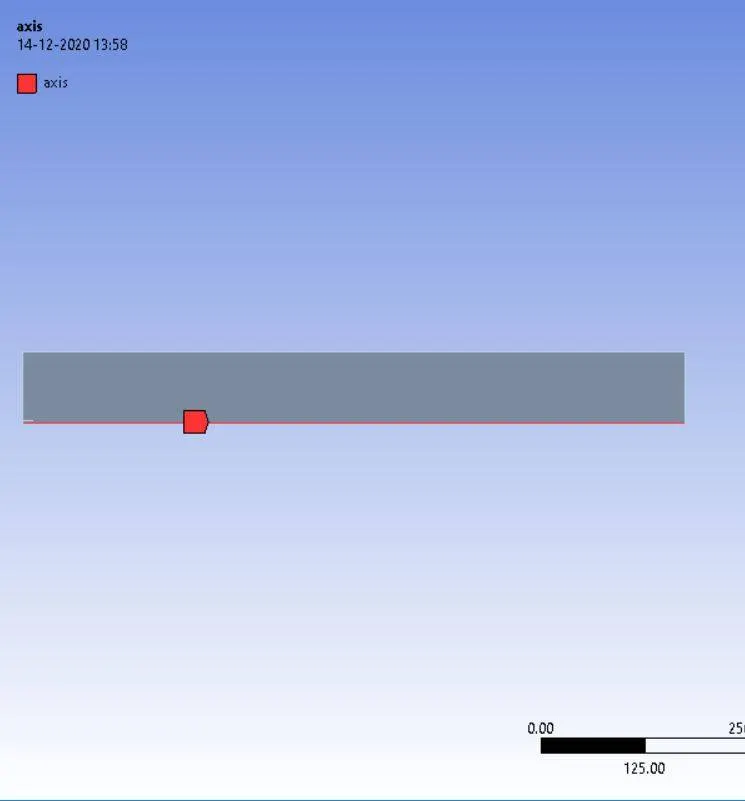
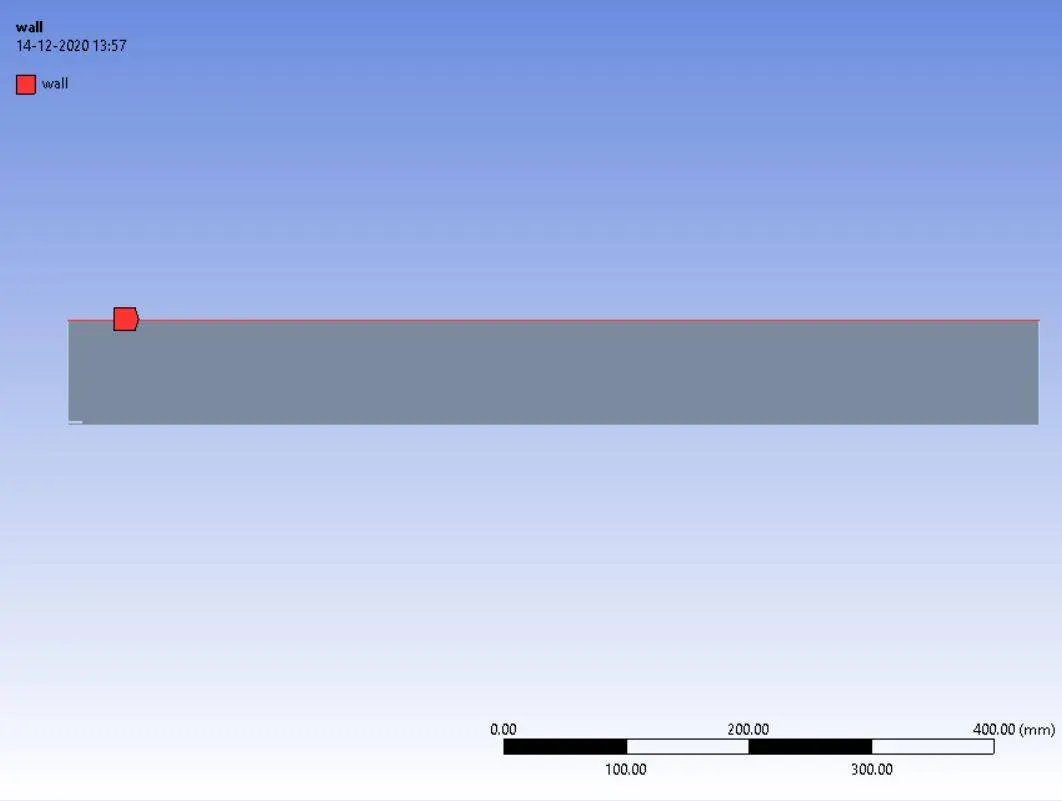
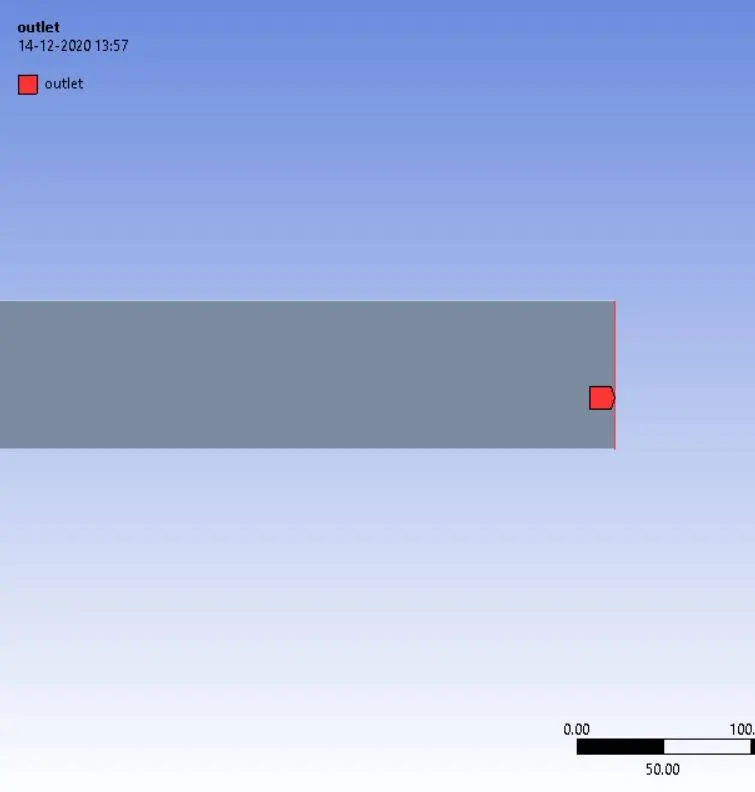
Named selections:
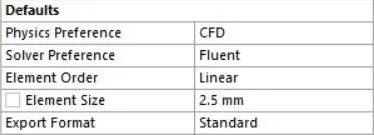
Mesh:

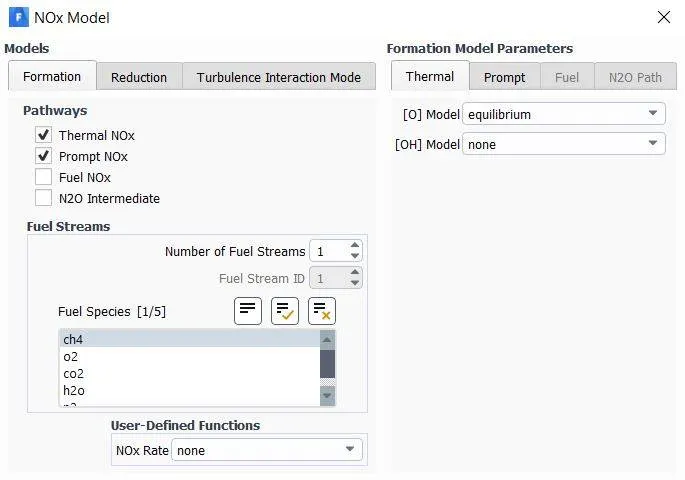
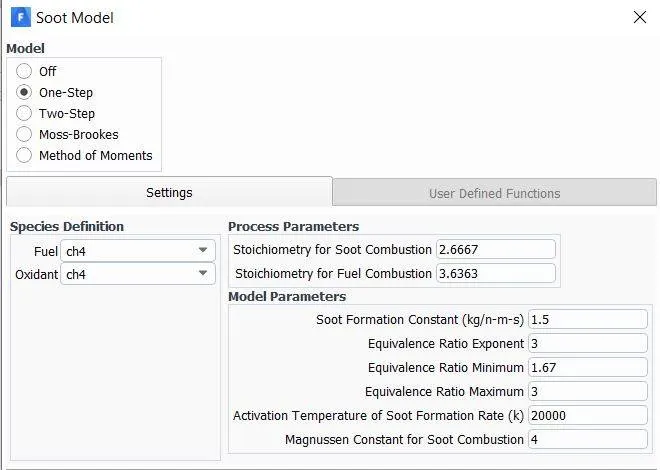
Common Fluent setup:
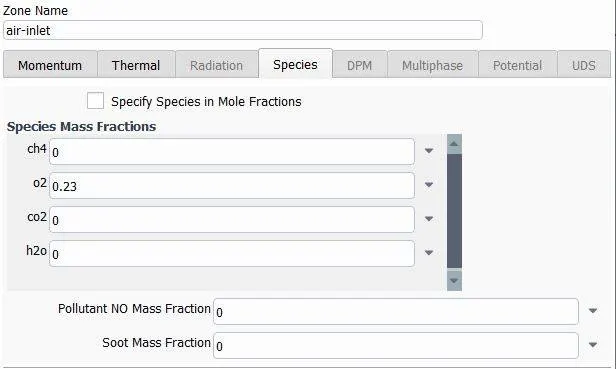
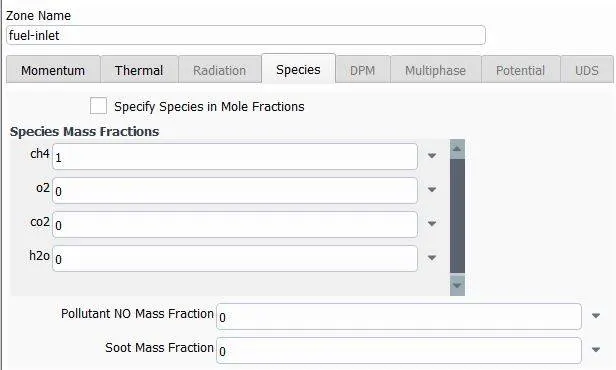
Boundary conditions:
Line Probe:
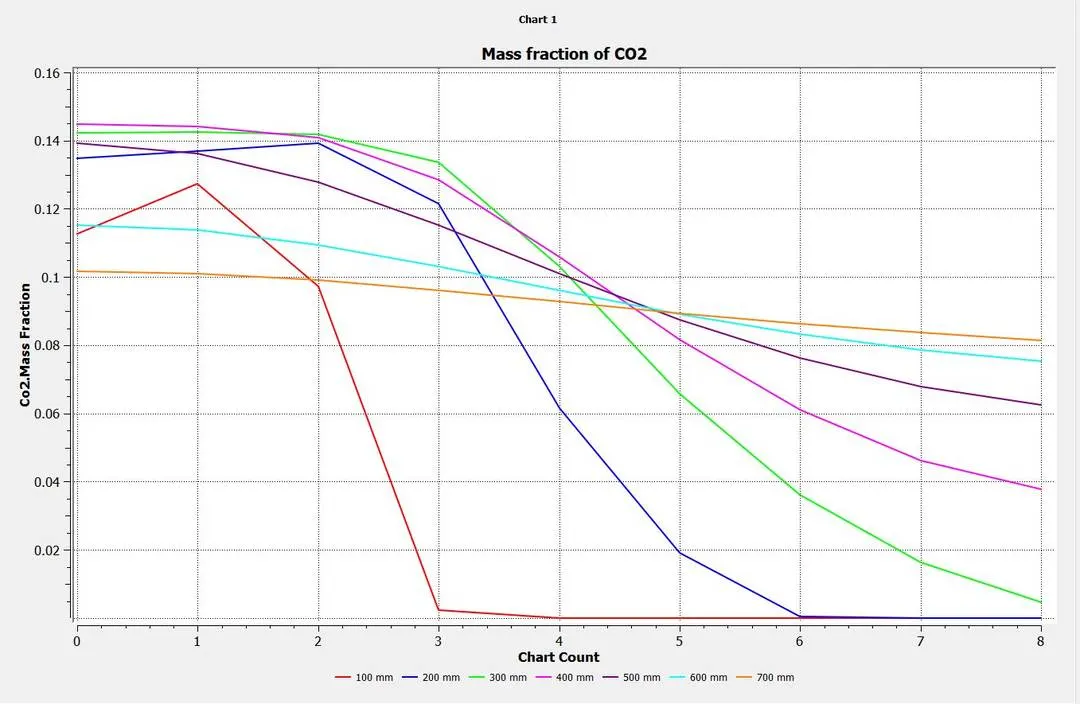
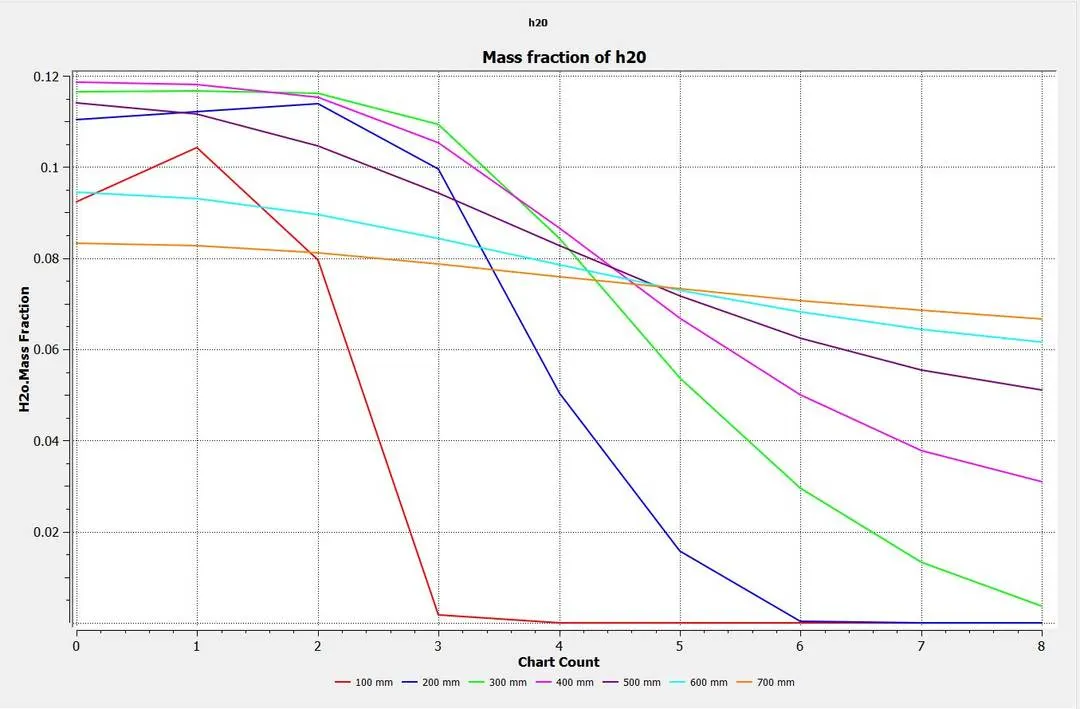
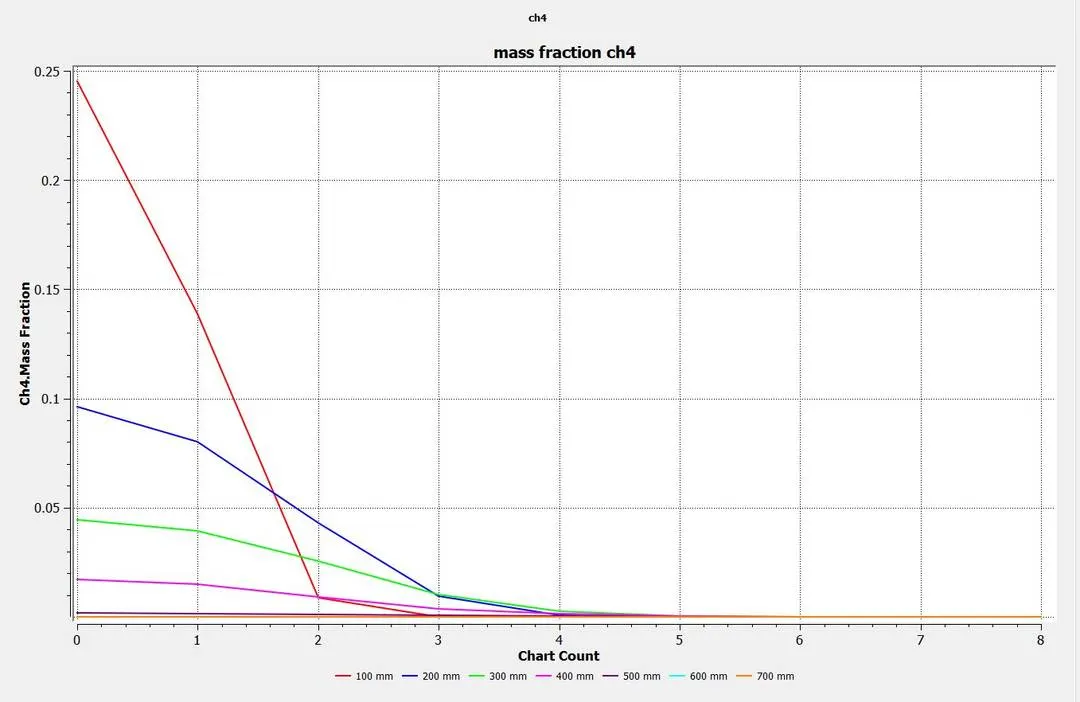
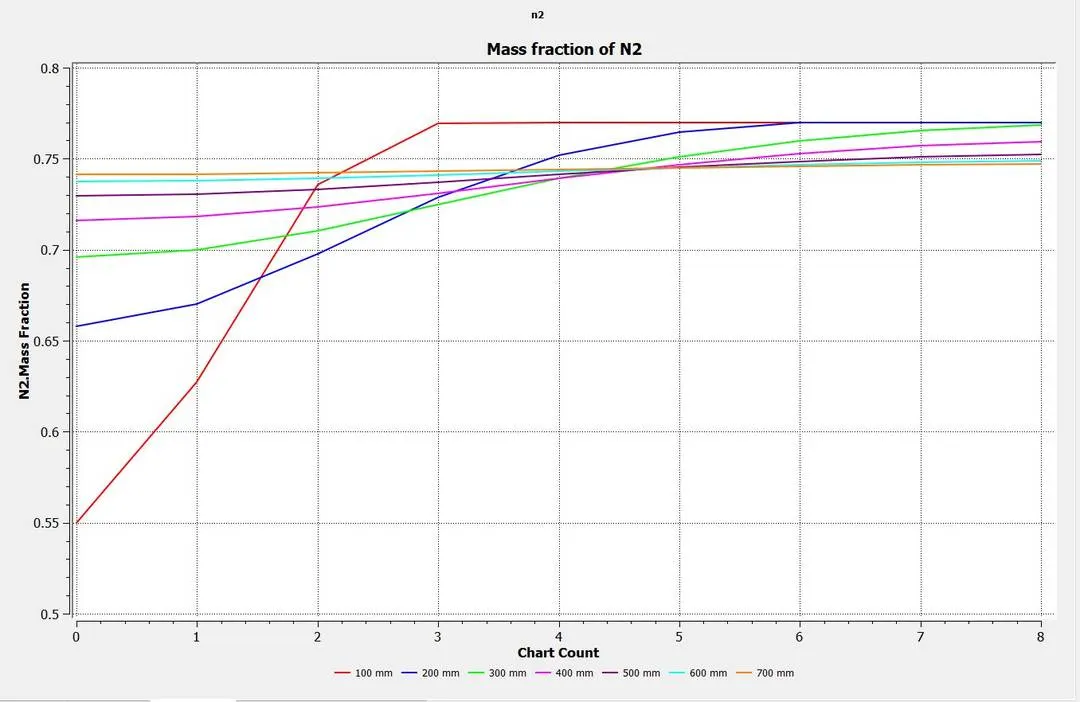
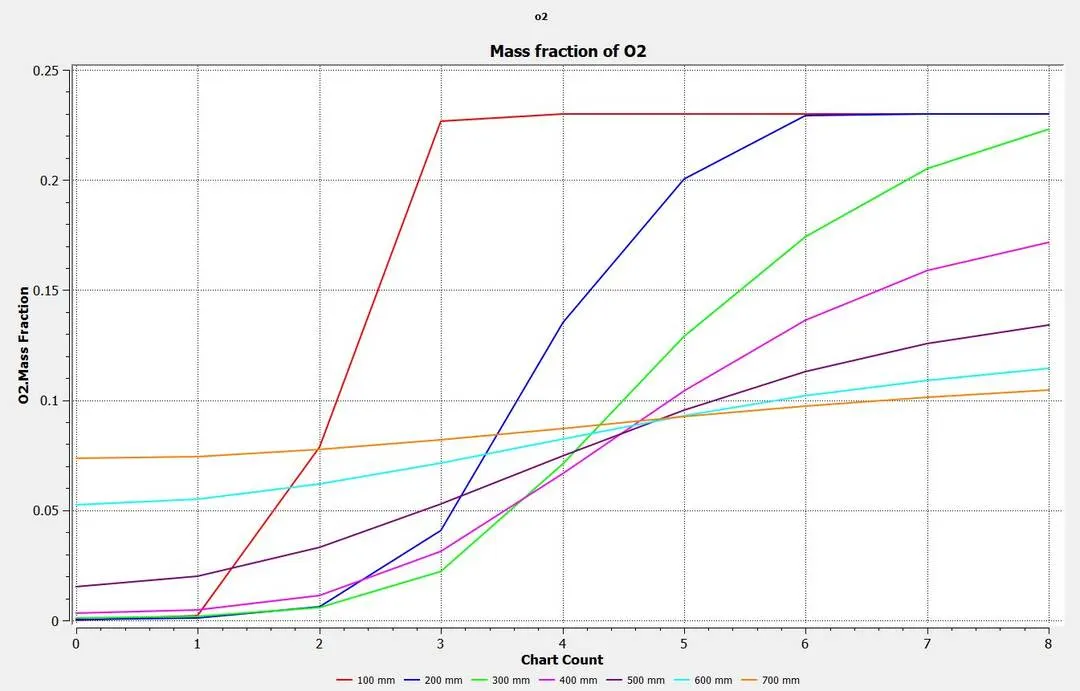
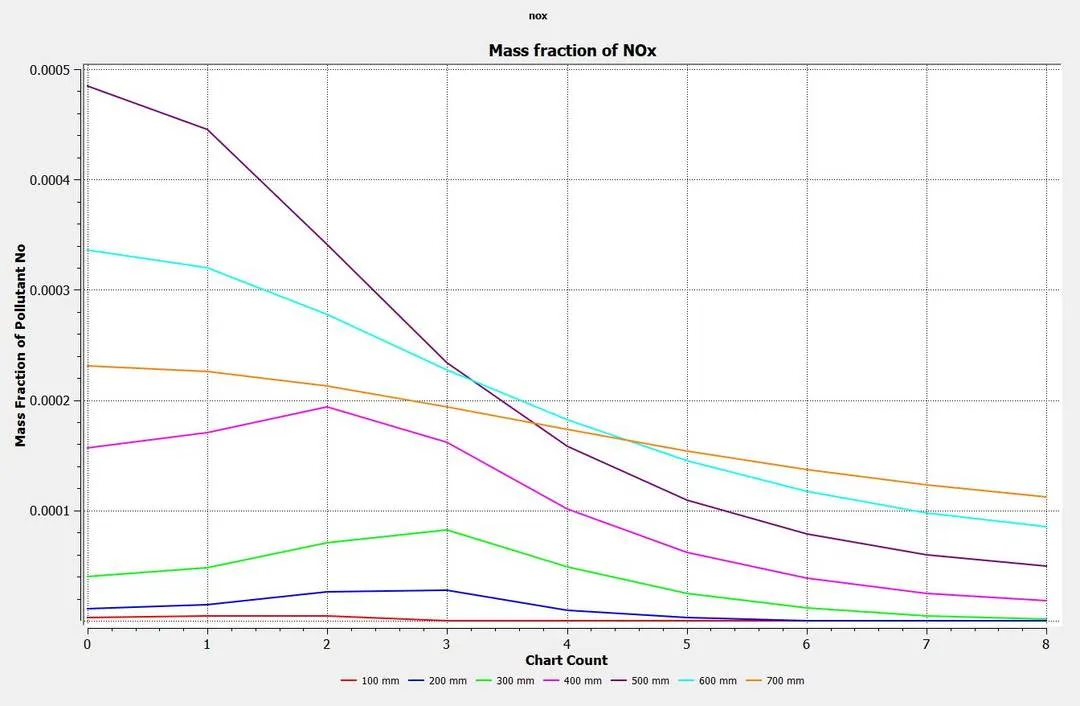
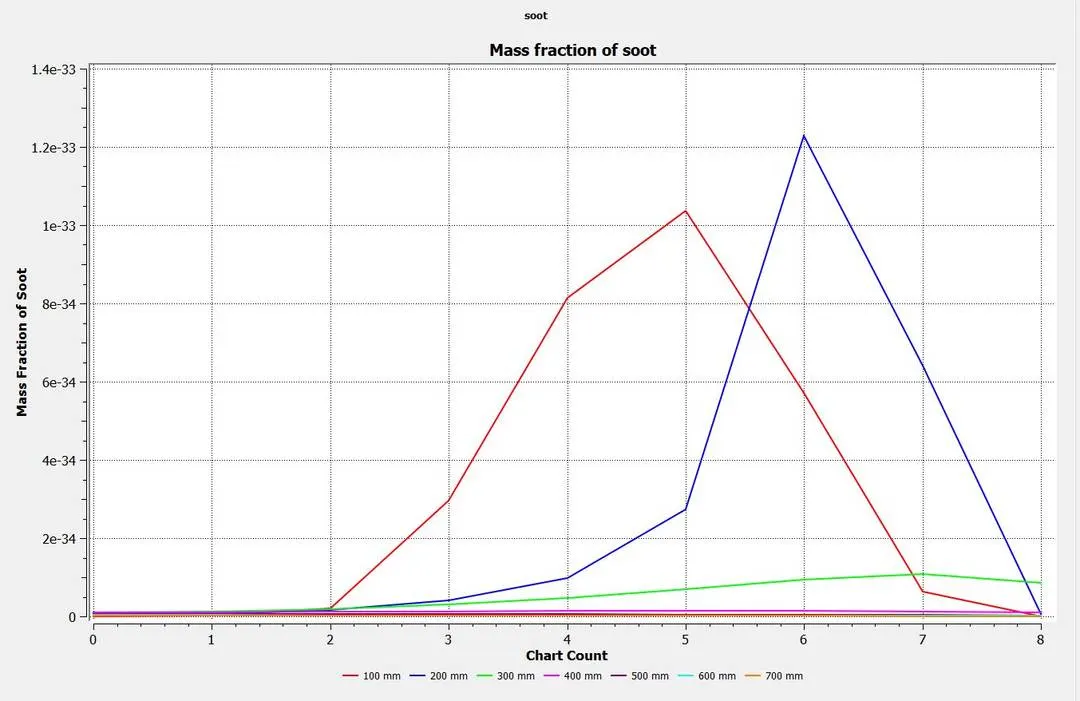
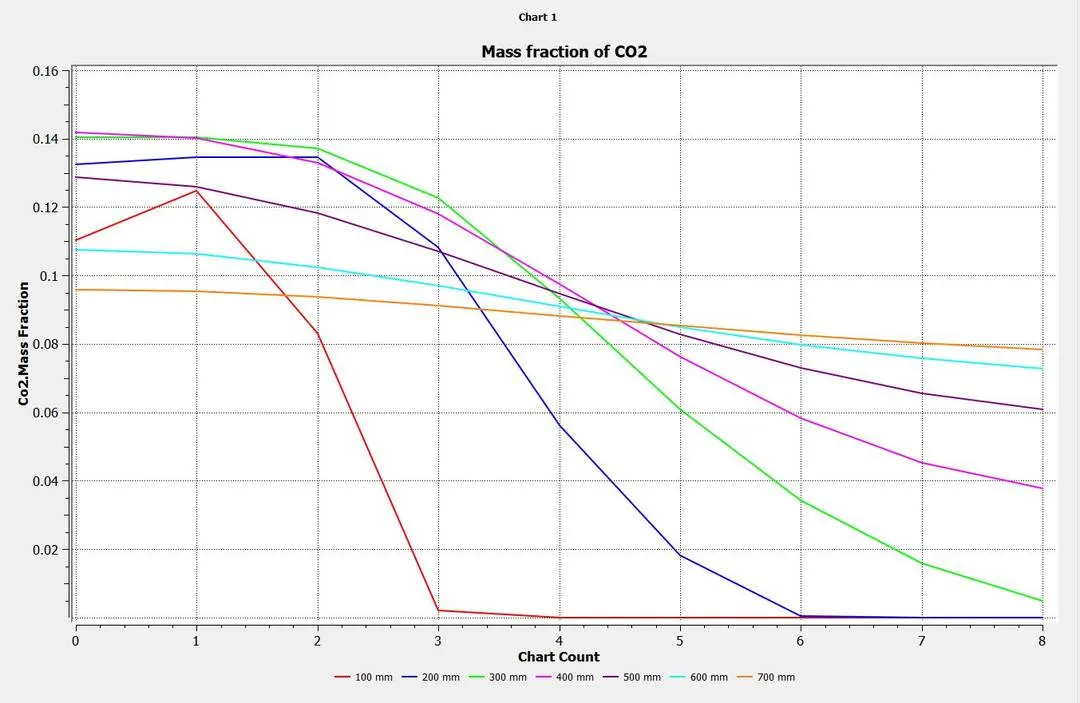
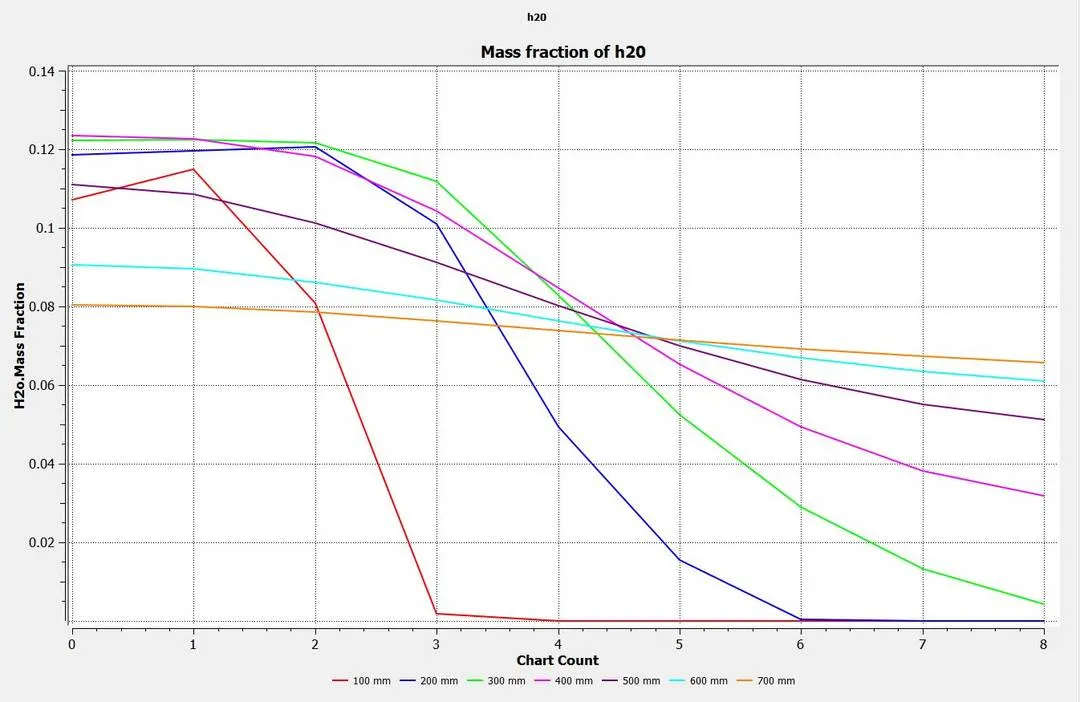
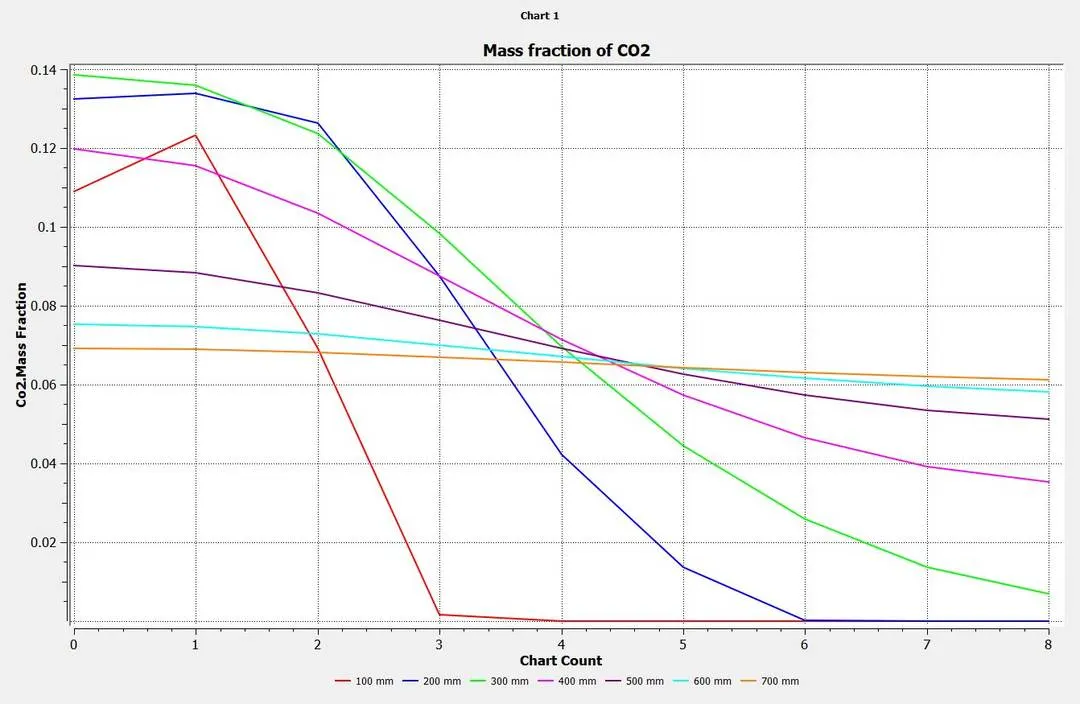
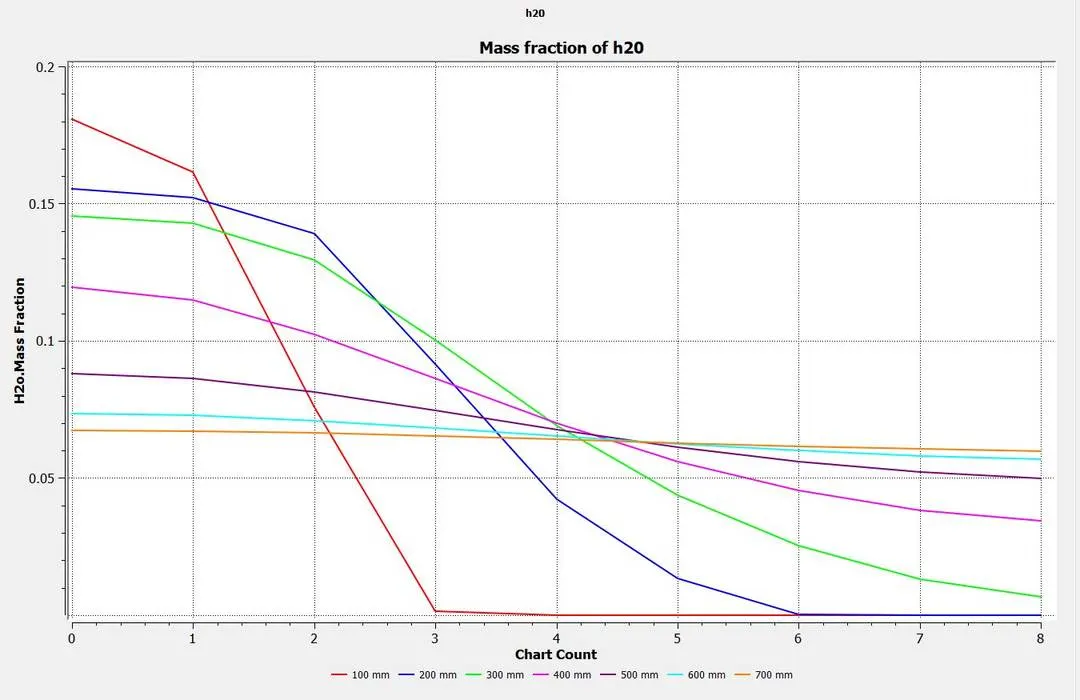
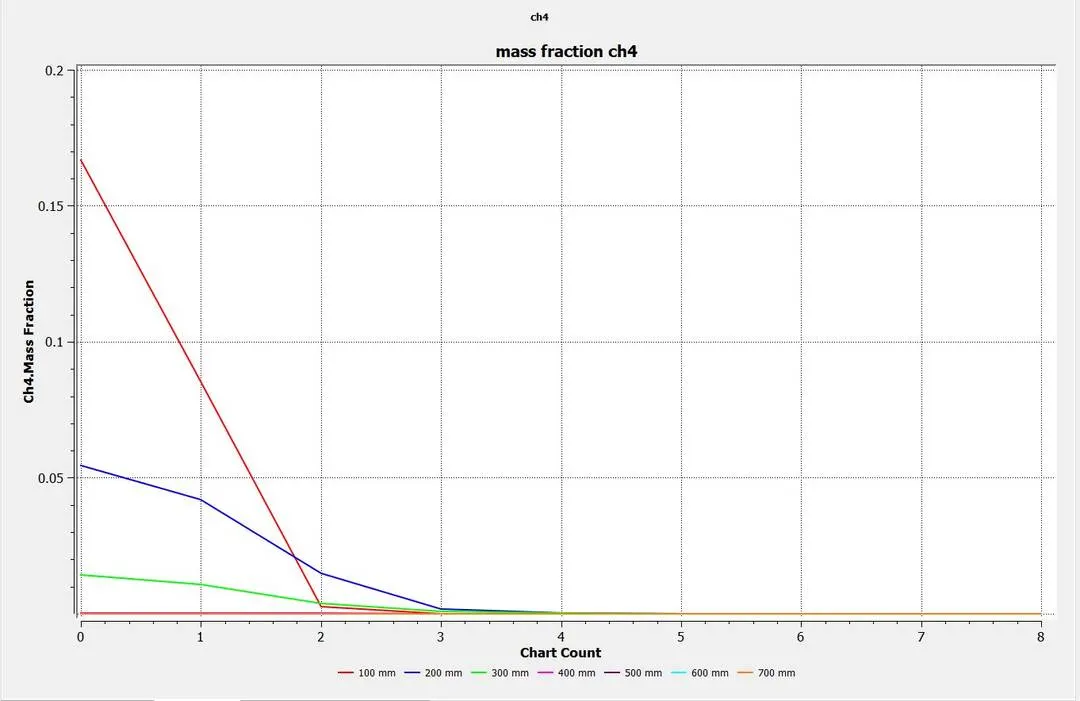
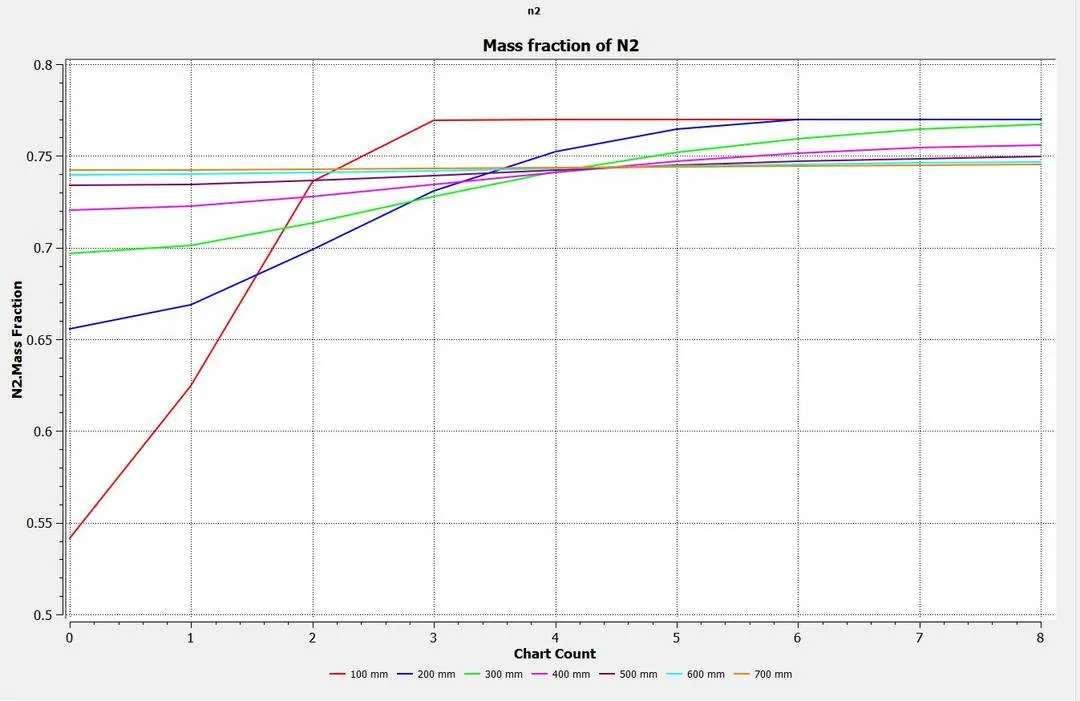
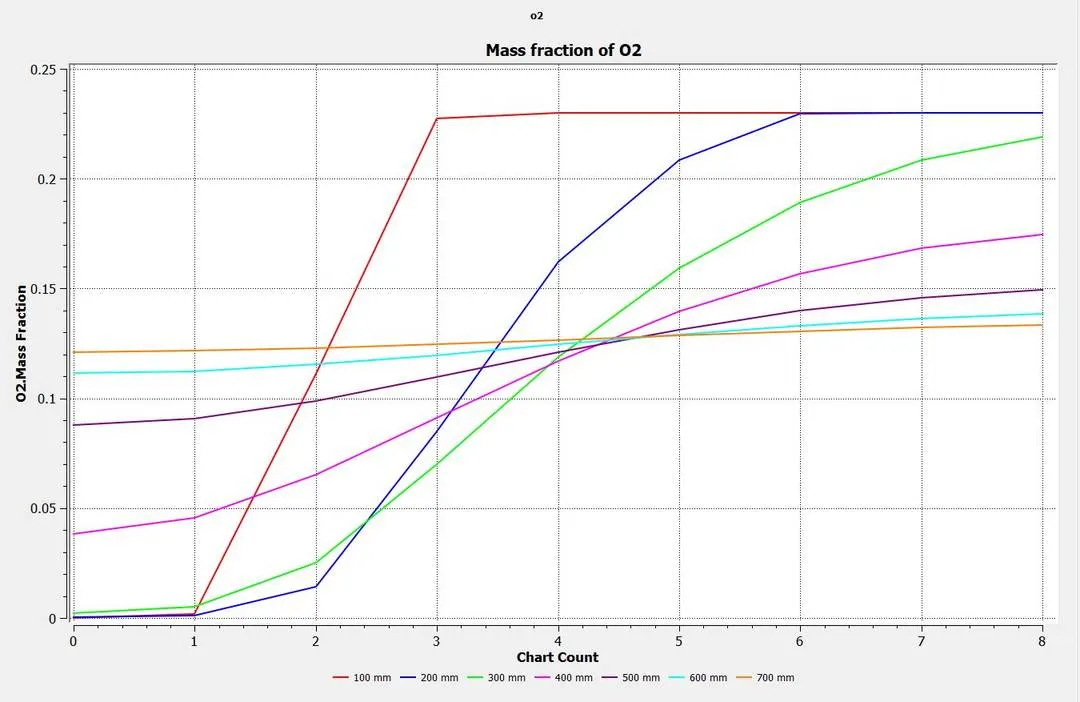
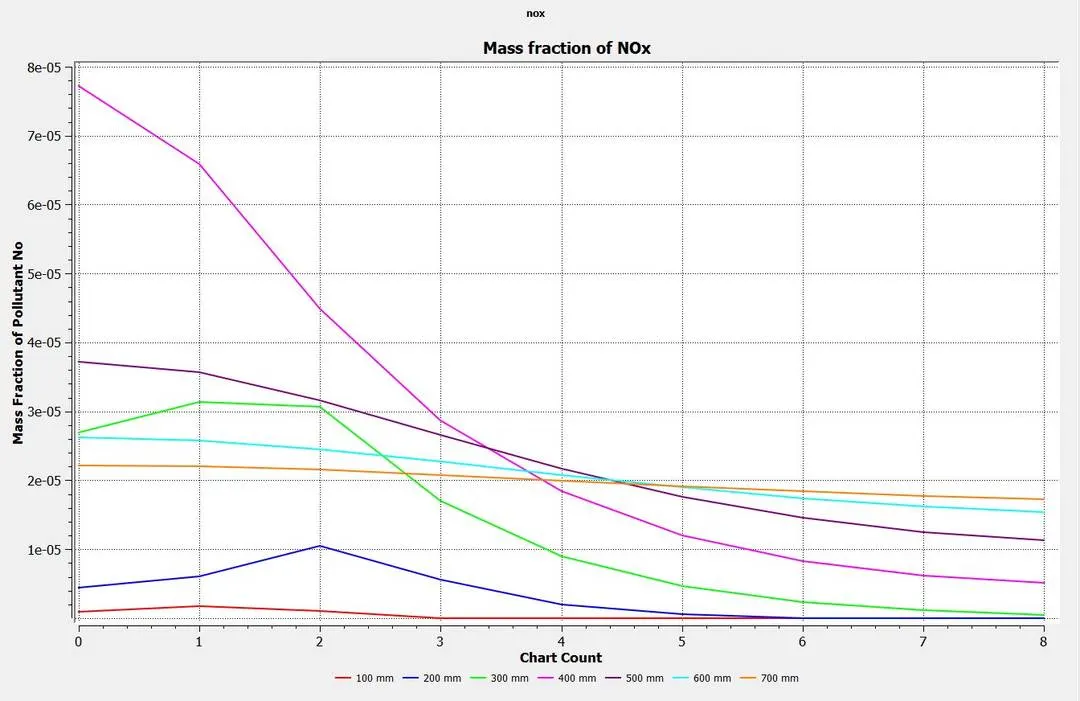
x=100mm,200mm,300mm,400mm,500mm,600mm,700mm
------------------------------------------------------------------------------------------------------------Part 1-----------------------------------------------------------------------------------------------
Part 1:Perform a combustion simulation on the combustor model and plot the variation of the mass fraction of the different species’ in the simulation using line probes at different locations of the combustor .we need to plot for CO2, H2O, CH4, N2, O2, NOx emissions & Soot formation
The simulation is setup for steady state, pressure based solver with k-epsilon turbulence model.
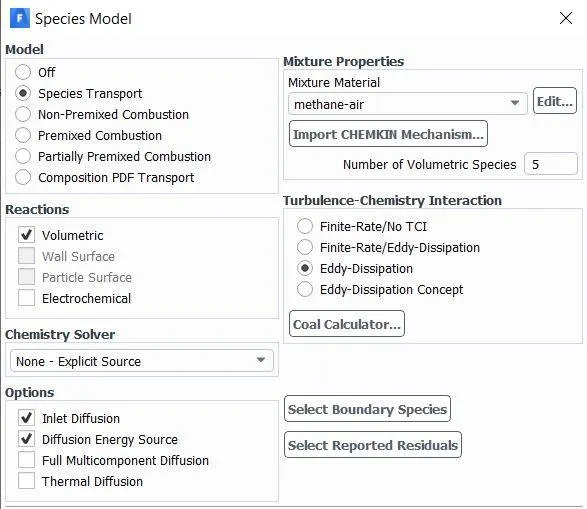
The species model with species transport is chosen. inlet and diffusion energy source is enabled.
Methane-air is chosen as mixture. Turbulent chemistry interaction is set to eddy dissipiation.
Results:
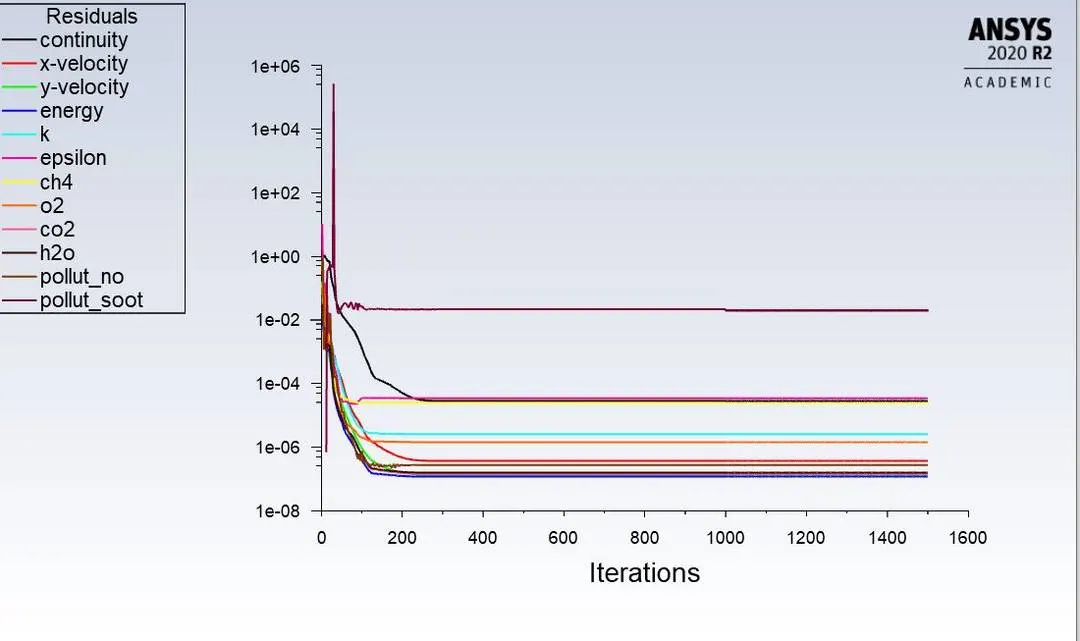
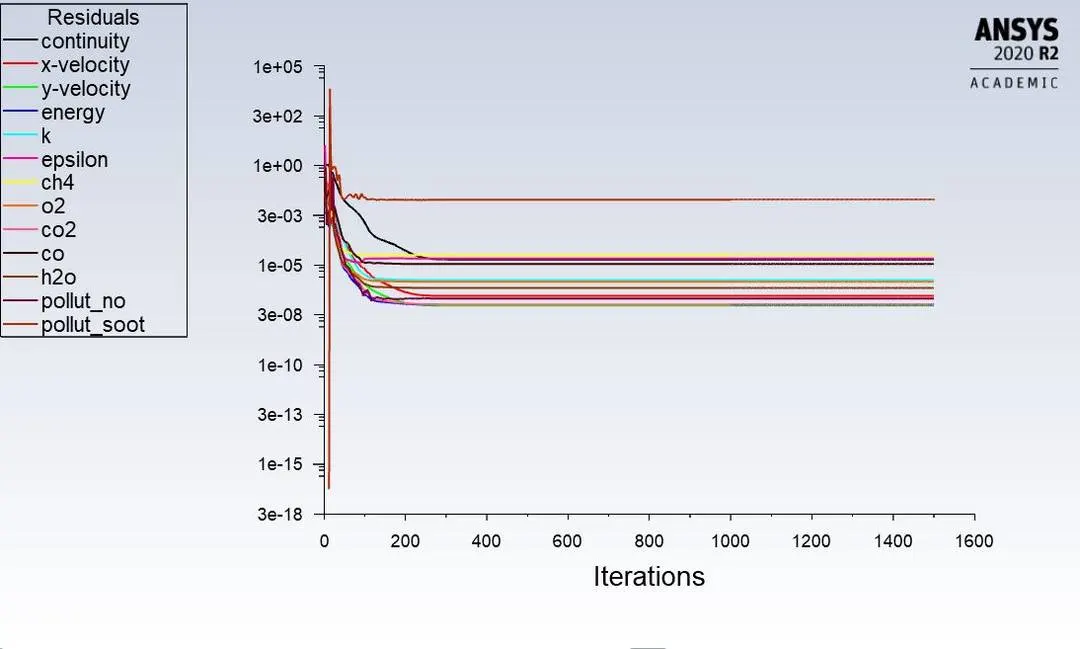
Residuals:
Mass fraction Results:
Carbon dioxide CO2:
contour:
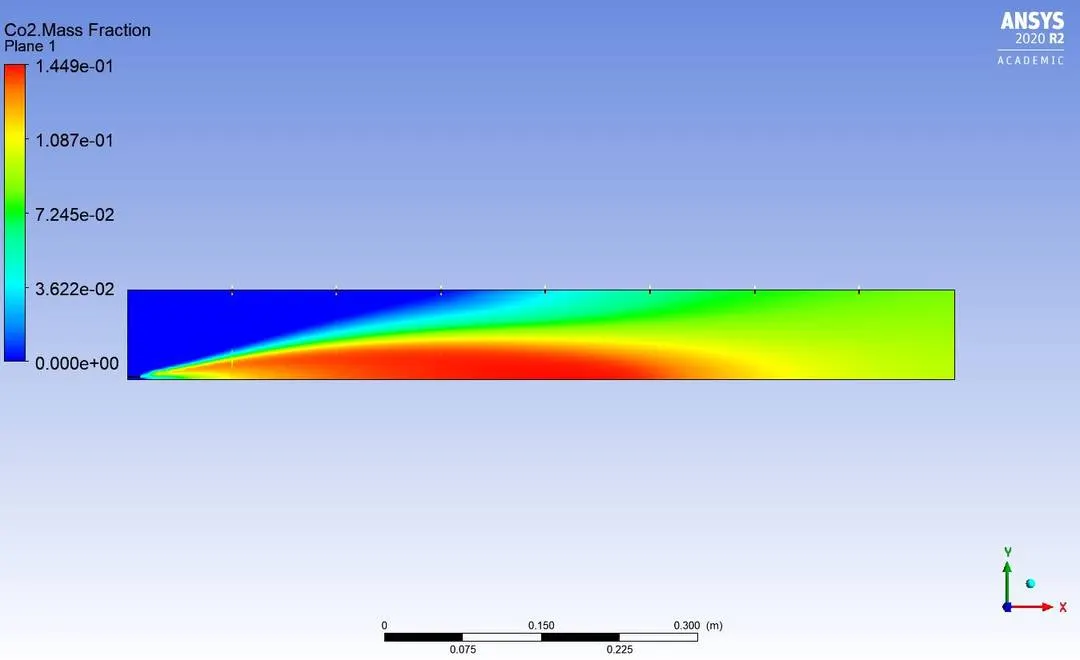
Plot:
Water H20:
Contour:
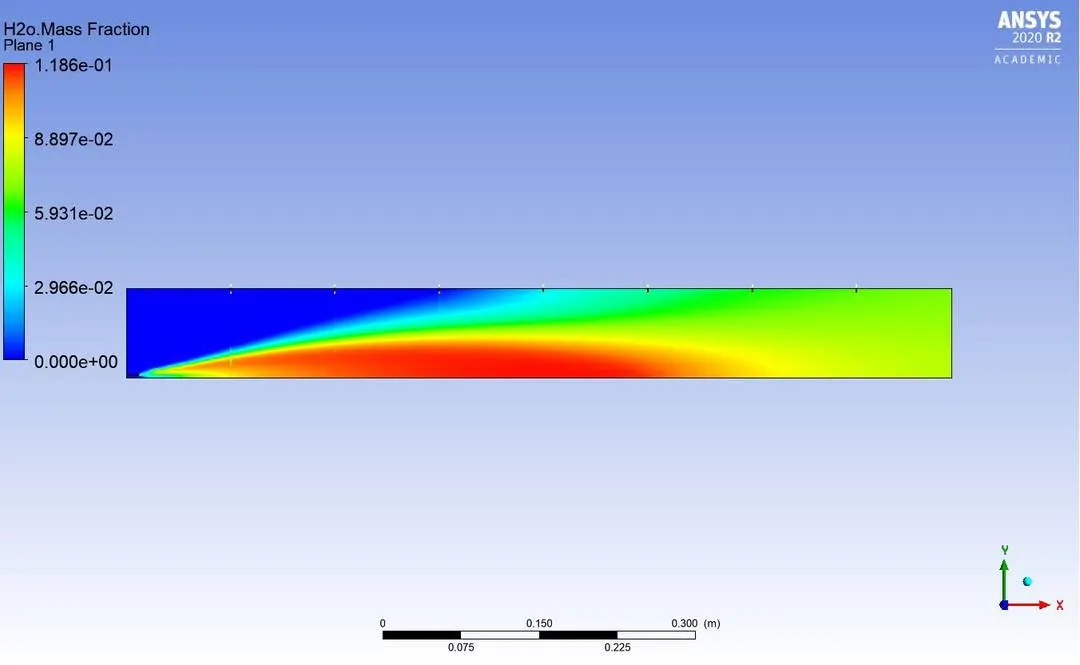
plot:
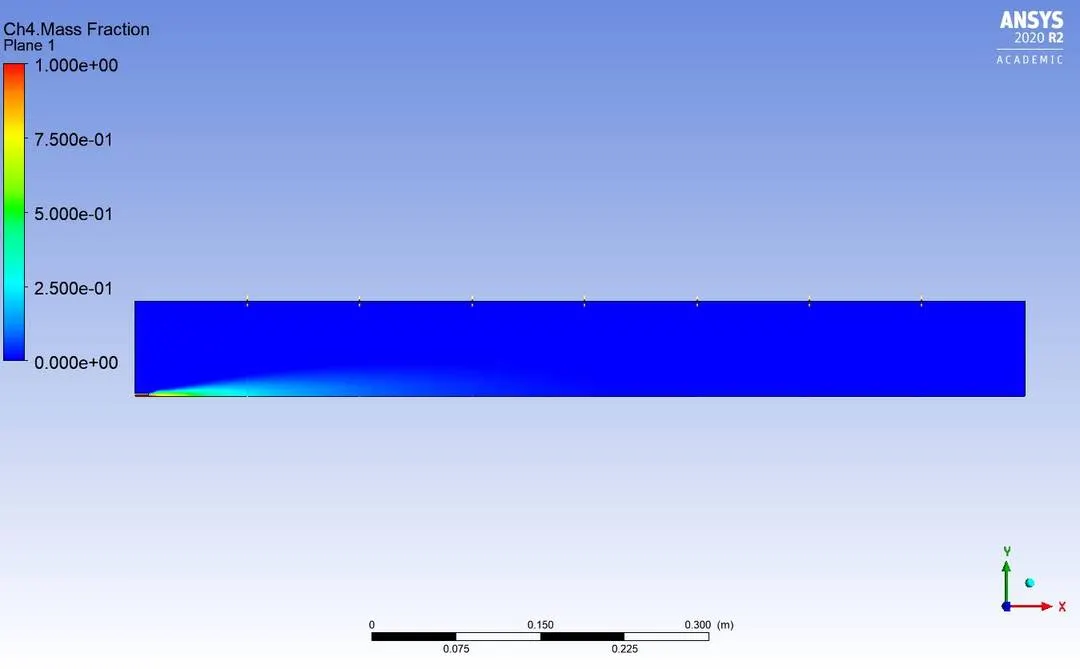
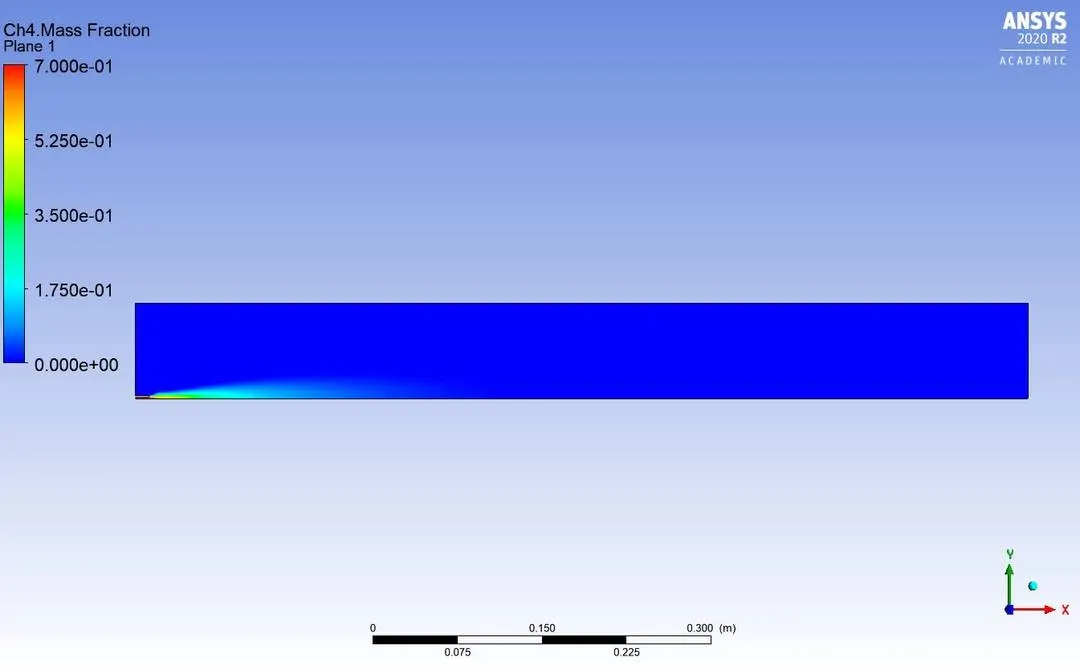
Methane CH4:
contour:
Plot:
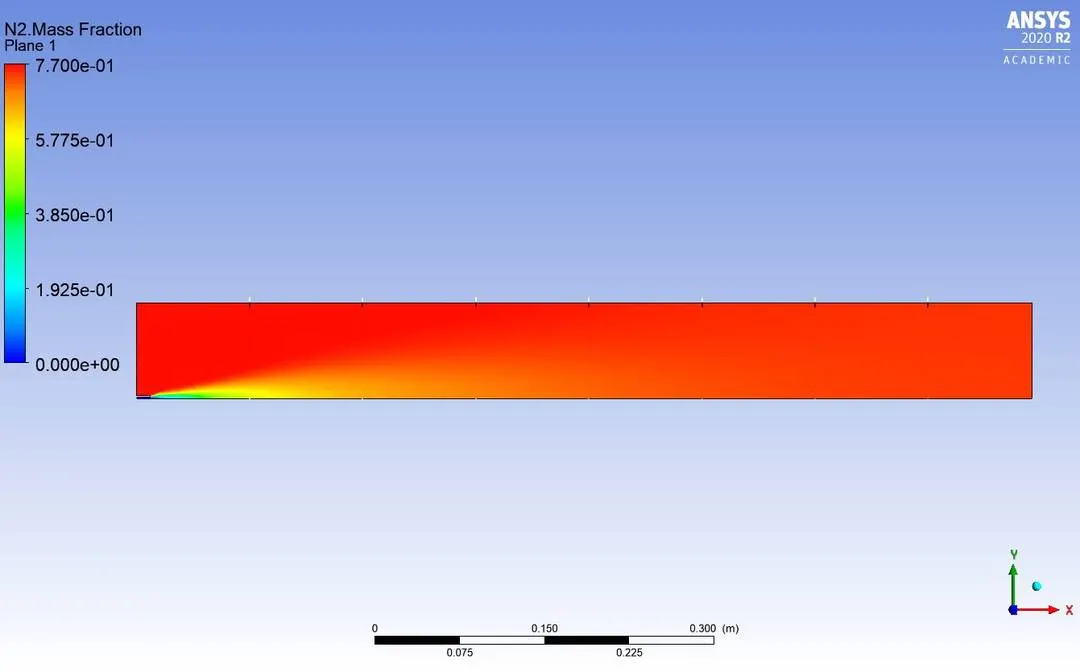
Nitrogen N2:
Contour:
Plot:
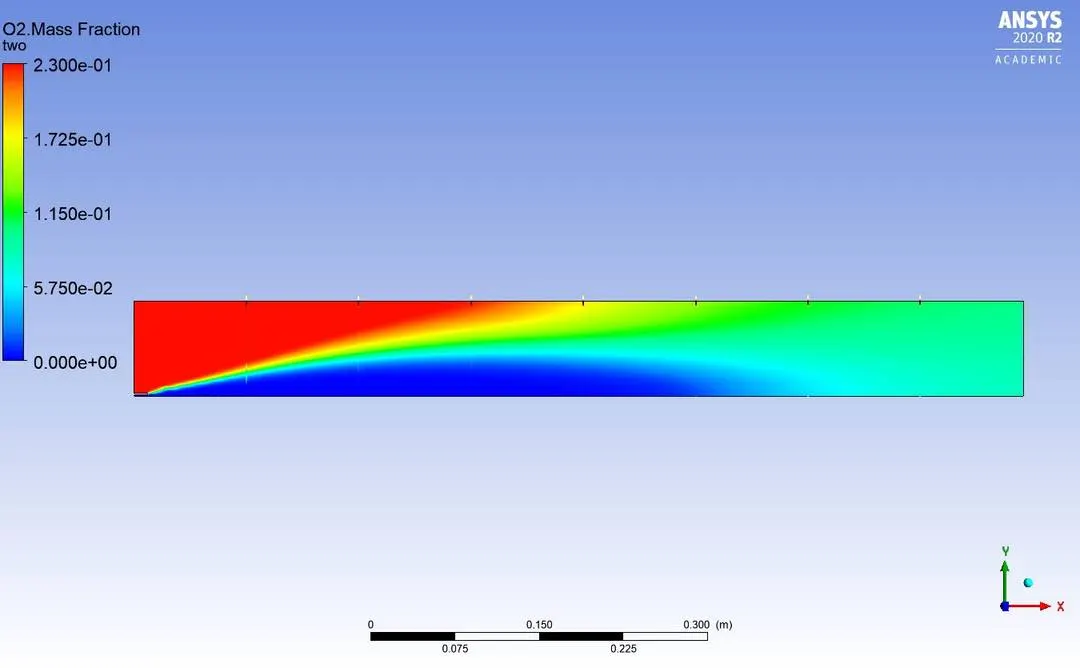
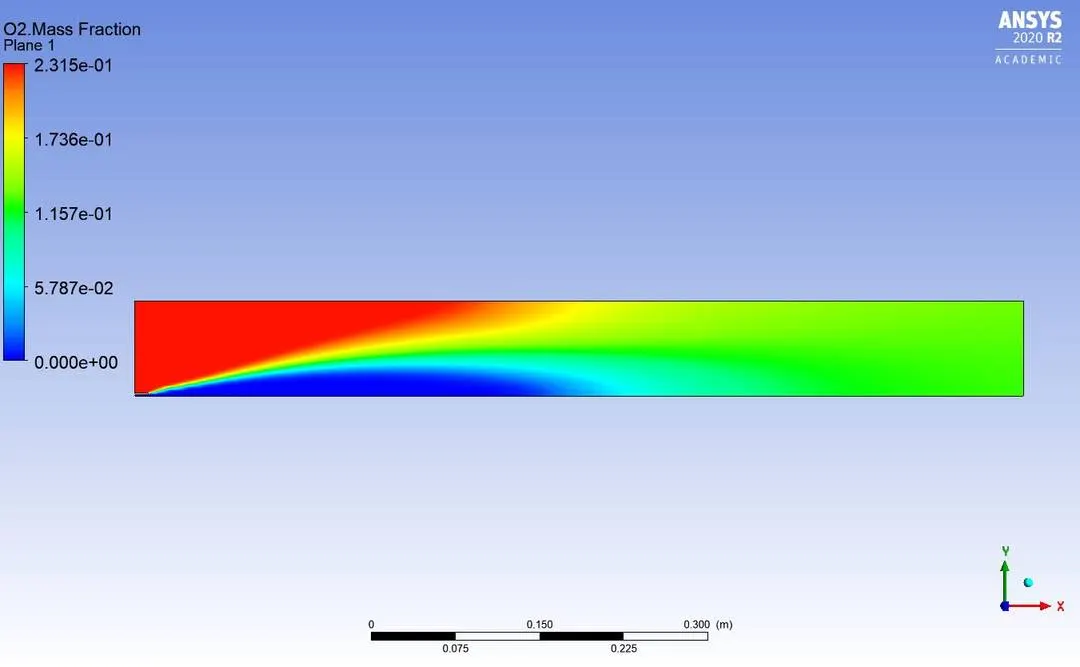
Oxygen O2:
Contour:
Plot:
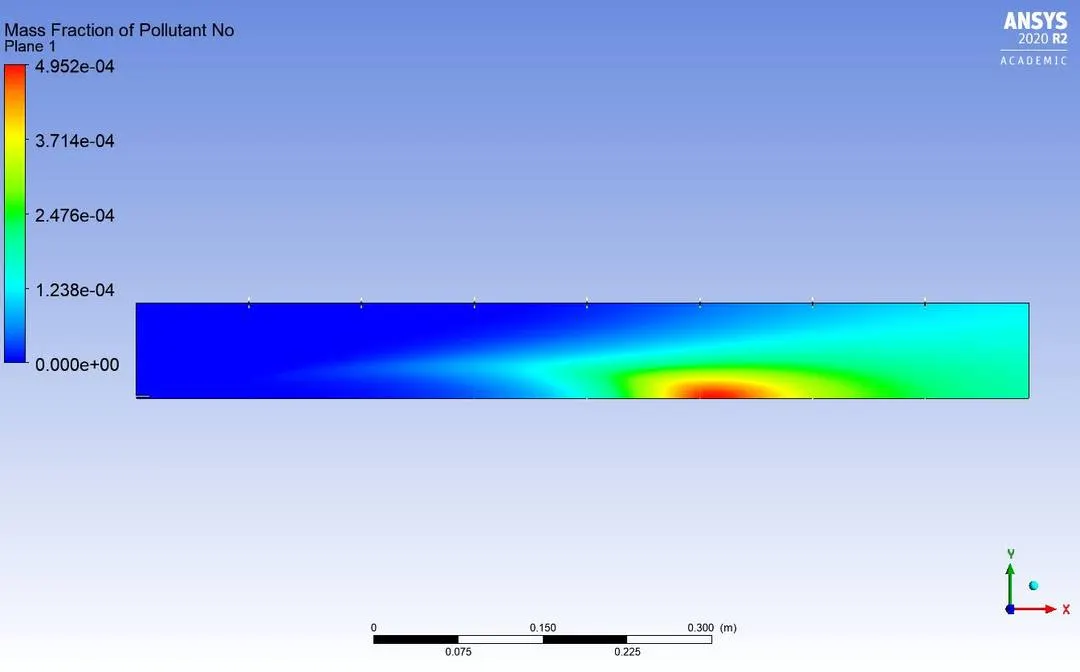
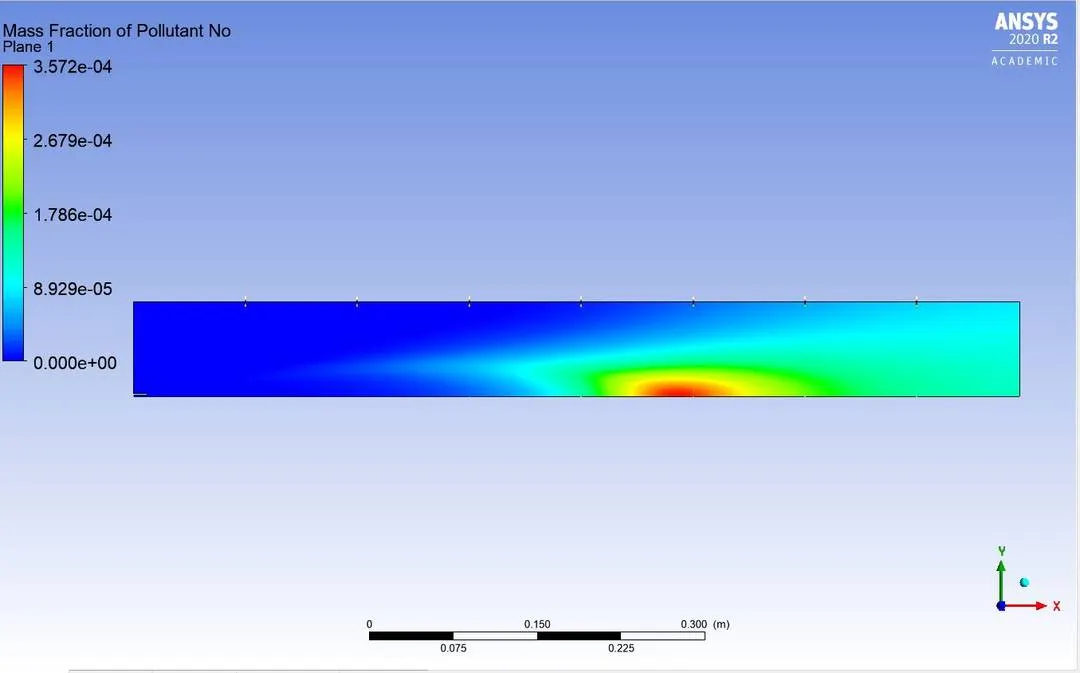
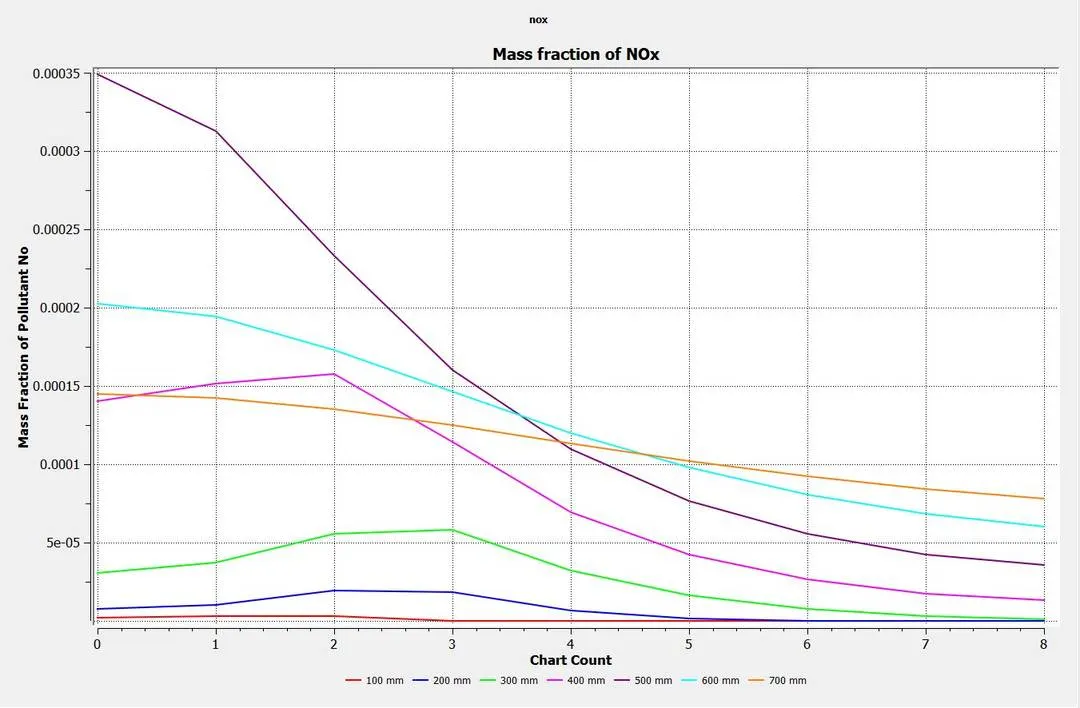
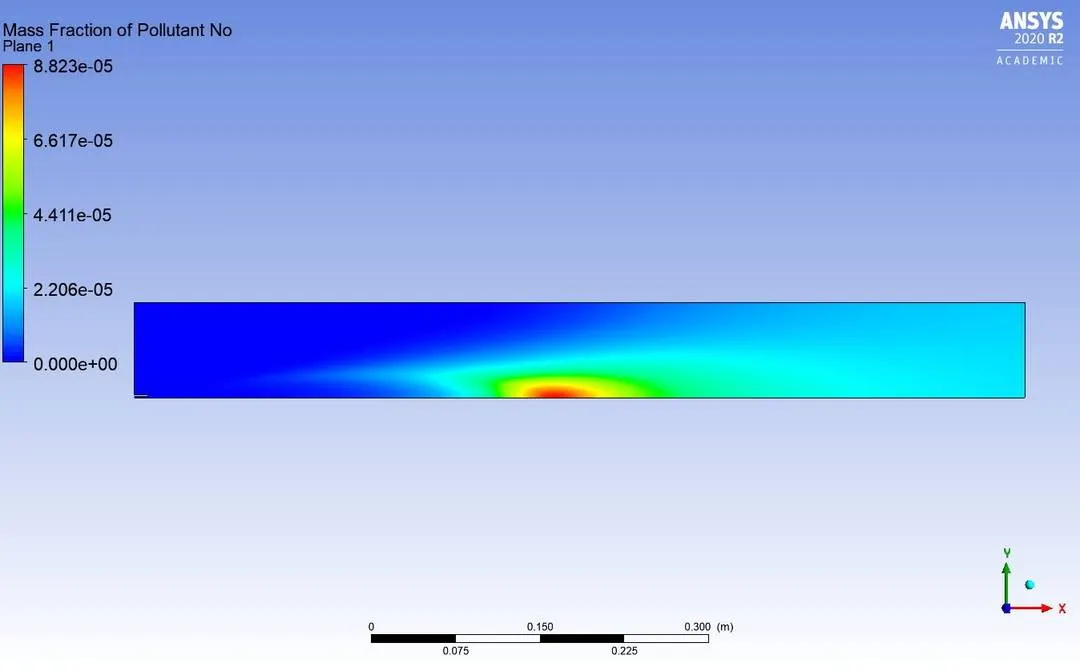
NItrogen oxide NOx:
Contour:
Plots:
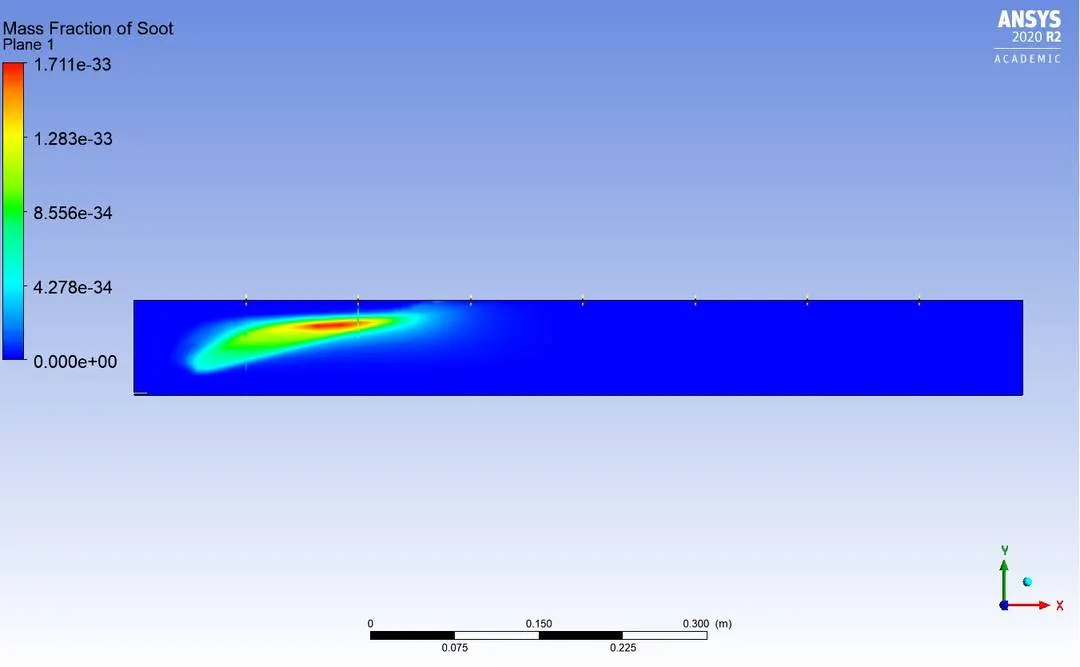
Soot :
Contour:
Plot:
----------------------------------------------------------------------------------------------------------------Part 2---------------------------------------------------------------------------------------------------
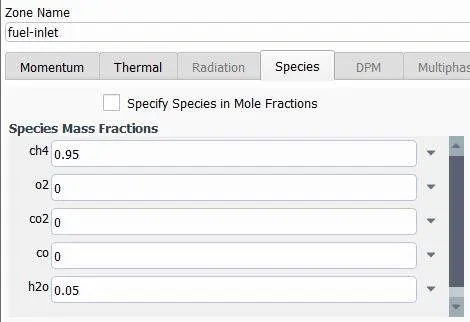
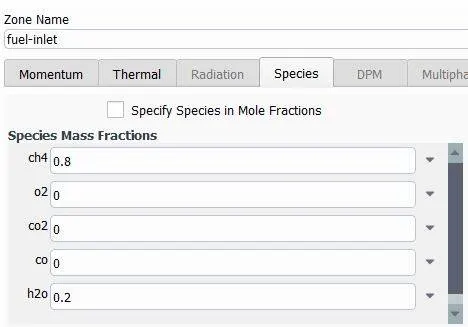
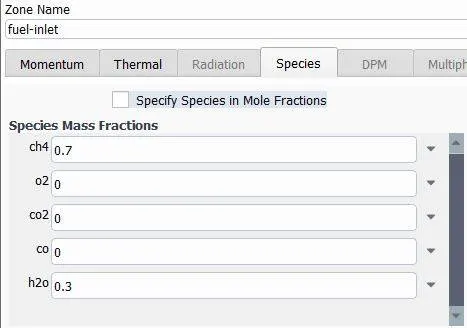
Part 2: we need to add the water content in the fuel from 5% to 30% by mole and observe the effect of it on the results
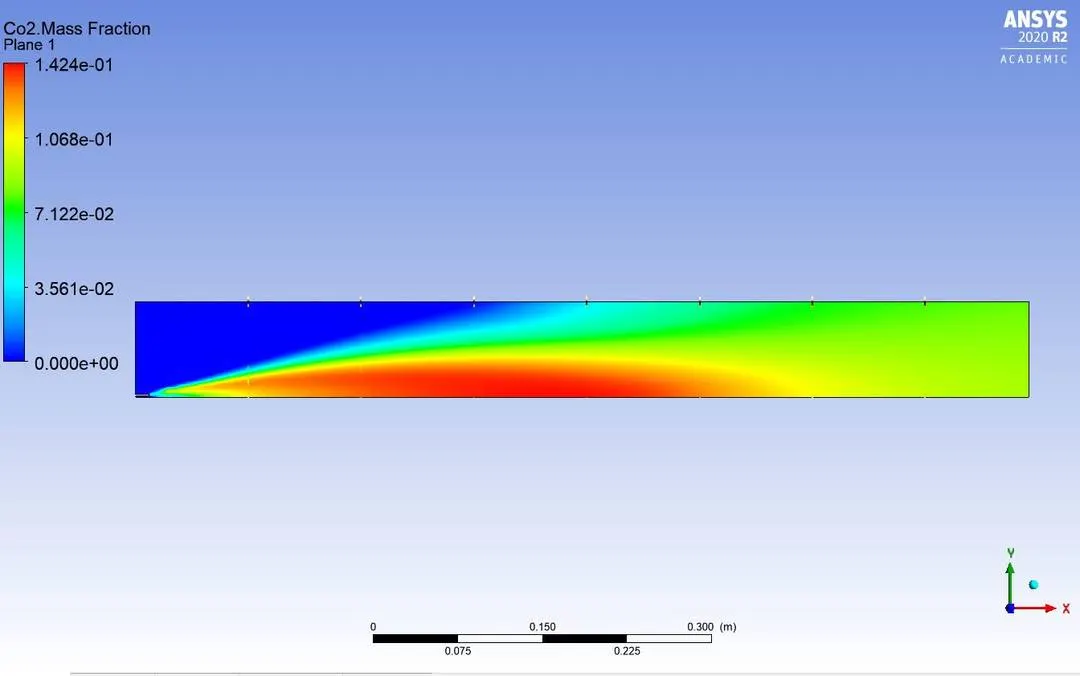
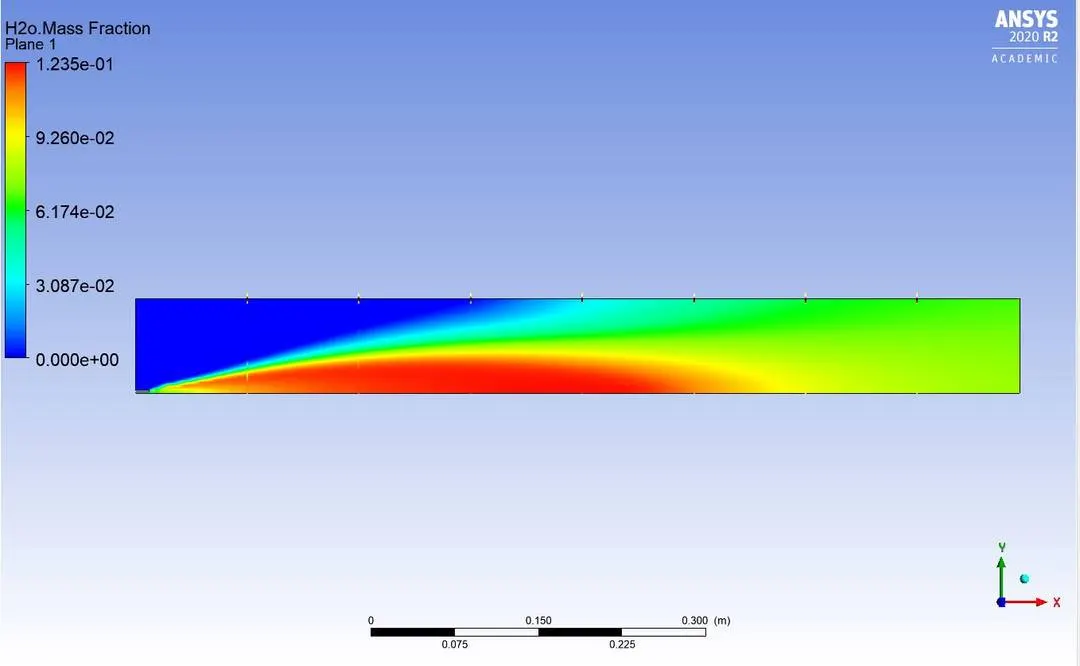
Case 1 : 5% water content in fuel methane
Residuals:
Carbon dioxide Co2:
Contour:
Plots:
Water H20:
Contour:
Plots:
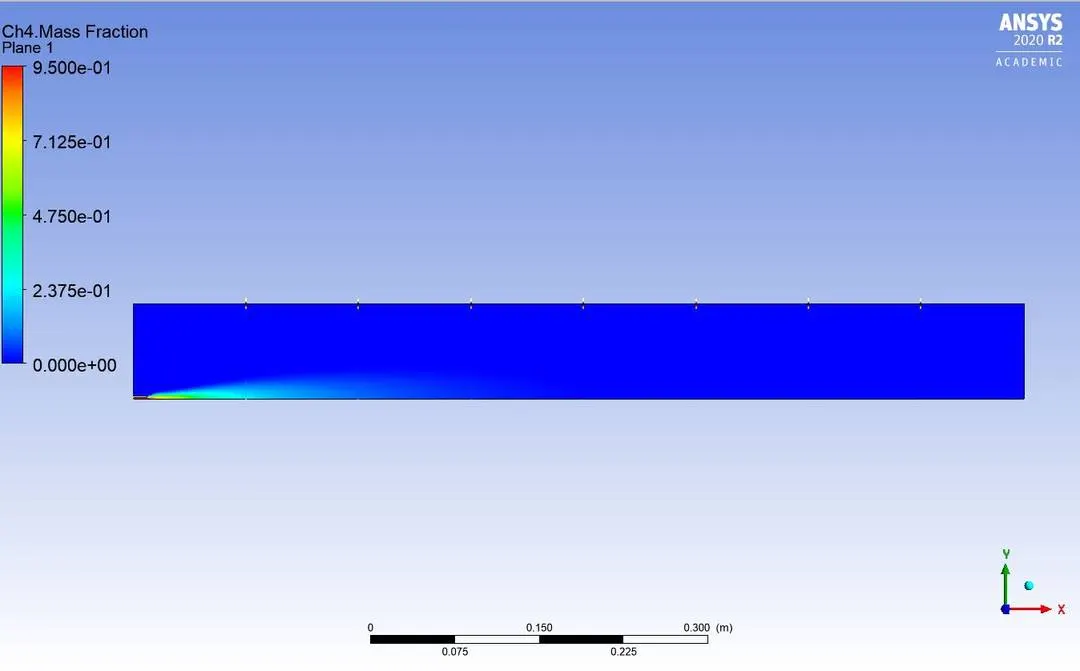
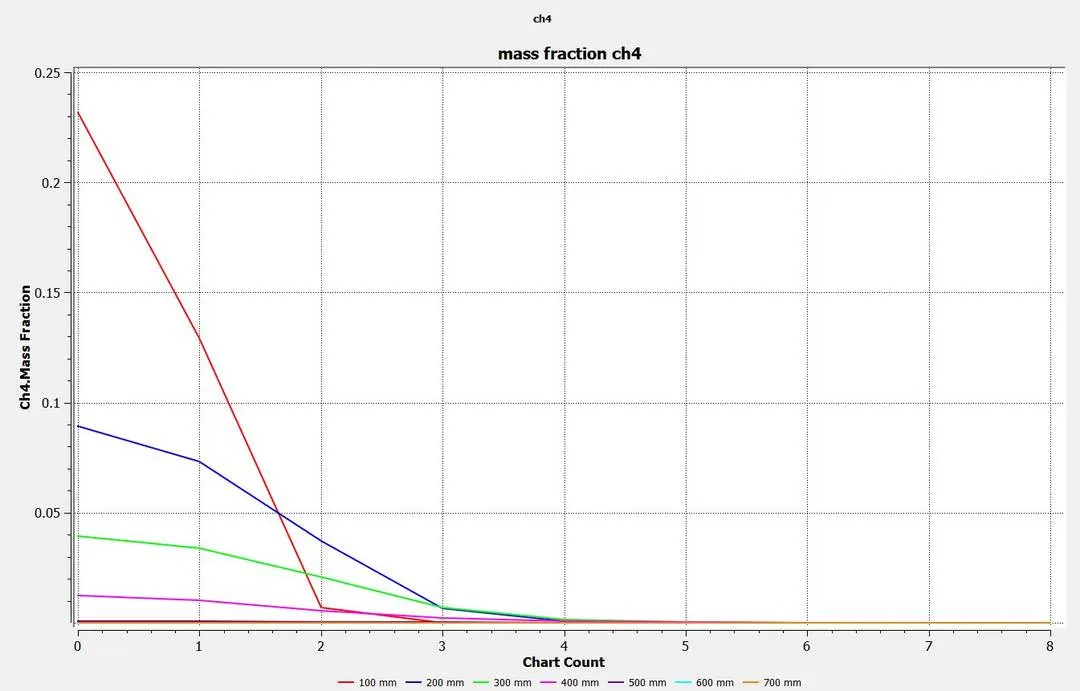
Methane CH4:
Contour:
Plots:
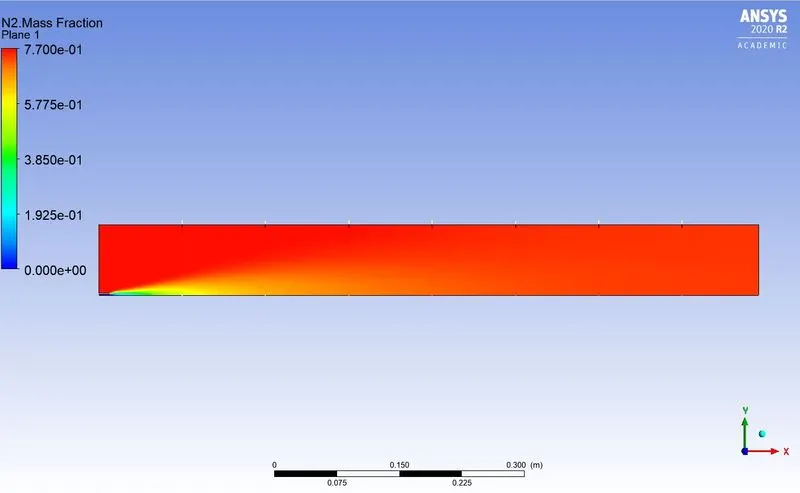
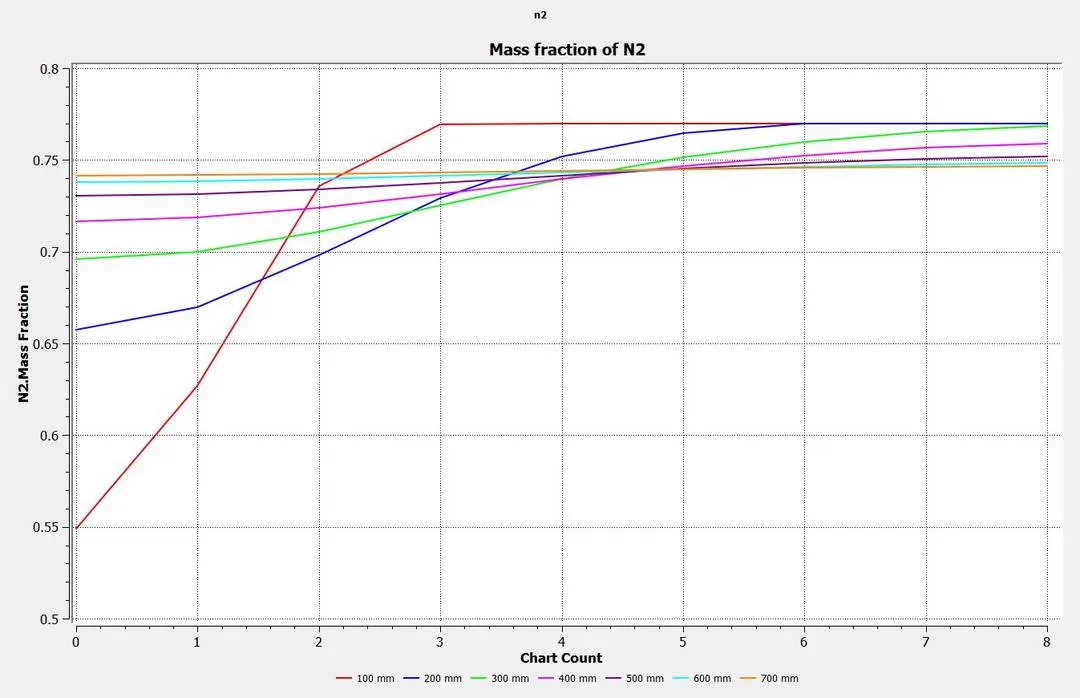
Nitrogen N2:
Contour:
Plots:
Oxygen O2:
Contour:
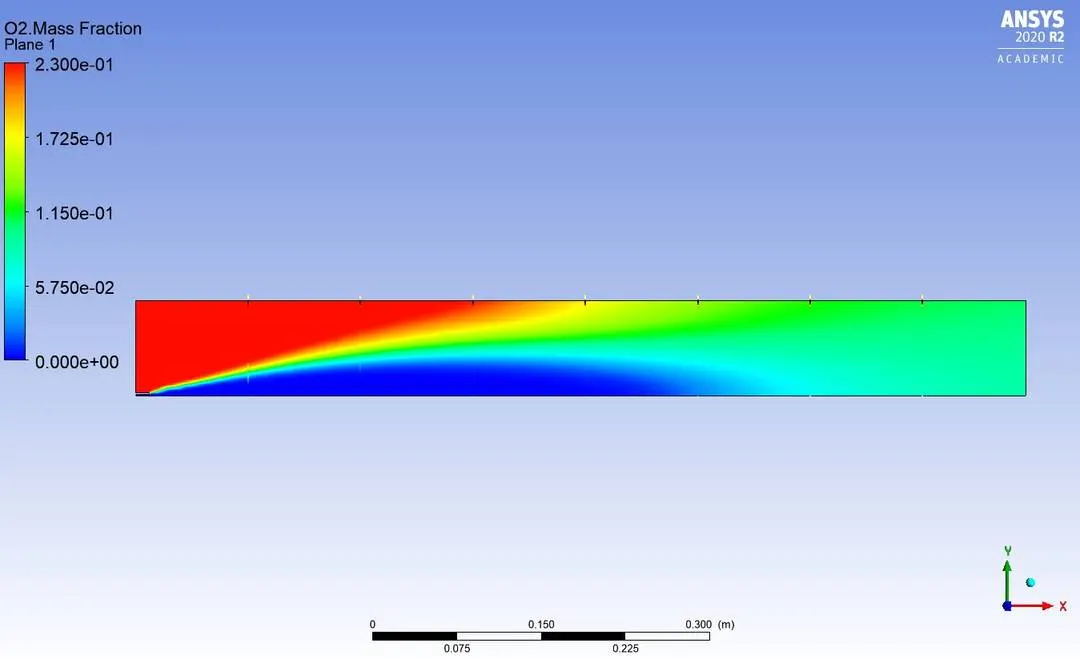
Plot:
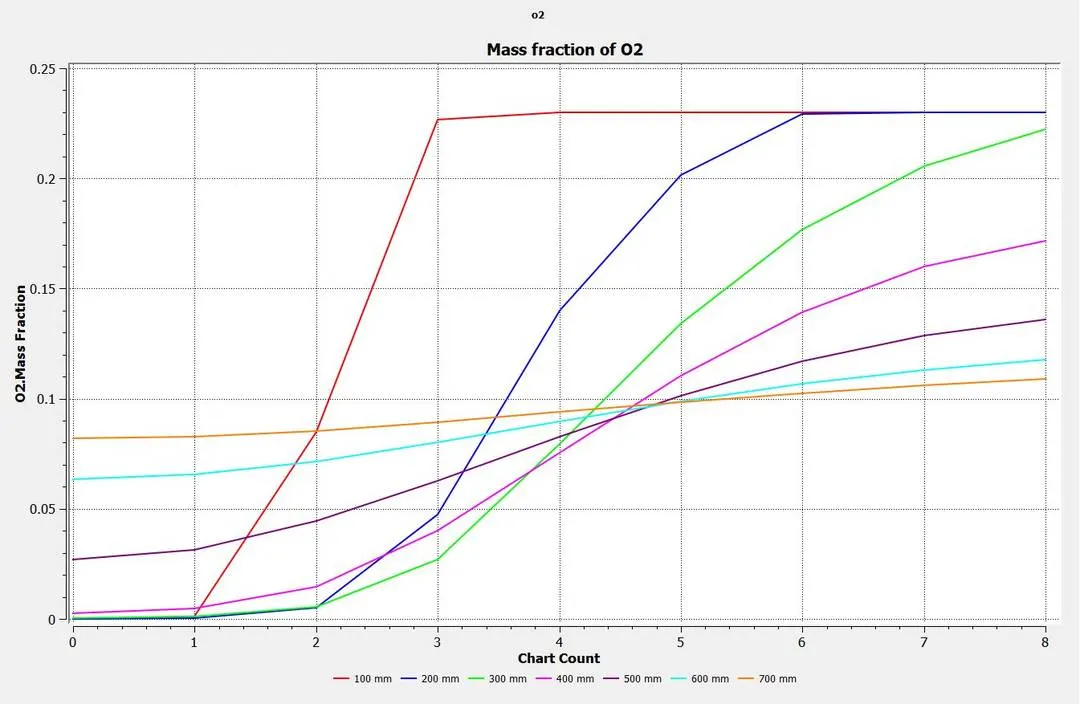
Nitrogen oxide N0x:
Contour:
Plots:
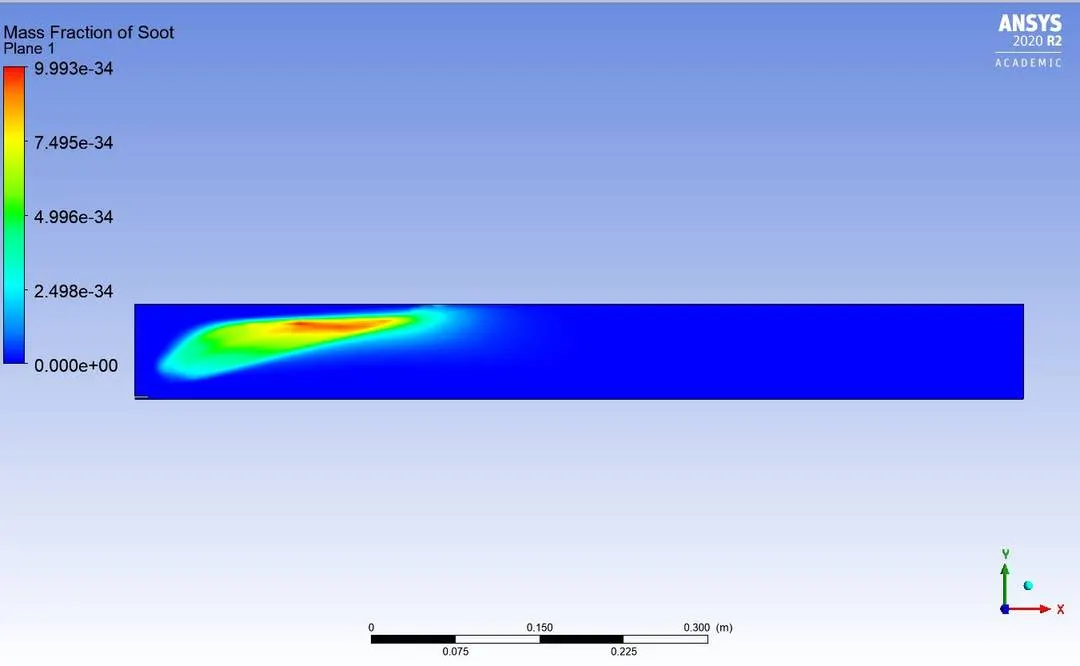
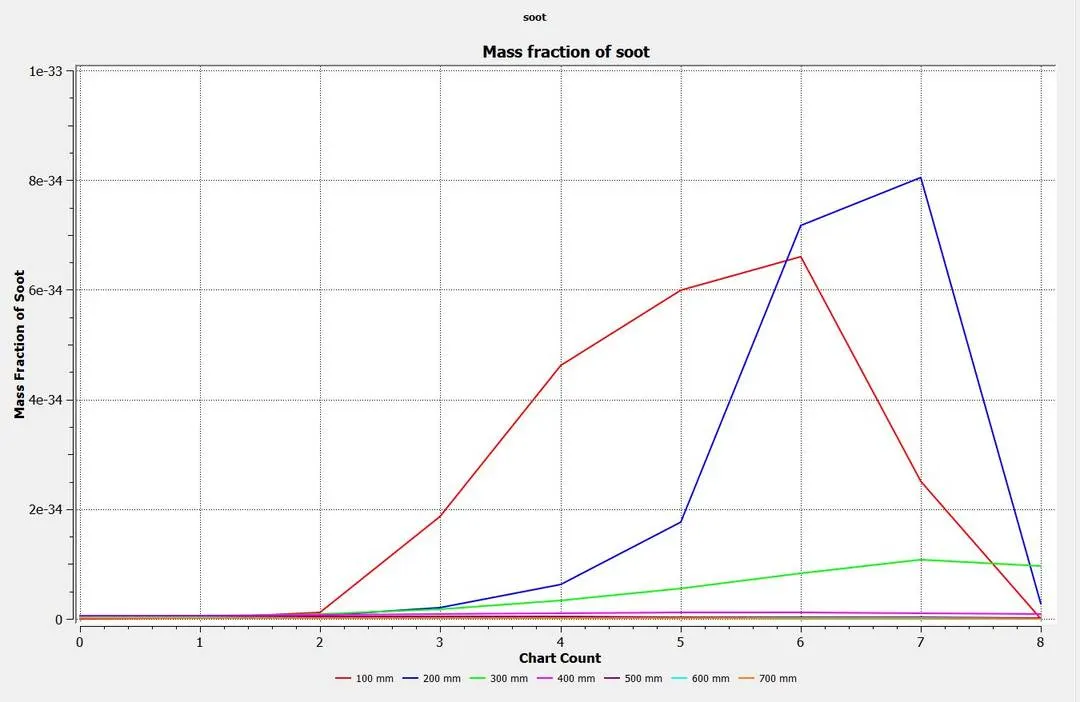
Soot:
Contour:
Plots:
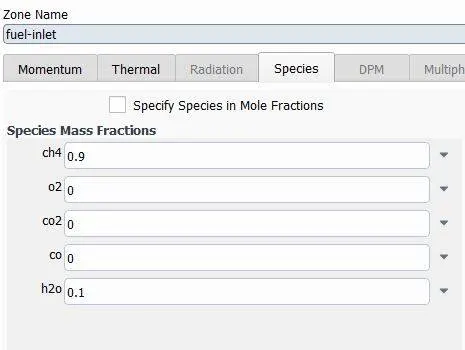
Case 2: 10 % water content in methane fuel
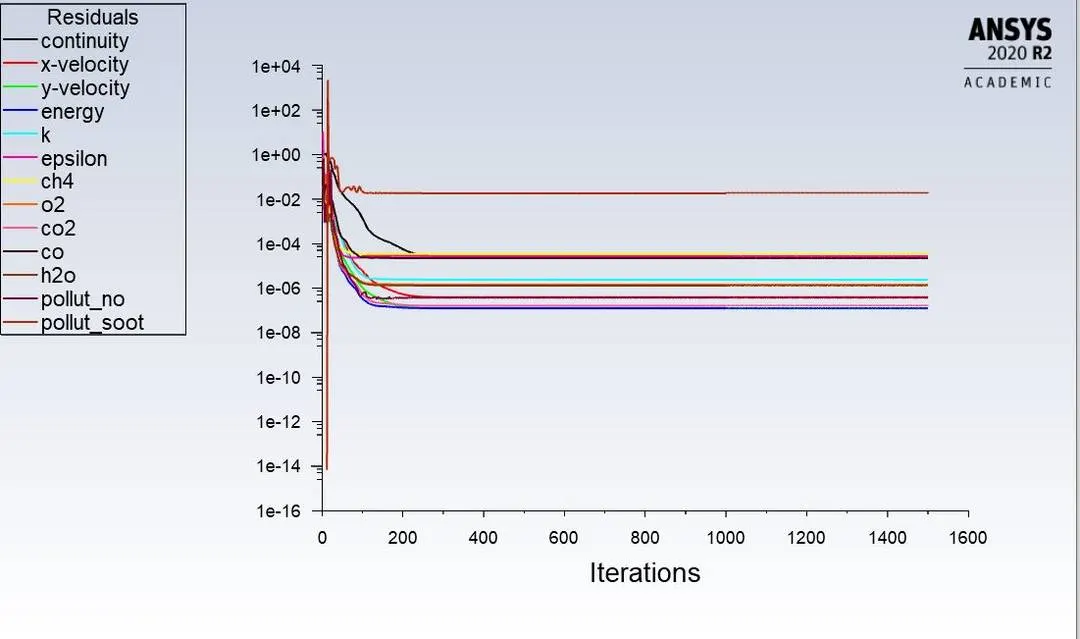
Residuals:
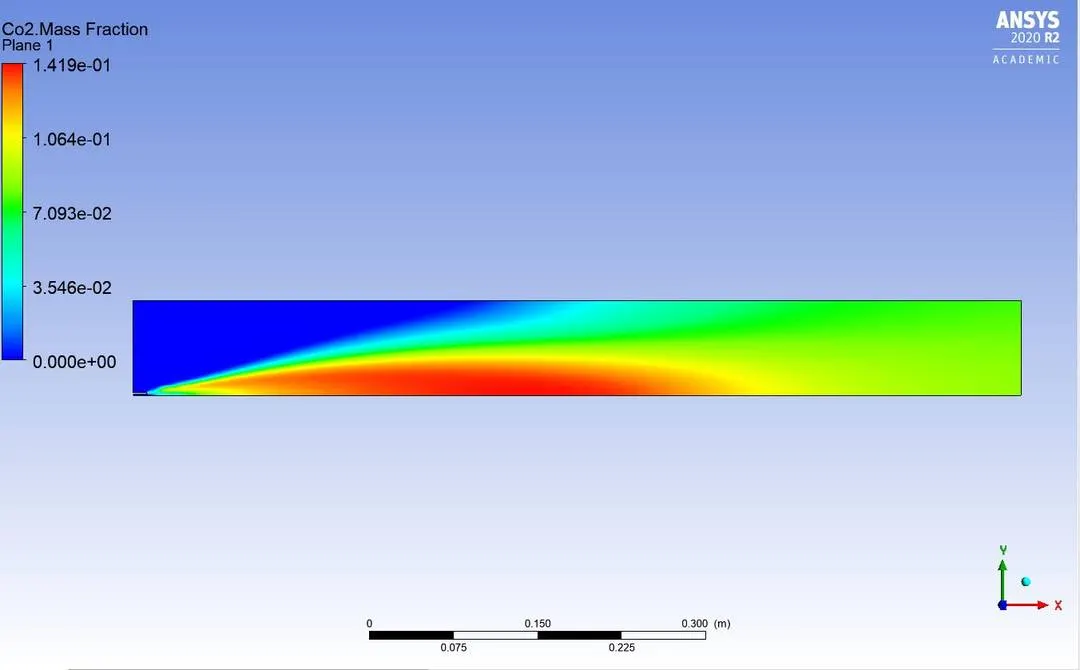
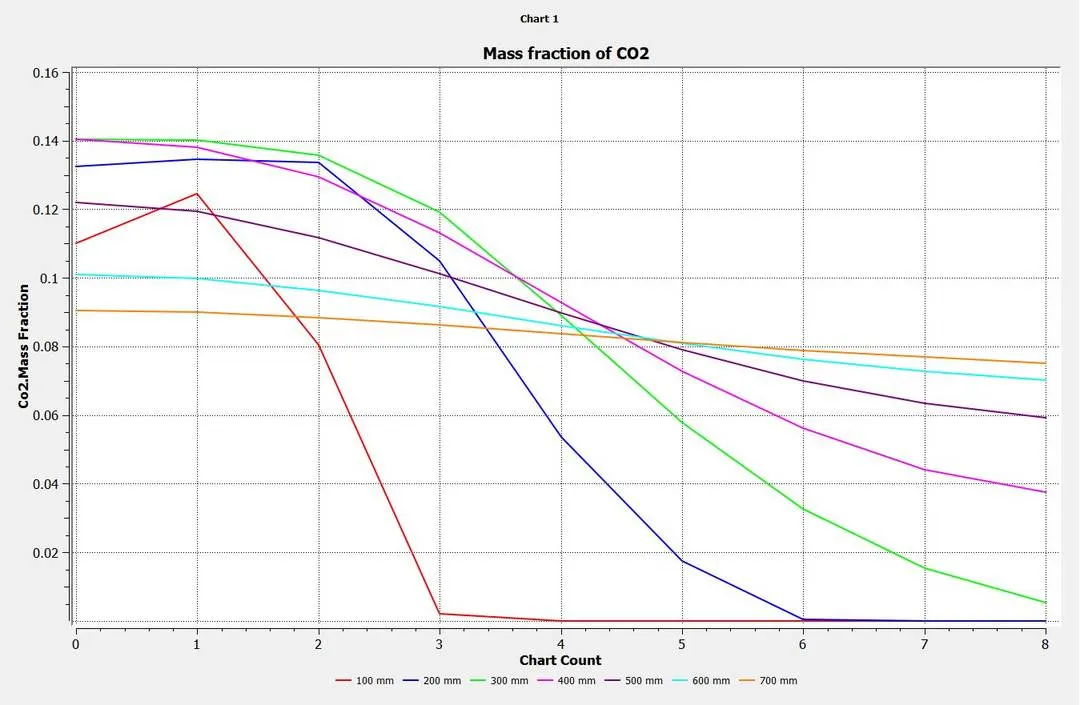
Carbon Dioxide CO2:
Contour:
plot:
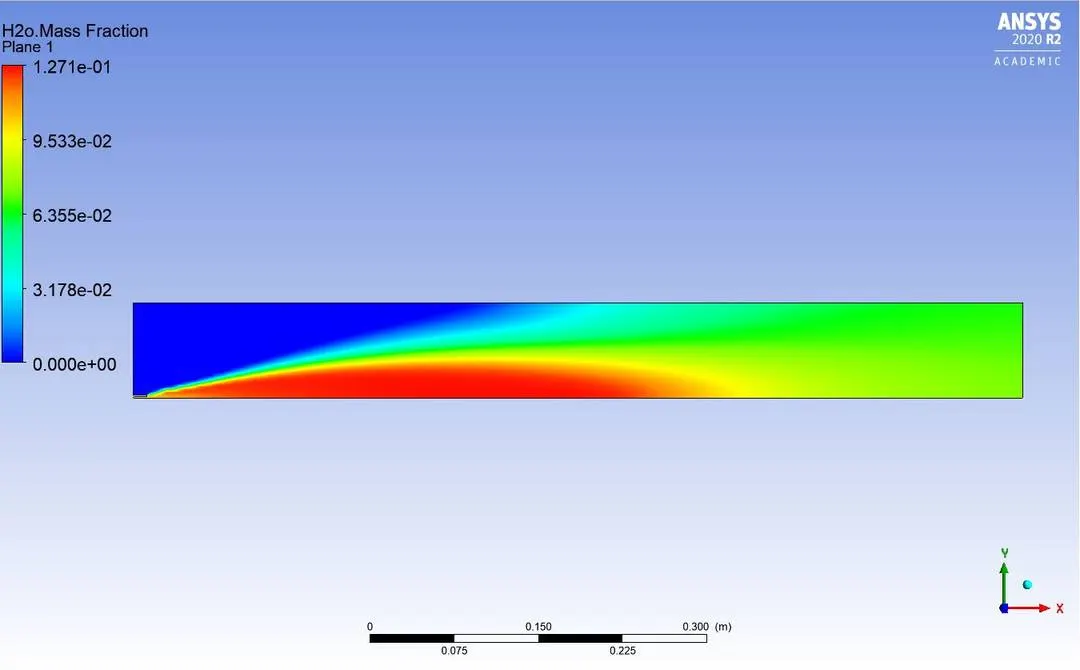
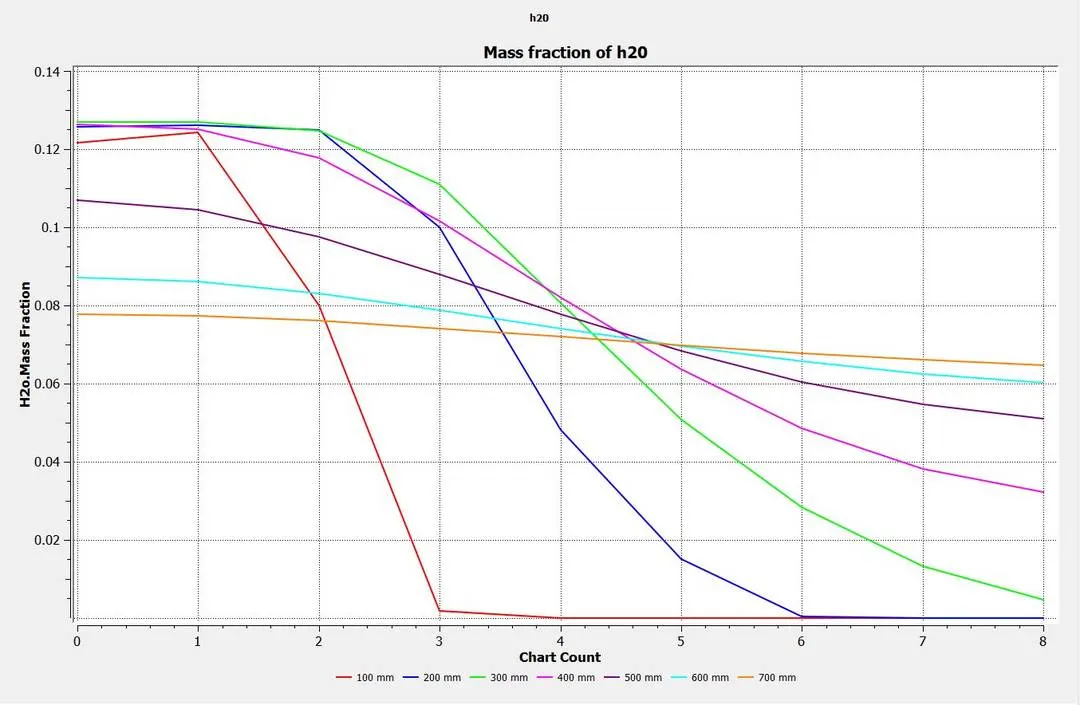
Water H2O:
Contour:
plot:
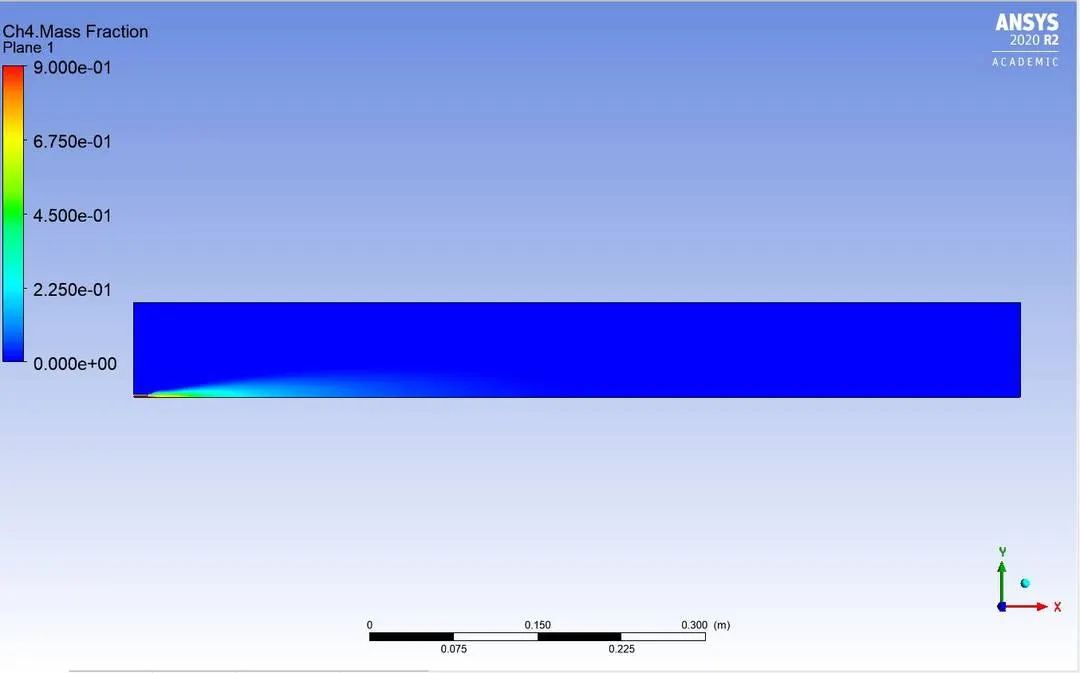
Methane CH4:
Contour:
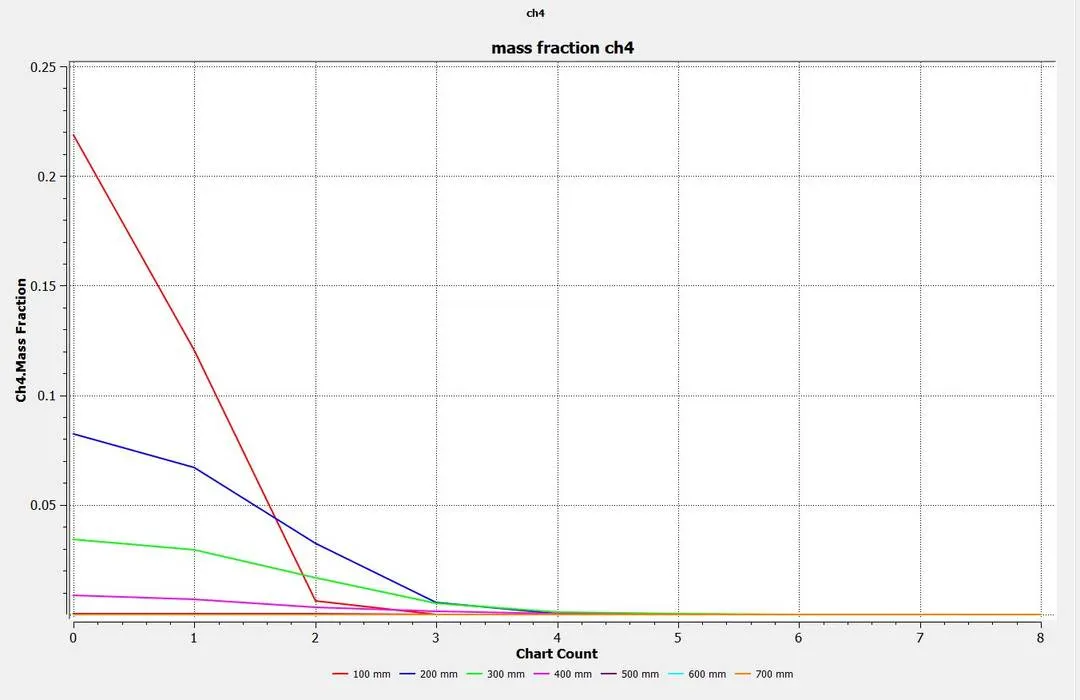
Plot:
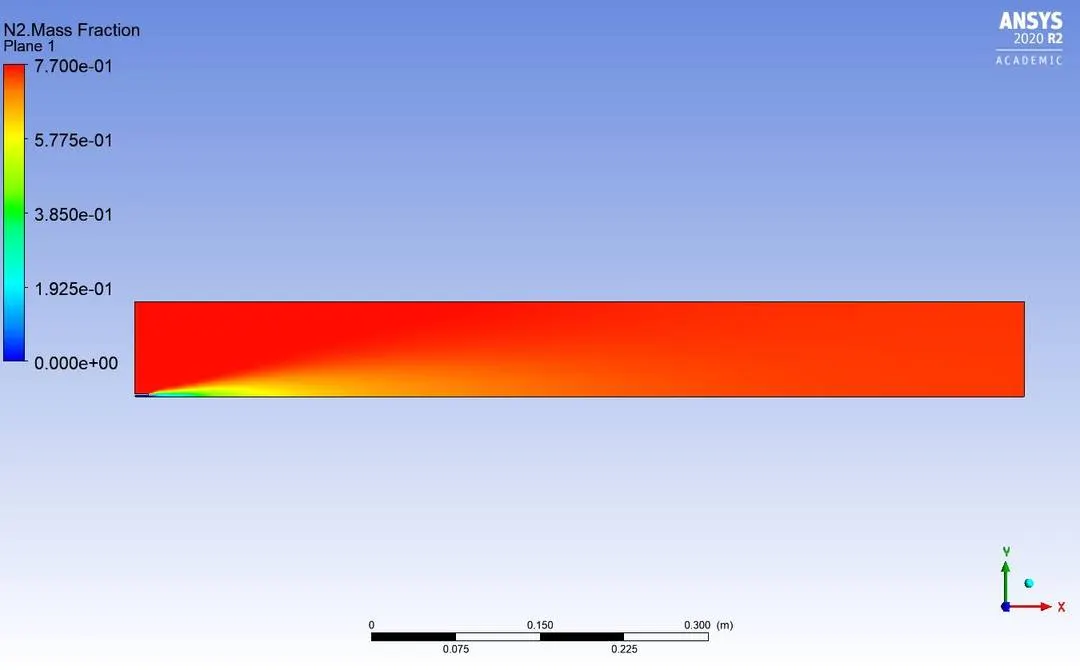
Nitrogen N2:
Contour:
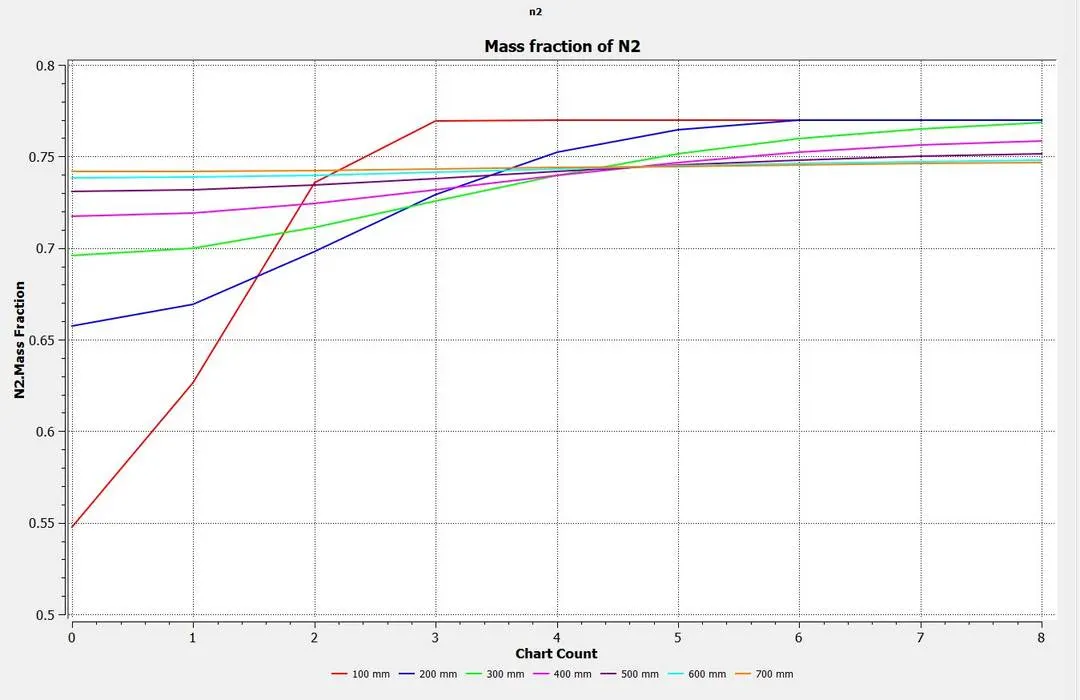
Plot:
Oxygen O2:
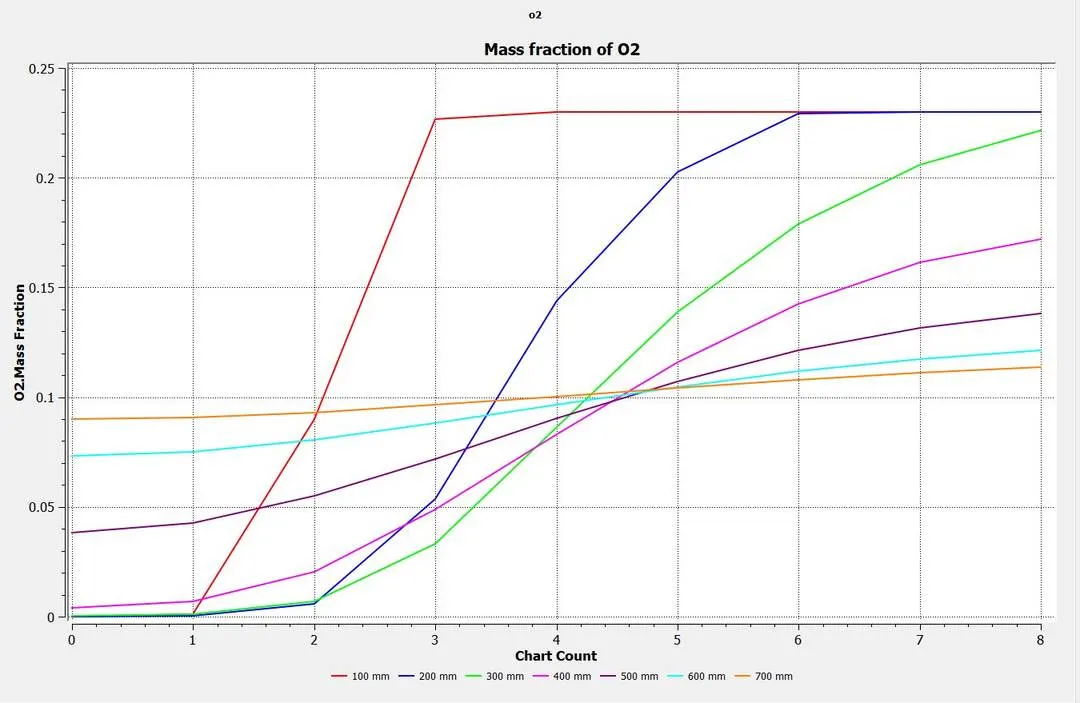
Contour:
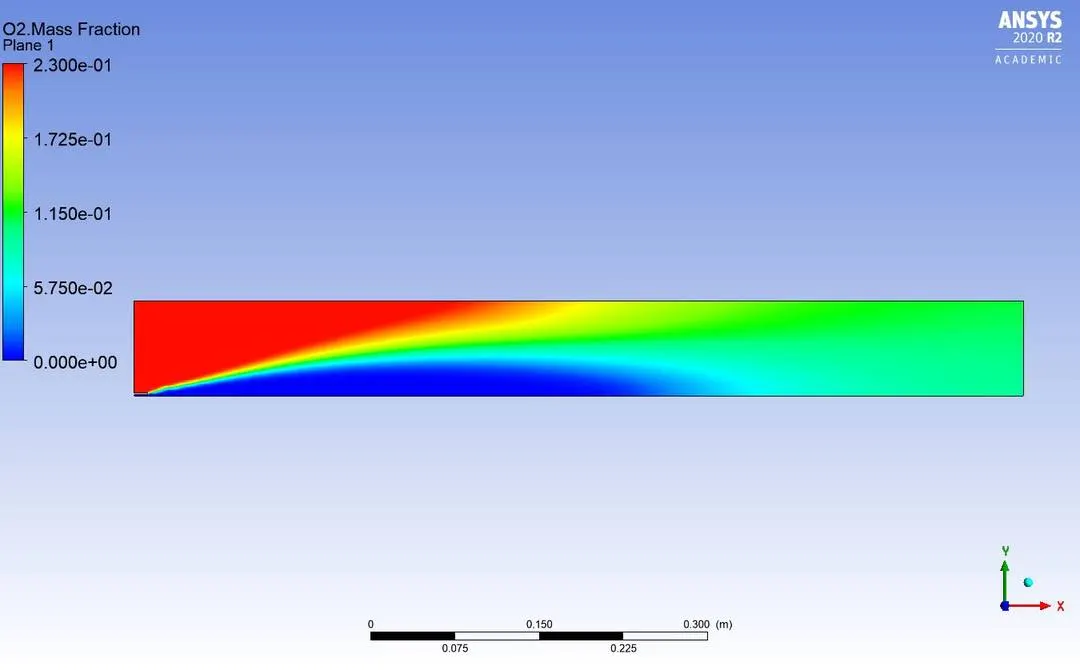
Plot:
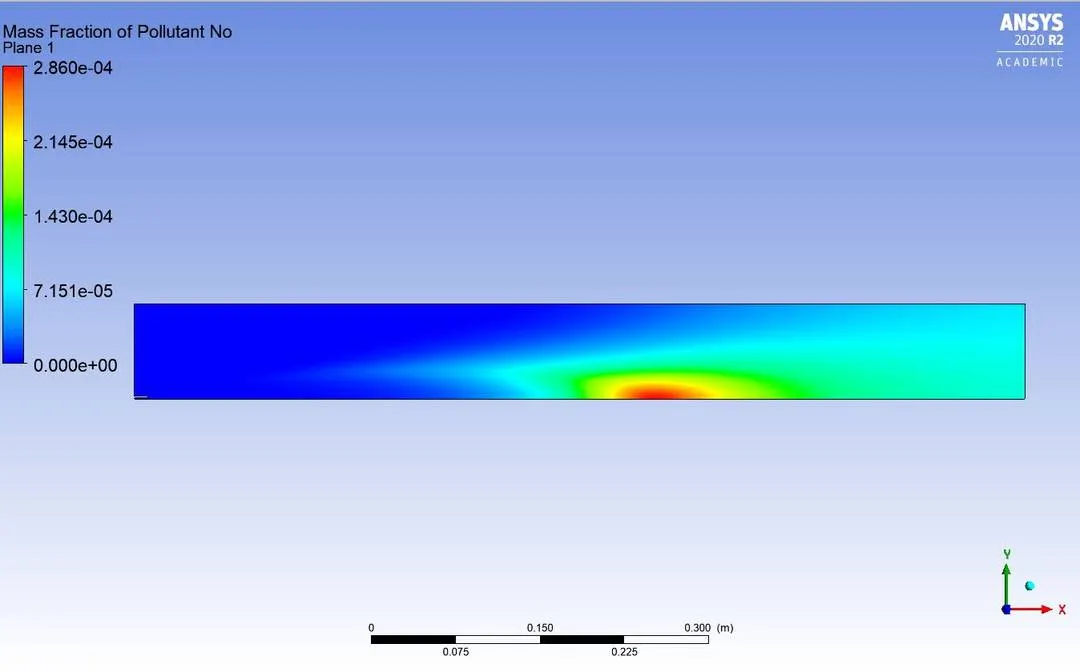
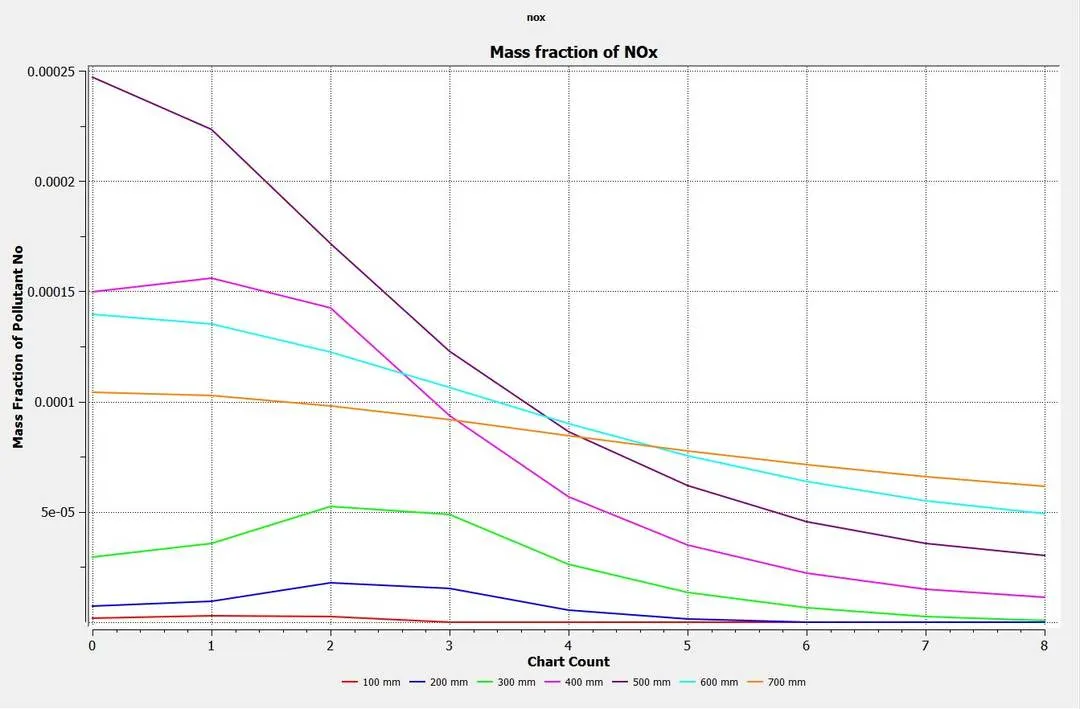
Nitrogen Oxide NOx:
Contour:
Plot:
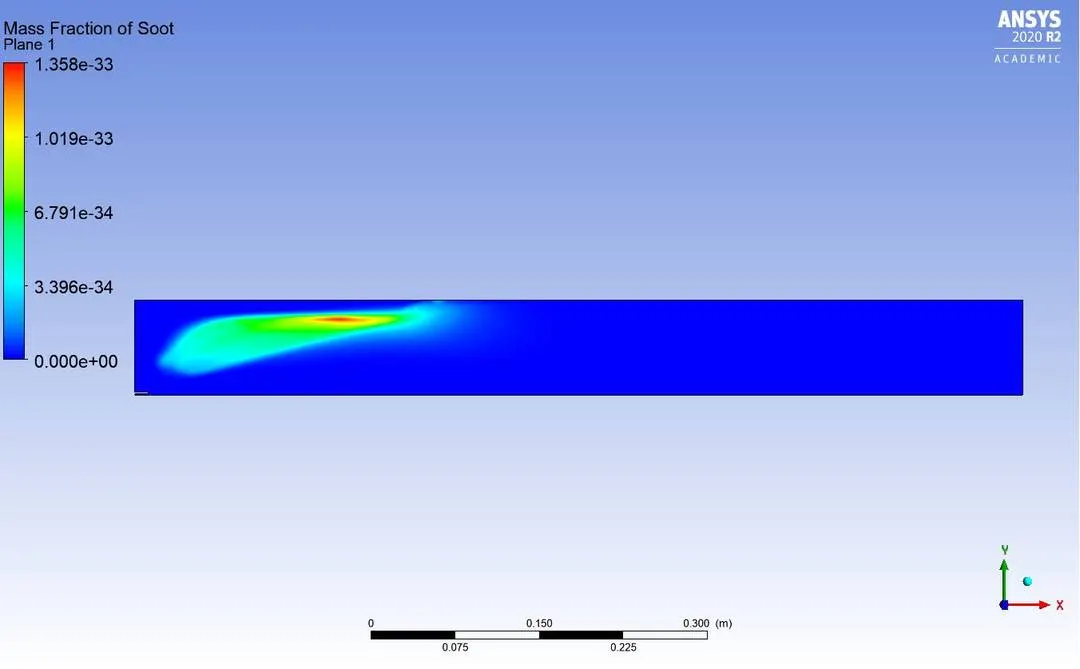
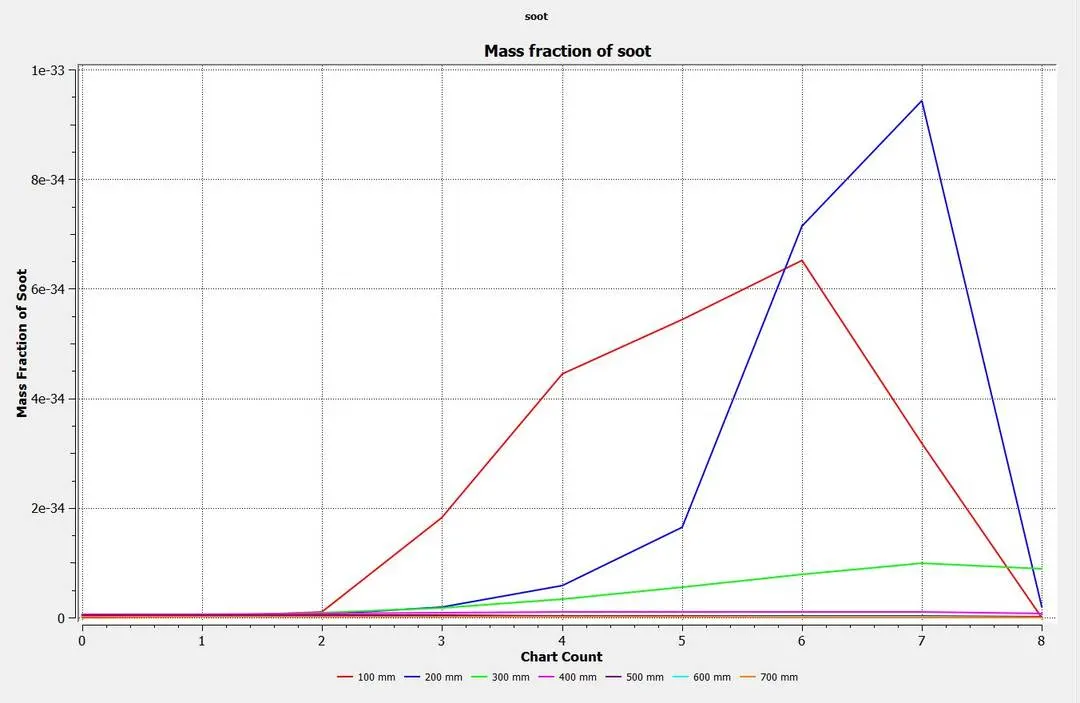
Soot:
Contour:
Plot:
Case 3: 20 % water content in methane fuel:
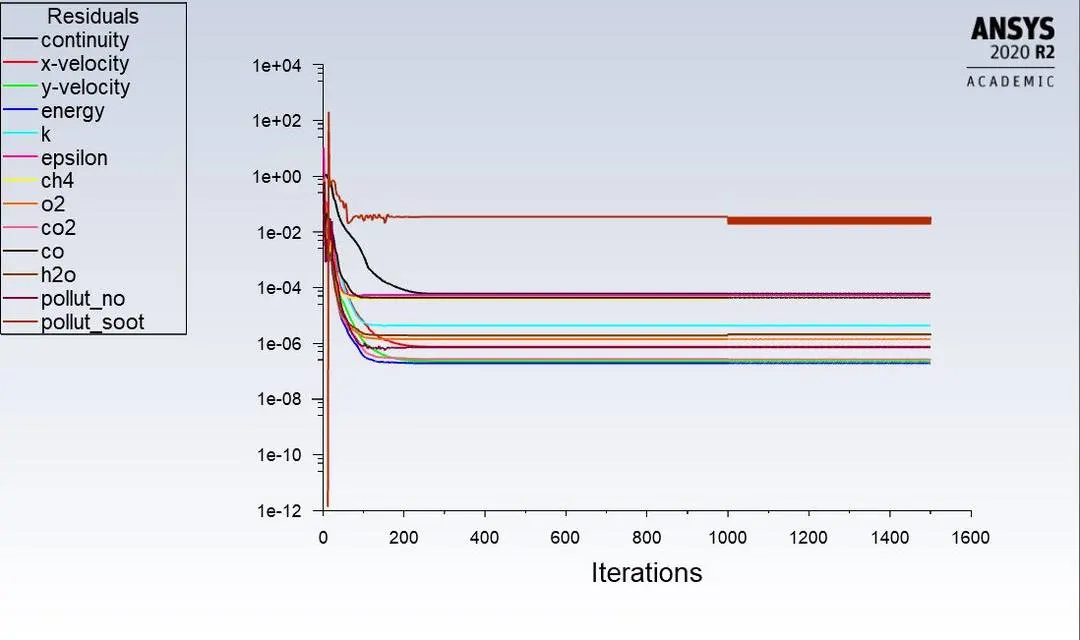
Residuals:
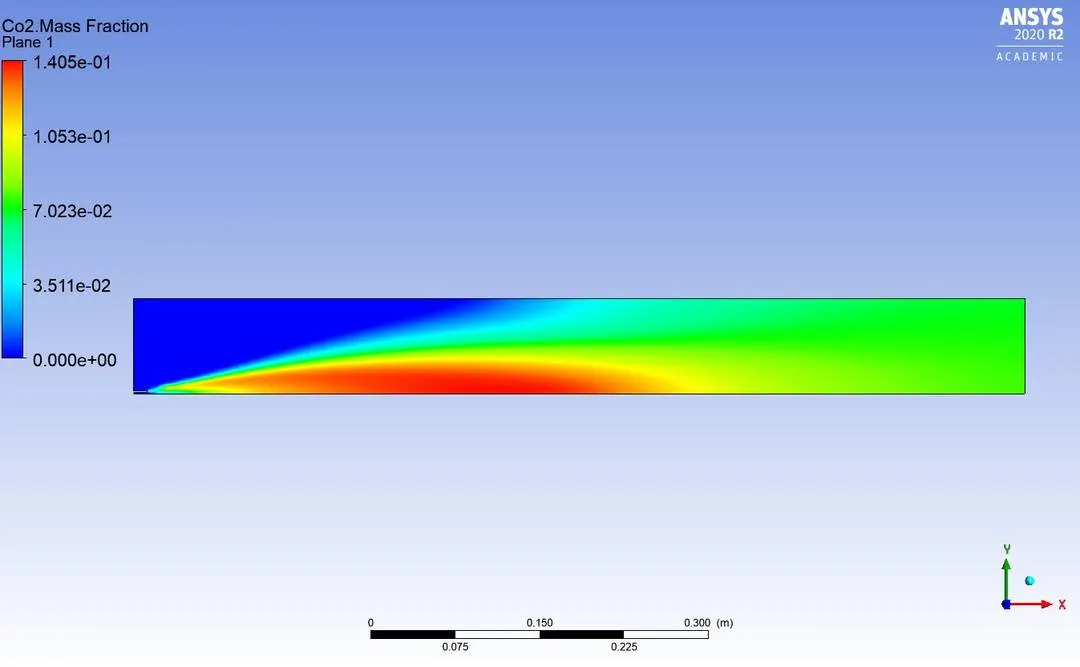
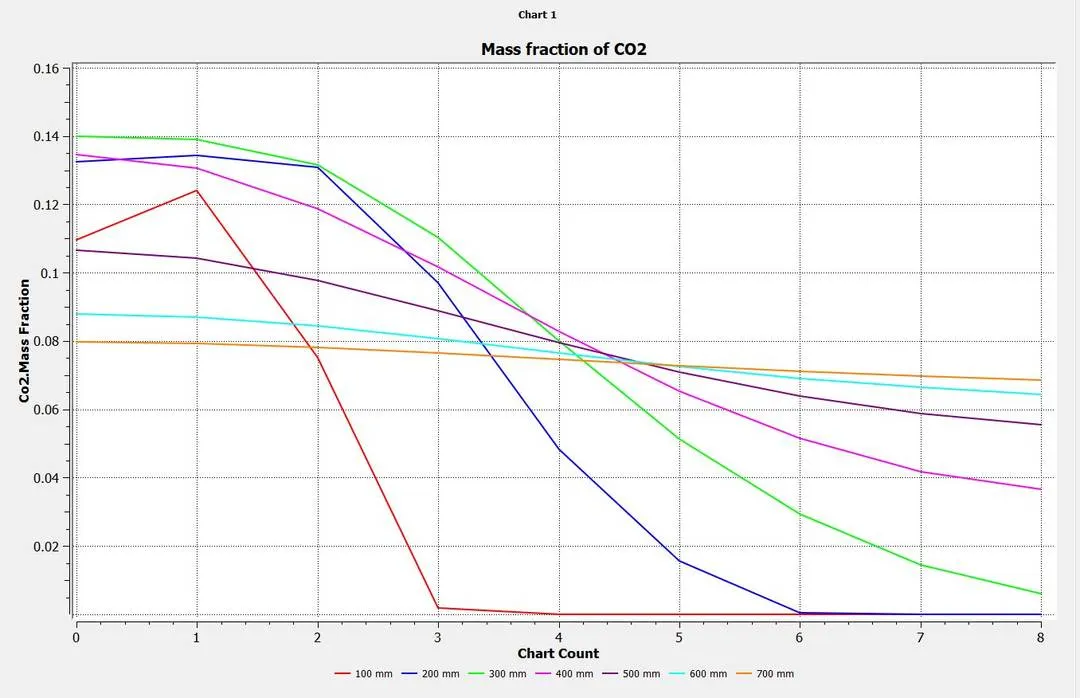
Carbon Dioxide CO2:
Contour:
Plot:
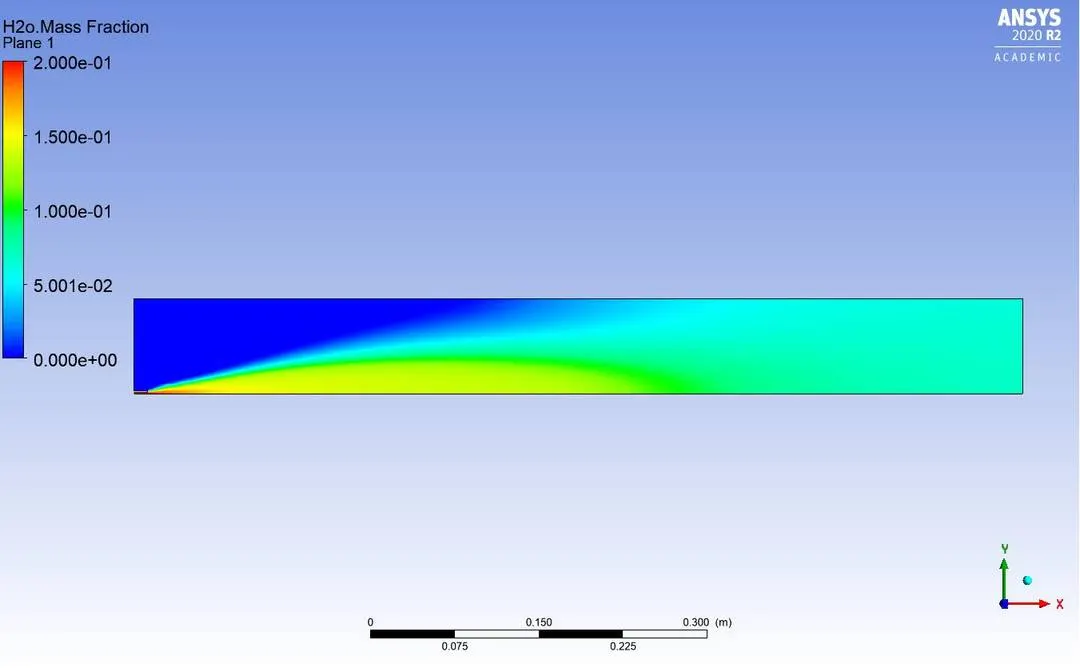
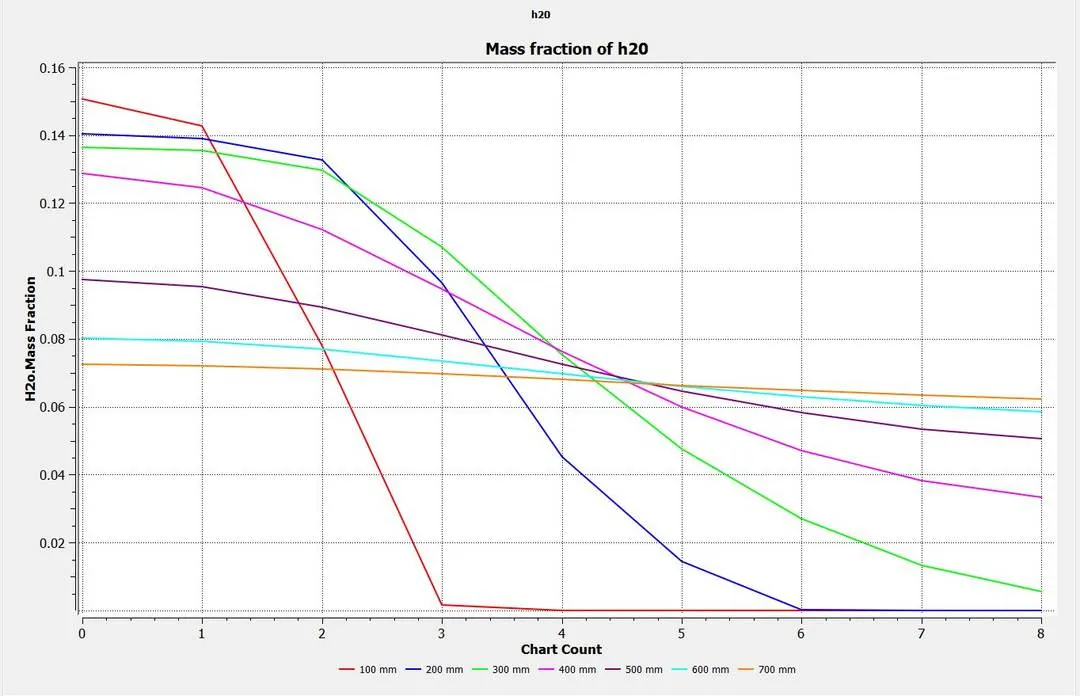
Water H2O:
Contour:
Plot:
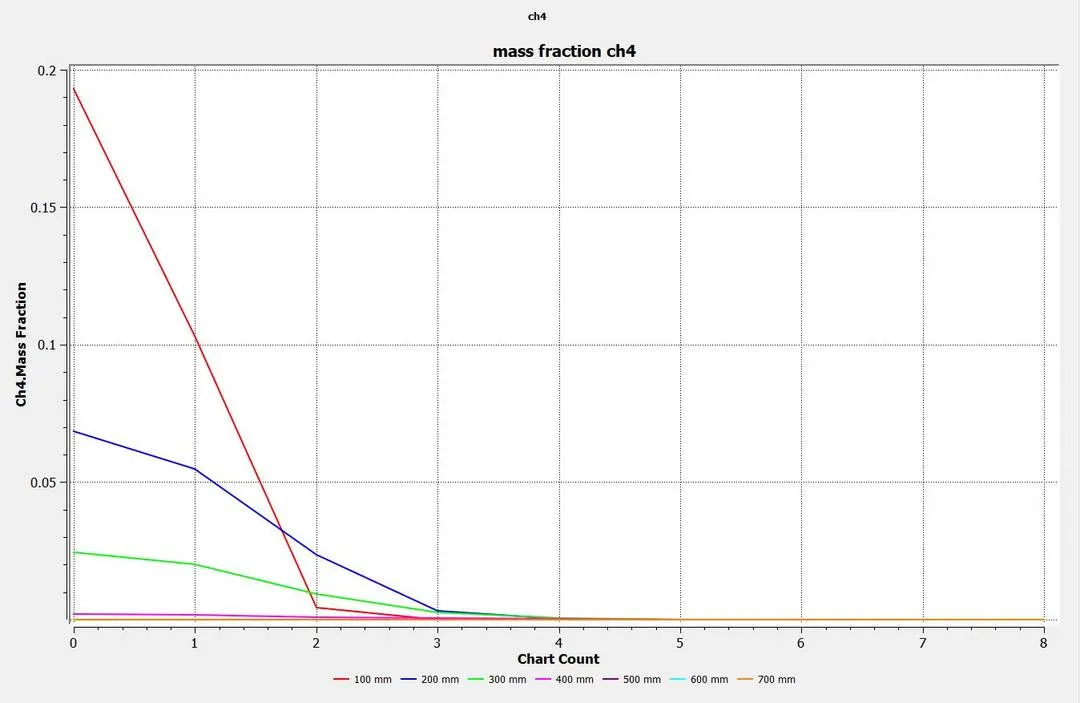
Methane CH4:
Contour:
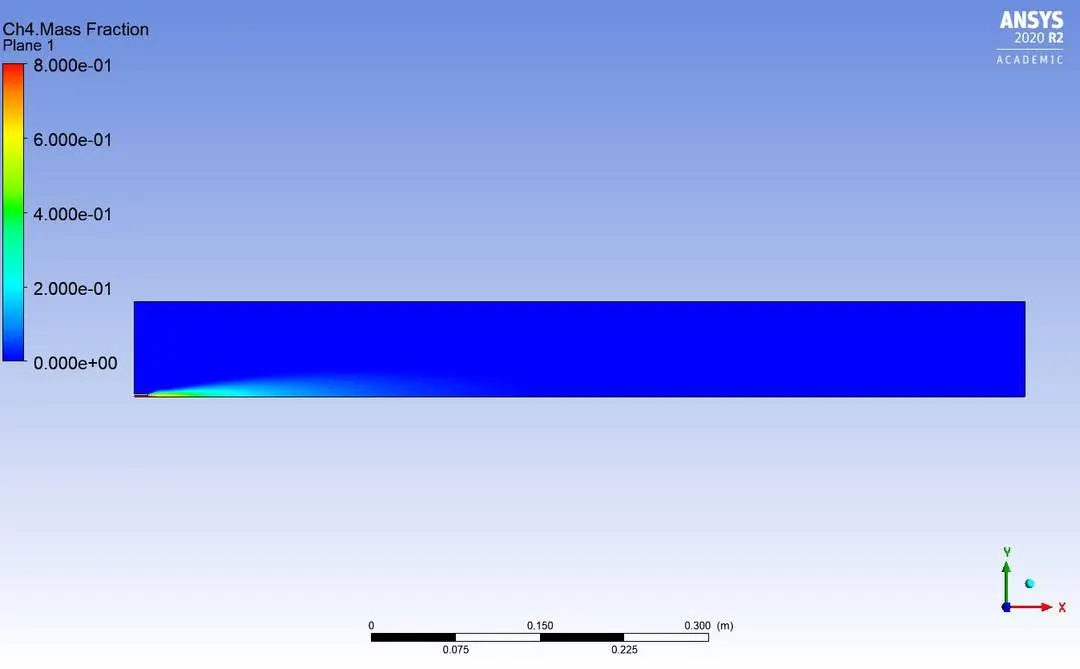
Plot:
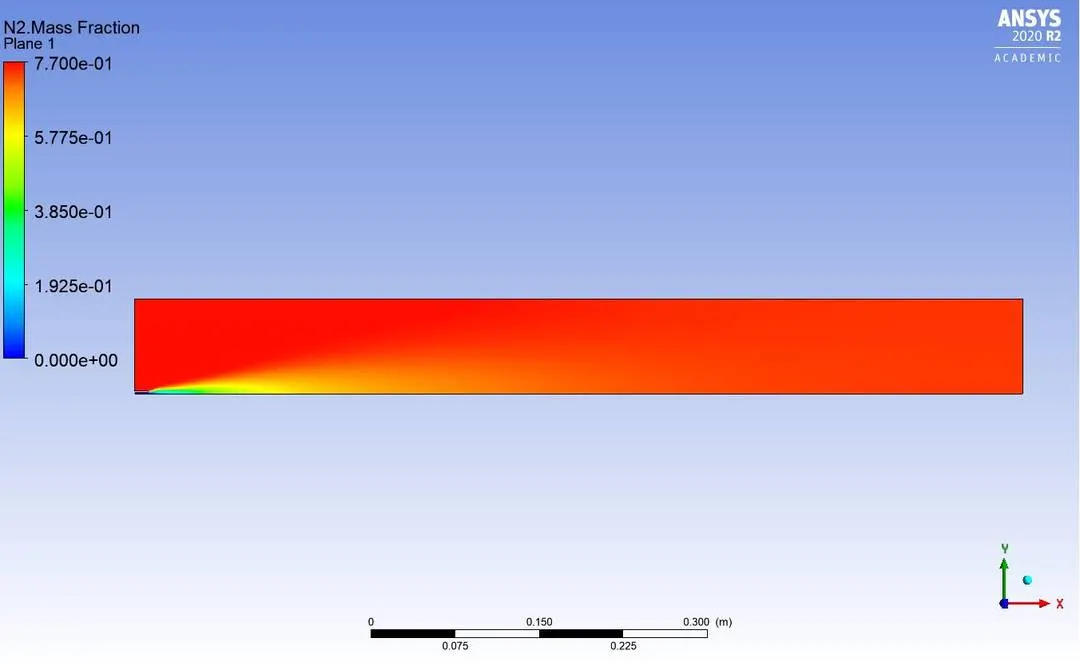
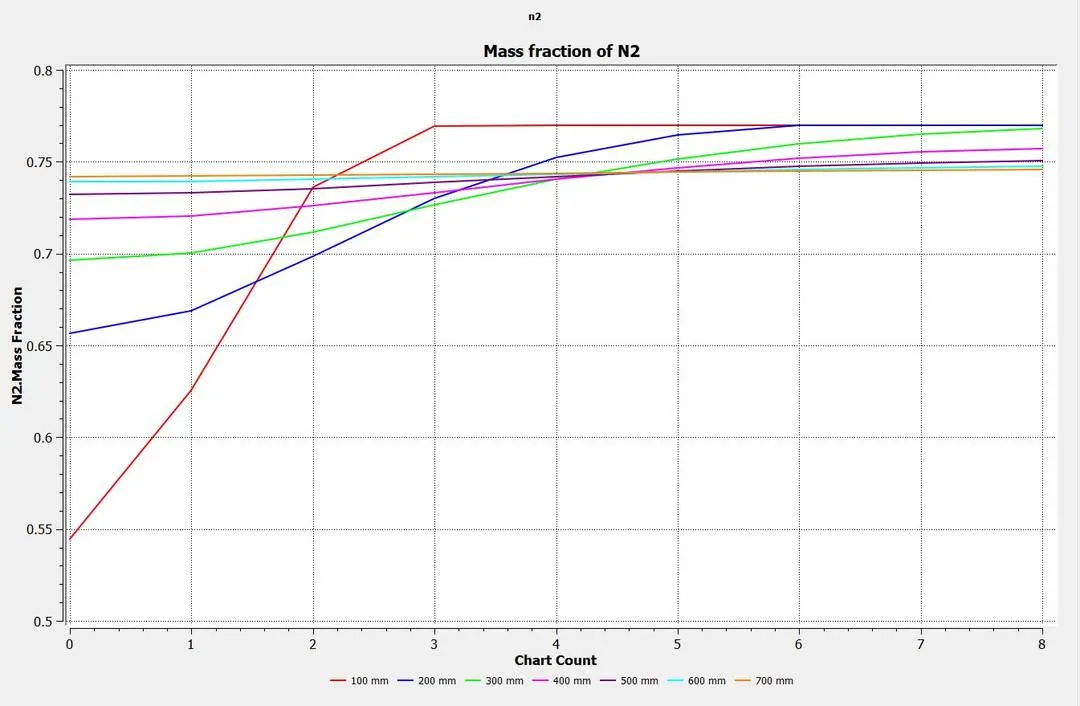
Nitrogen N2:
Contour:
Plot:
Oxygen O2:
Contour:
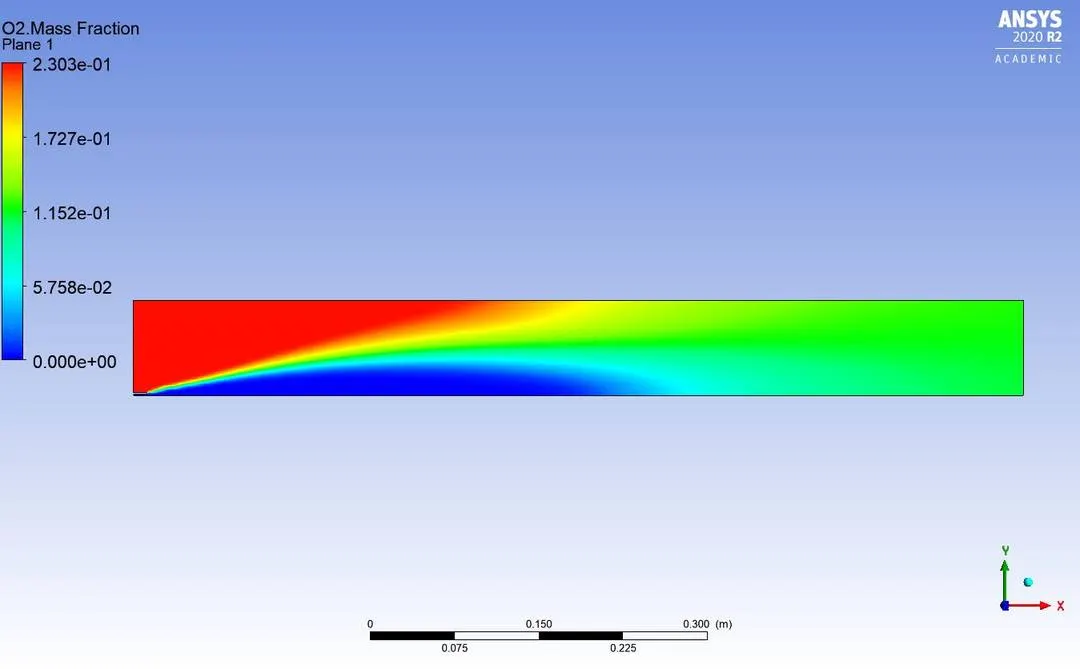
Plot:
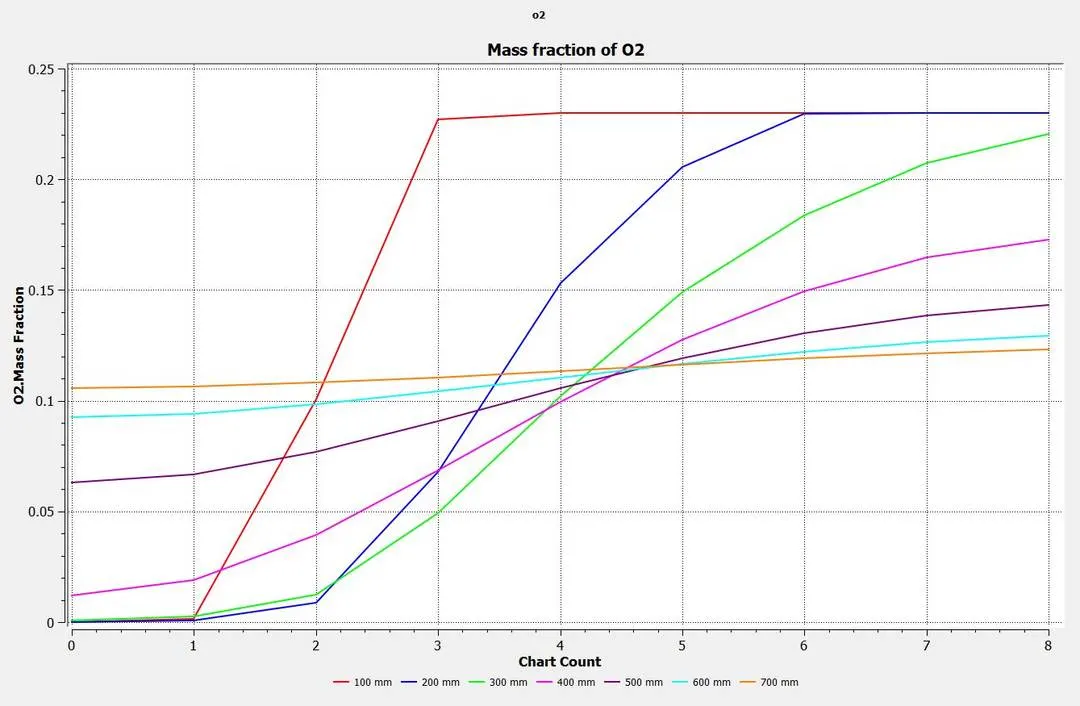
Nitrogen NOx:
Contour:
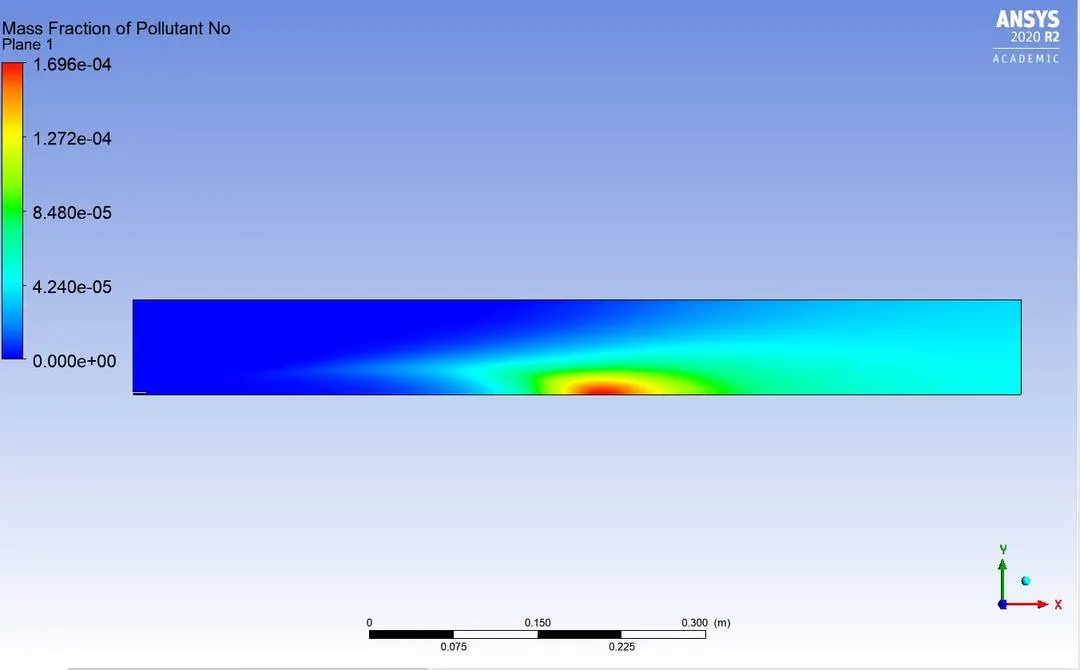
Plot:
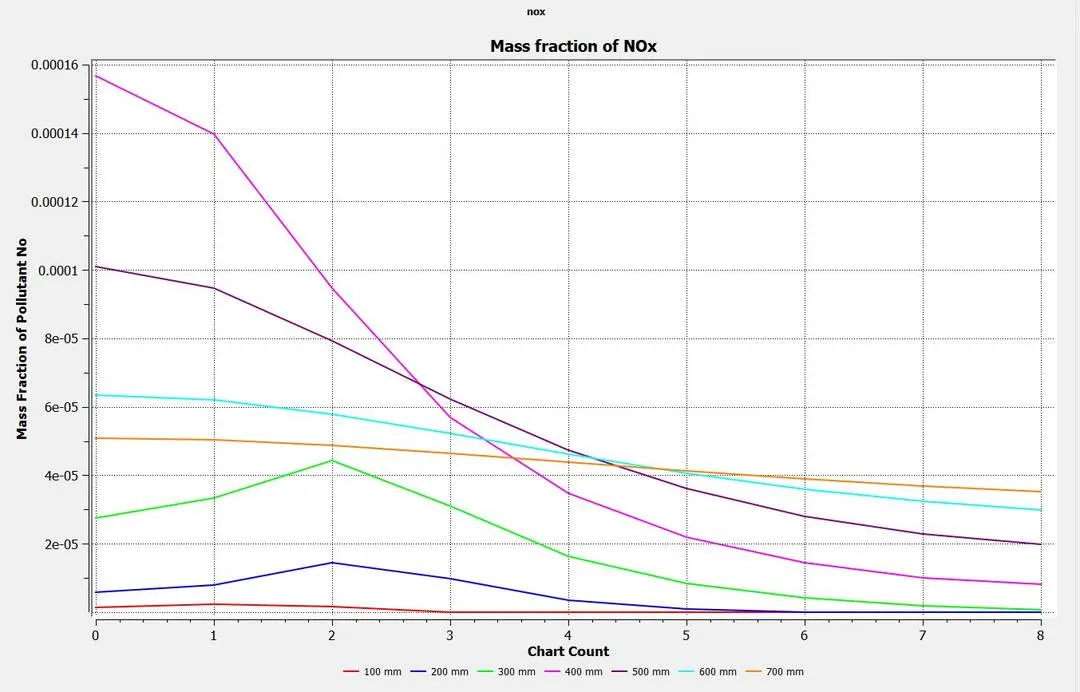
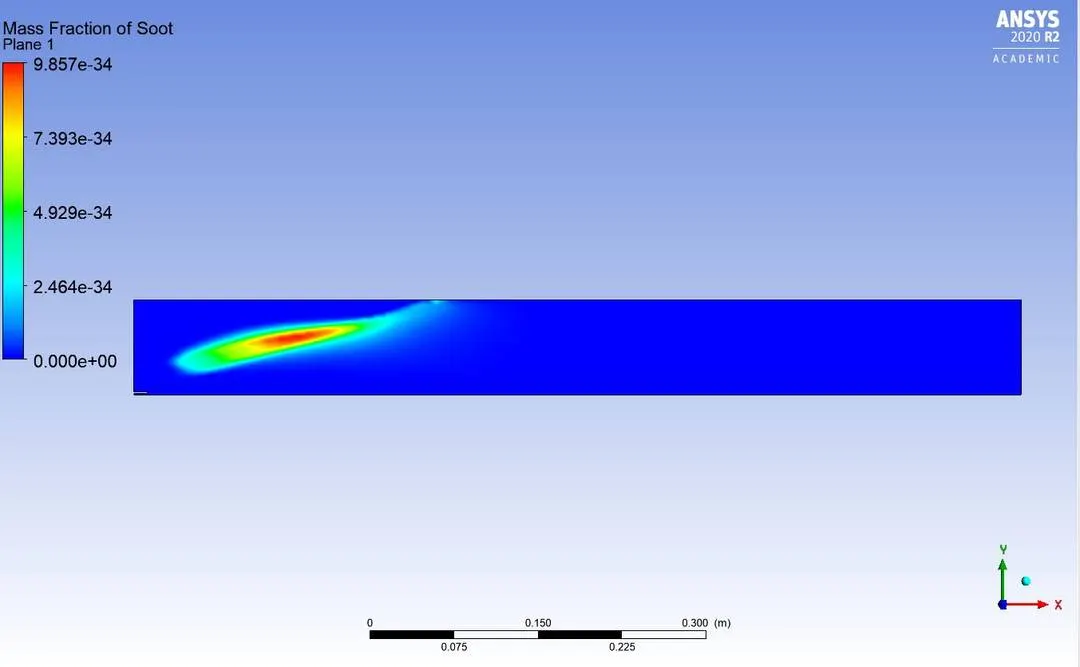
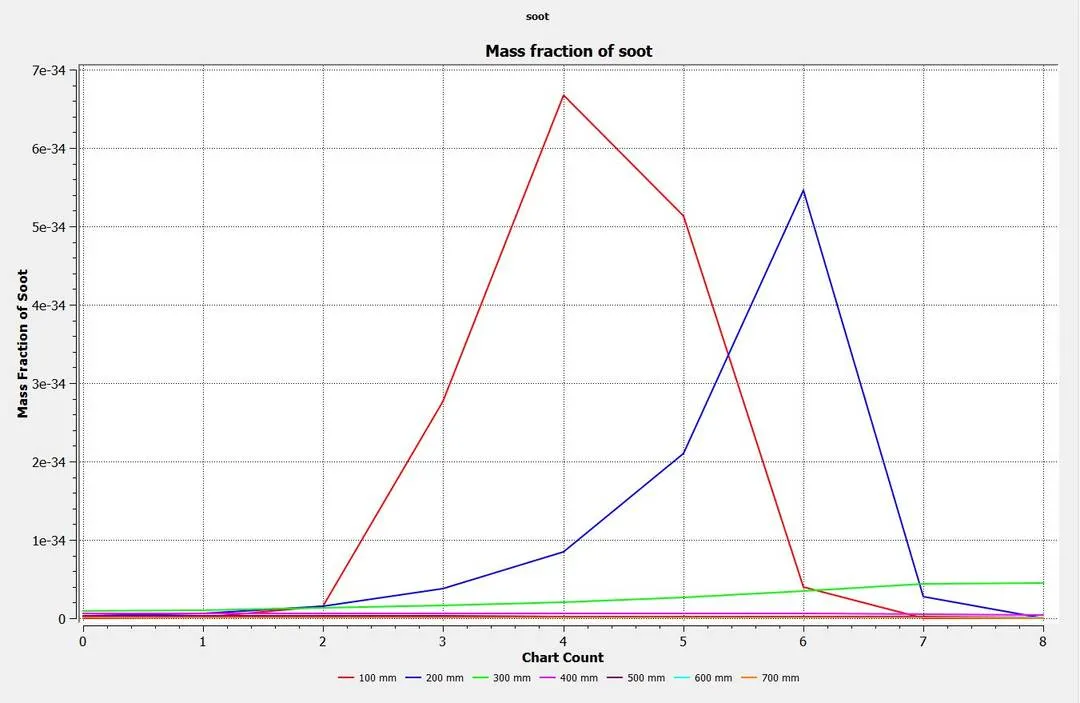
Soot:
Contour:
Plot:
Case 3: 30% water content in methane air
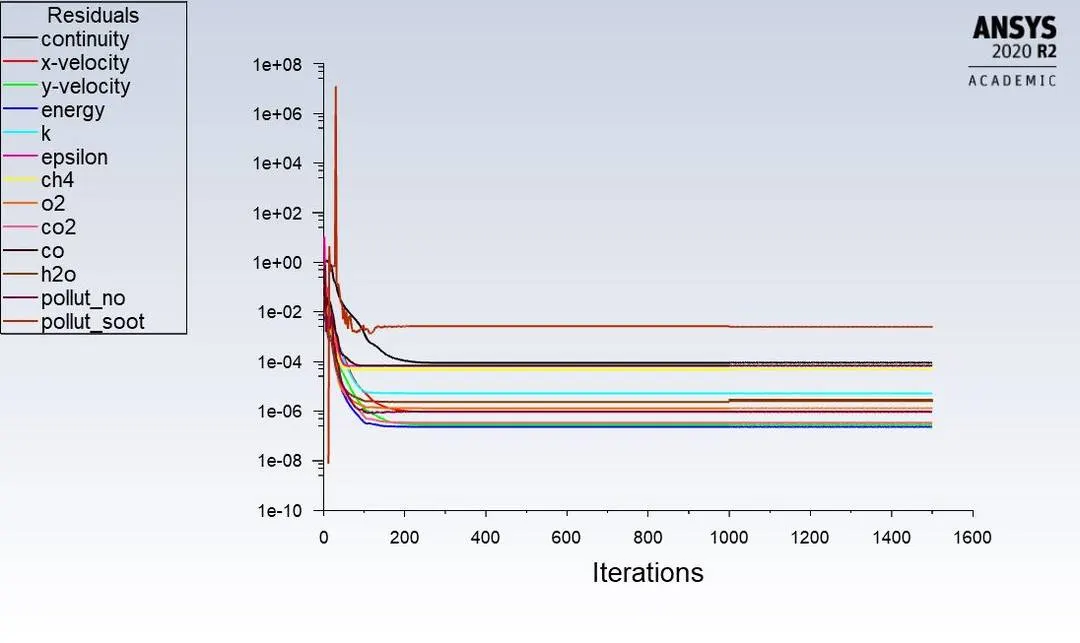
Residuals:
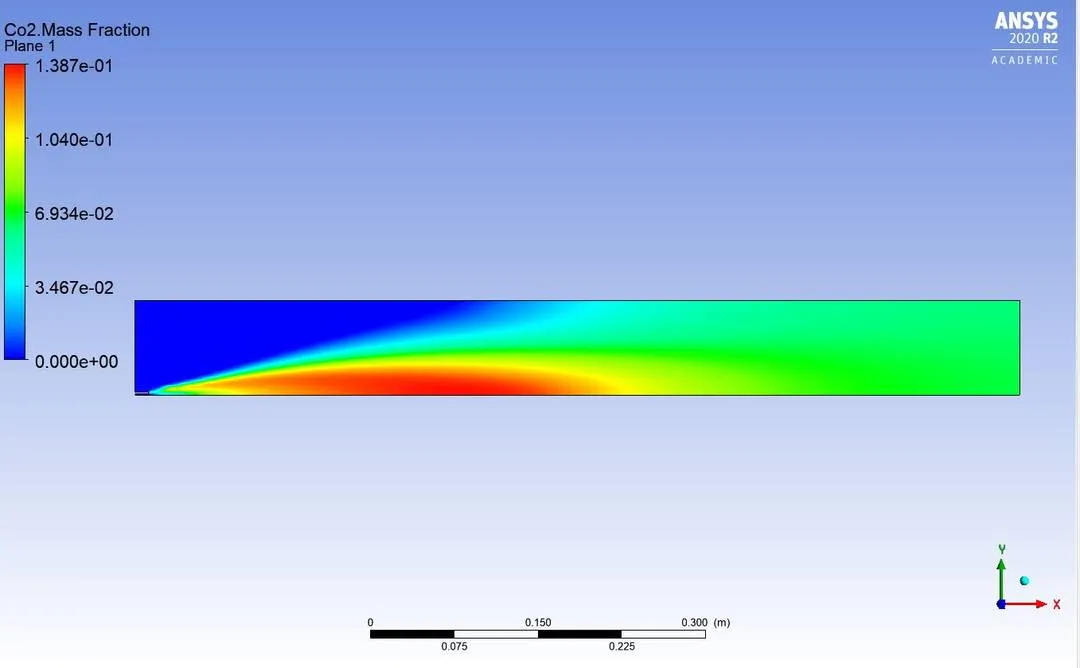
Carbon Dioxide CO2:
Contour:
Plot:
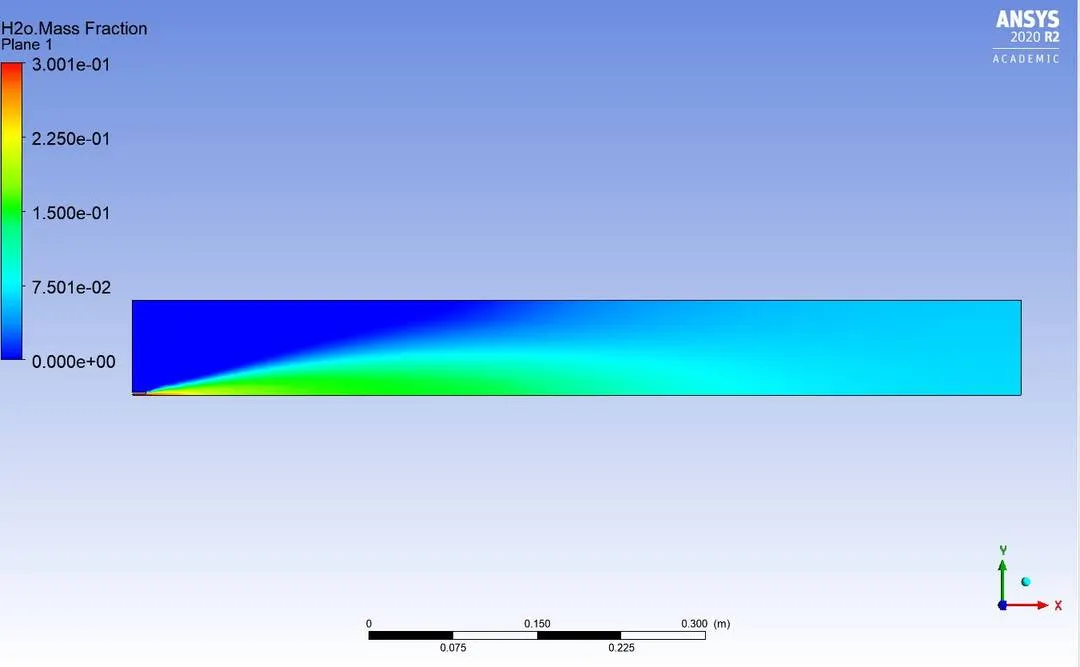
Water H20:
Contour:
Plot:
Methane CH4:
contour:
Plot:
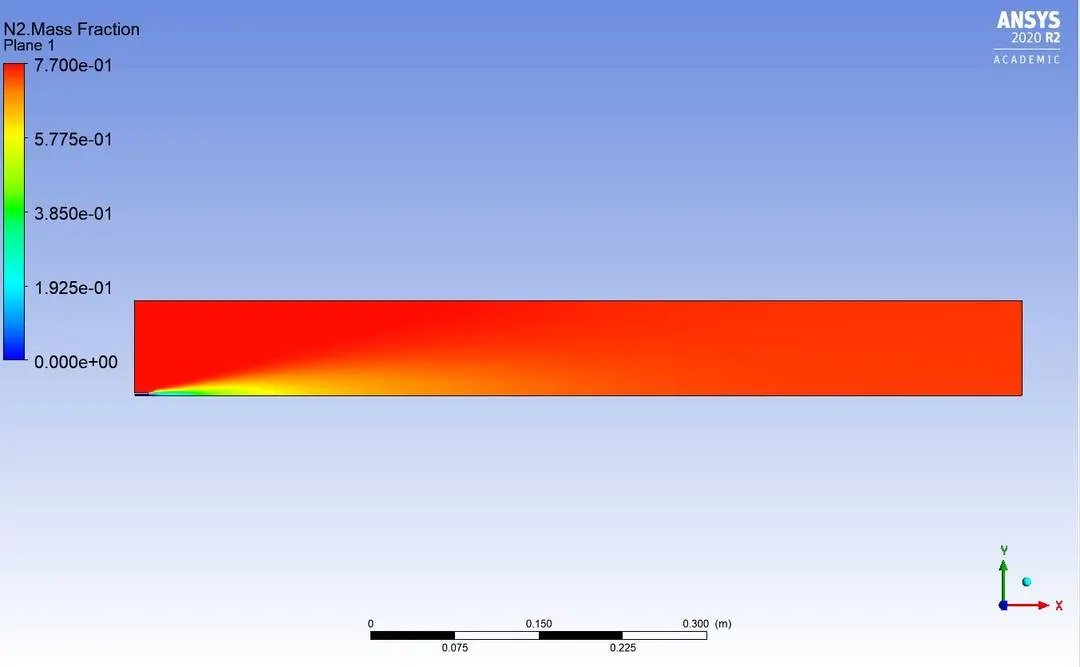
Nitrogen N2:
Contour:
Plot:
Oxygen O2:
Contour:
Plot:
Nitrogen Oxide NOx:
Contour:
Plot:
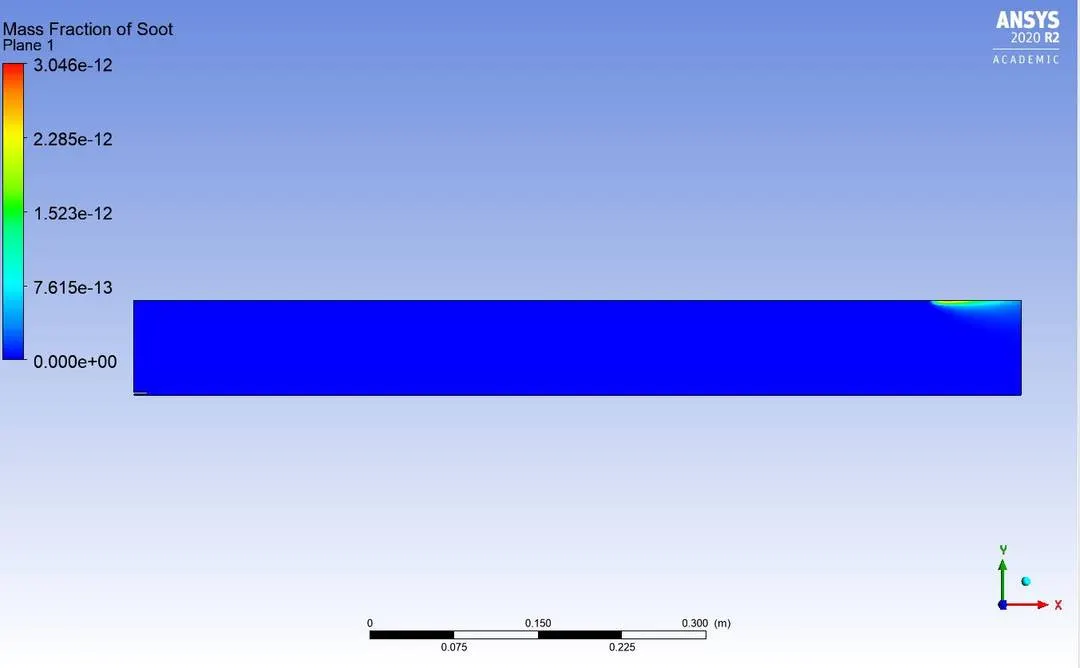
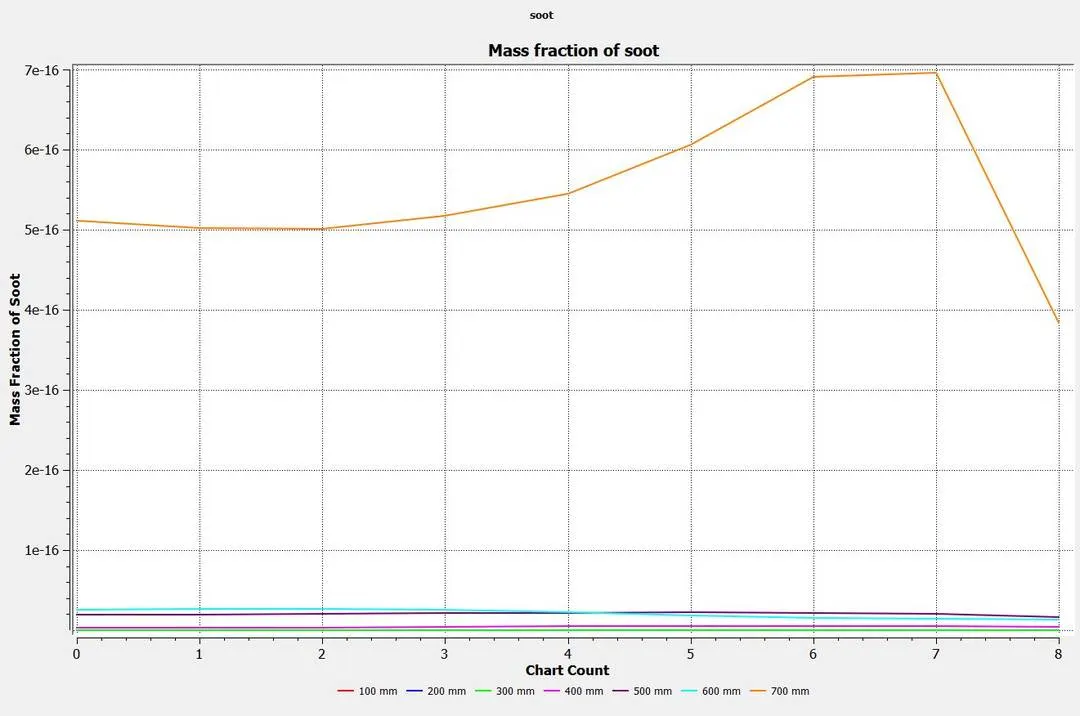
Soot:
Contour:
Plot:
Results table:
Below is the table of major pollutants

Results and conclusion:
- Pollutants tends to decrease with complete combustion and incomplete combustion leads to more soot formation.
- The water is added to decrease the pollutants.
- That is evident as due to addition of water we can claearly see that the NOx and soot got lower in value which is major pollutant.
- Co2 emmsions also decreased but the value is very small.
- Major pollutants can be decreased by not letting them directly into the atmosphere. Catalytic converter is one component which can be added to decrease amount of pollutants leaving into atmosphere.