Ahmed Body Challenge
Objective:
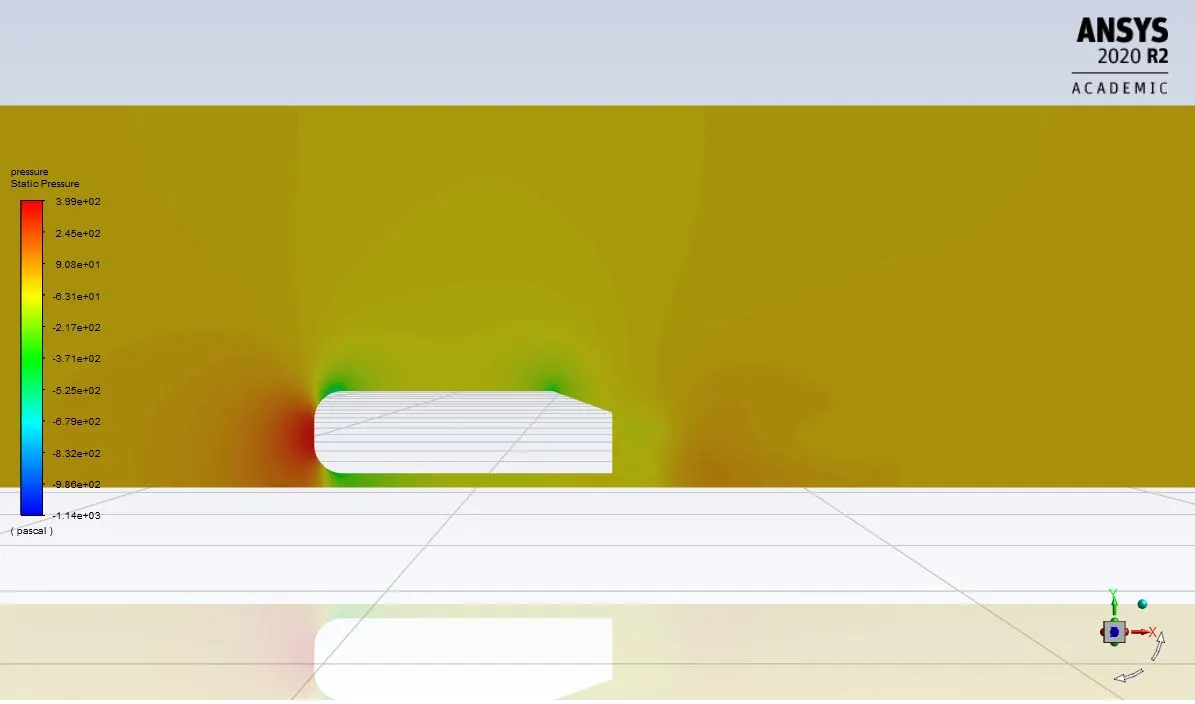
- To study the importance of Ahmed body and to explain the reason for the negative pressure in the wake region.
- To run steady state simulation using a density based solver to simulate the flow over the ahmed body at a velocity of 25m/s
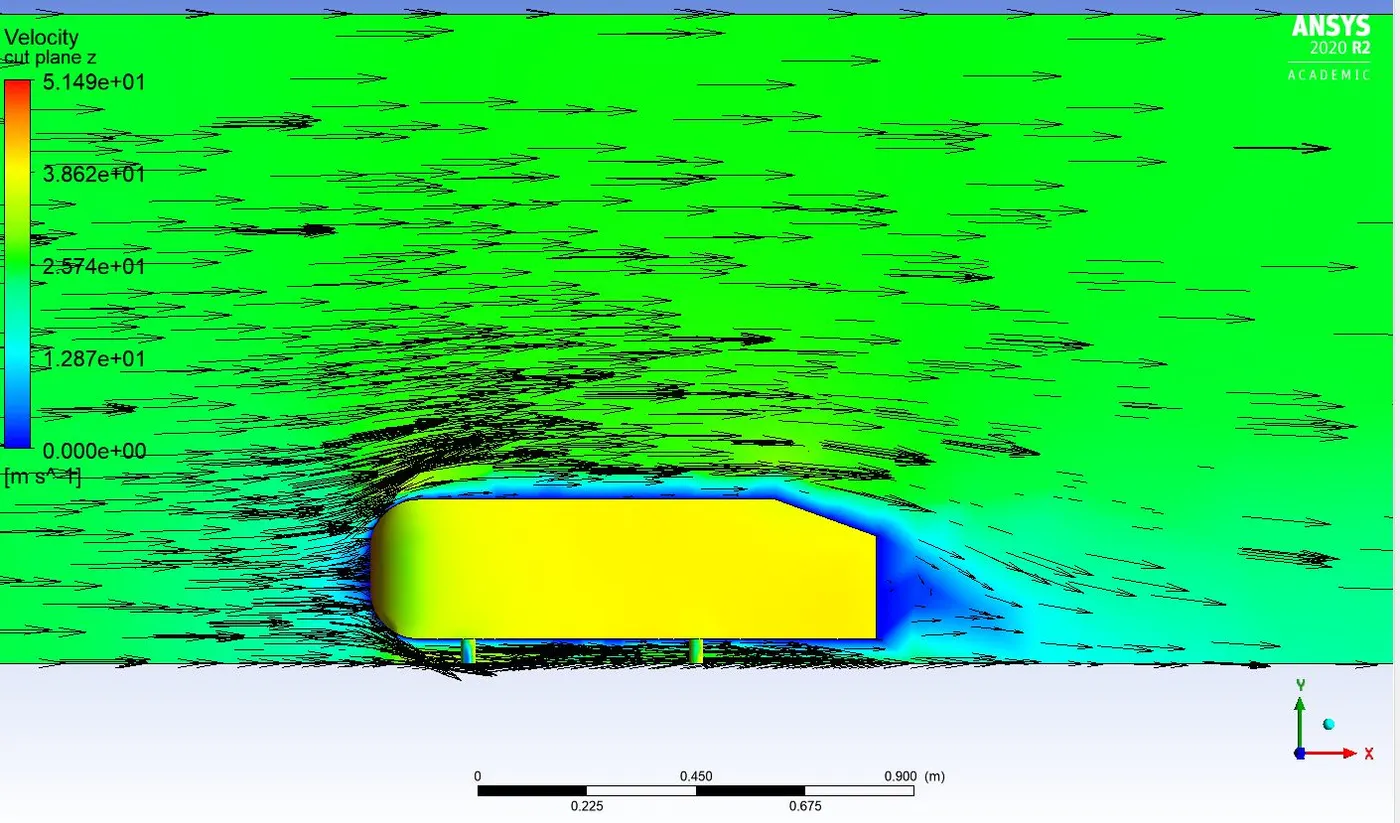
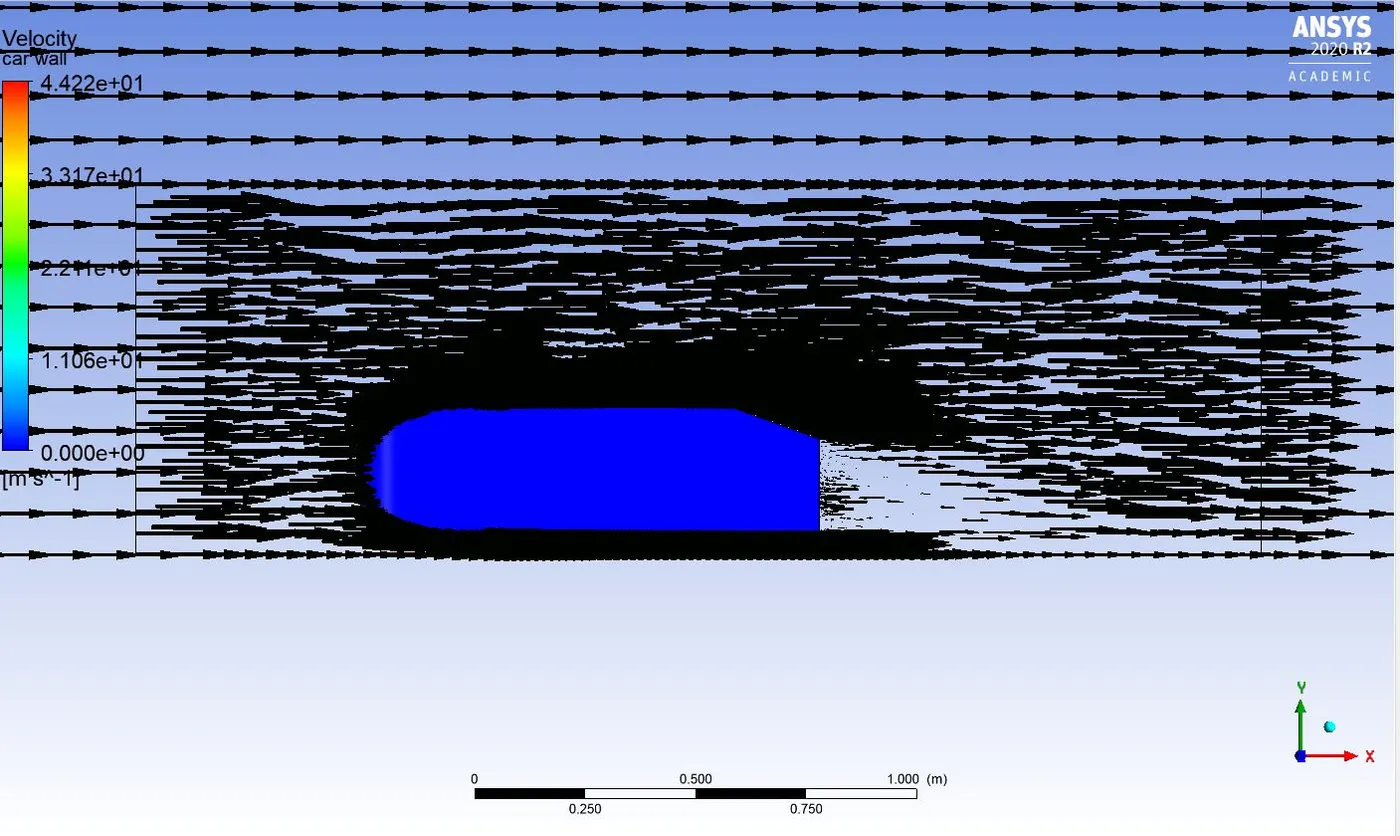
- To plot velocity and pressure contours and to plot a vector plot which clearly shows the wake region.
- To plot drag and lift coefficients.
- To perform a grid independency test and provide values of coefficient of drag and lift with each test.
Theory:
Ahmed body:
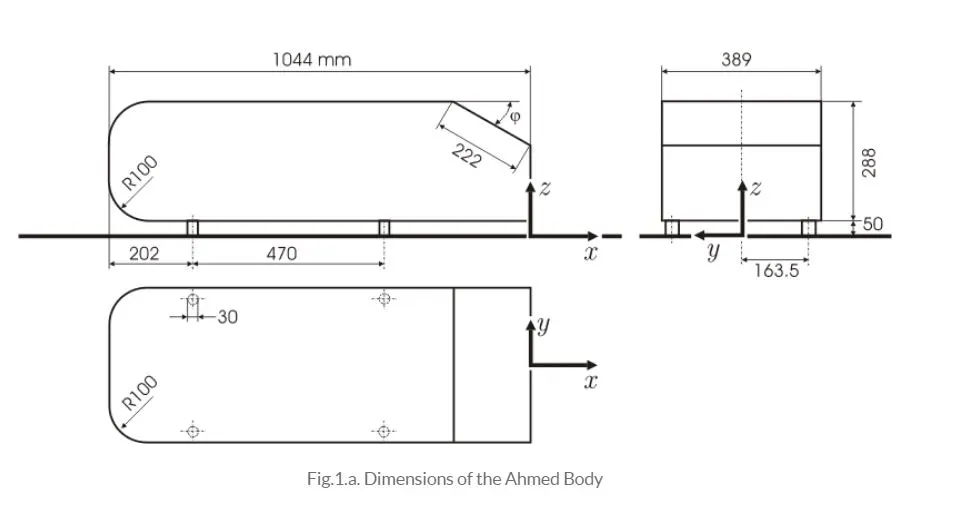
The Ahmed body is a simplified car body model which is named after the person S.R Ahmed . The airflow around the Ahmed body captures the essential flow features around an automobile. Although it has a very simple shape ,it allows us to capture charactersitics features that are relevant to bodies in the automobile domain. It is used to describe the turbulent flow field around a car like geometry which is shown in below figure.
Importance:
Ahmed body represents a simplistic ground vehicle geometry of a bluff body. Due to its simplistic shape it allows to capture accurate flow simulation.On a broader scale the Ahmed body gives a pretty good estimation of turbulence around the body of the model and helps in study the boundary layer and point of separation in the slant area .
The growing need of fuel and certain regulation and environmental aspect jointly congregate to better fuel efficicency of the vehicle. Inorder to get a better milaege and to save fuel is by getting more aerodynamic or in other ways how do we evade air resistance. so by setting up a simple model we can study the flow characteristics. This help researchers help is getting down the coefficient of drag low by simulating models like ahmed body to estimate the results.
Reason for the negative pressure in the wake region:
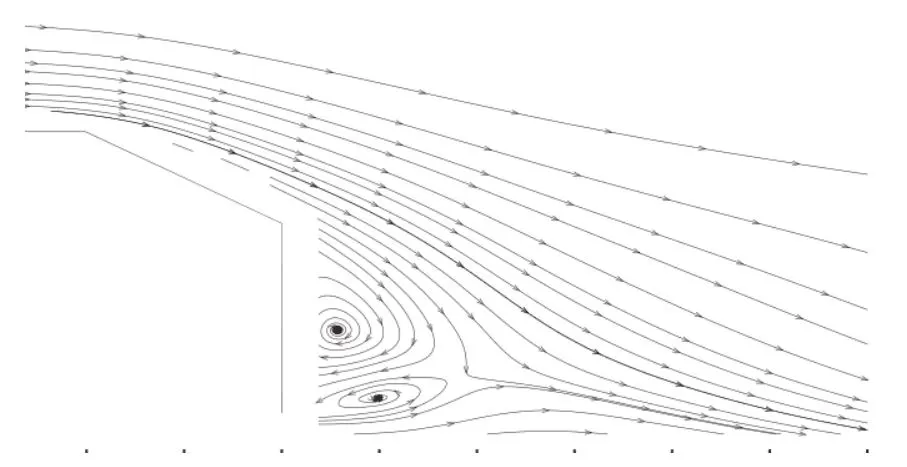
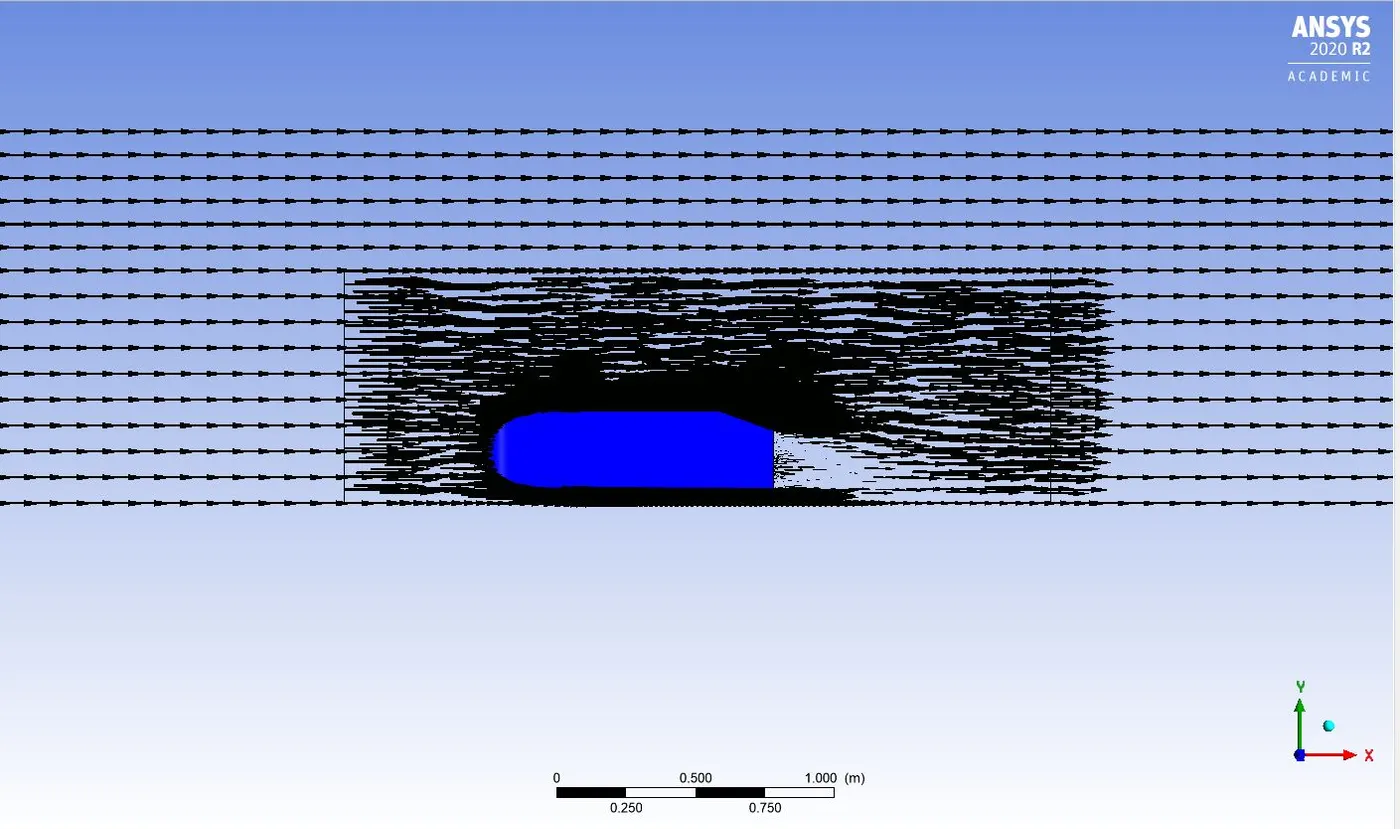
A strong recirculation region is formed as the flow separates at the top of the slant section of the model. The vortices are formed which look like inward in direction. These inward rotating pair of vortices with increasing speed are generated and are observed in fastback vehicles which has sloping roof line as that to a sedan. The inward rotating vortices are seen at the end of c pilllar behind the vehicle(wake region) and extend far into the wake region and generates a field of downwind in the enclosed region between the free stream and ground. As the flow separates at the lower edge of the slant, this produces strong negative pressure at that position and aerodynamic drag reaches a maximum at this state. The slant angle of less than 30 degrees and more than 12 degress is where we see the effect in wake region. so we can say that the wake region negative pressure is dependant on the slant height and drag on the model.
Significance of point of separation:
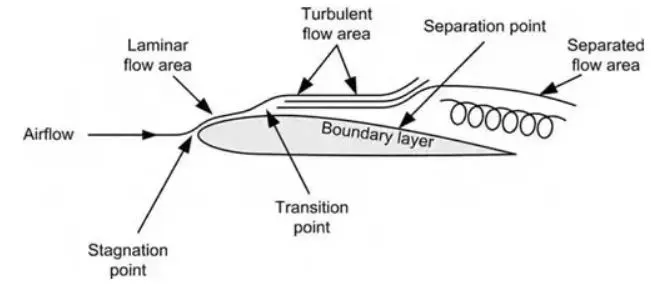
when a solid body is immersed in a flowing fluid , a thin layer of fluid called the boundary layer is formed adjacent to the wall of solid body. In this thin layer of fluid the velocity varies from zero to free stream velocity of the fluid in the direction normal to the solid body. Along the length of solid body the thickness of the boundary layer increases. The fluid layer adjacent to the solid surface has to do work against the surface friction at the expense of its kinetic energy. The loss in Kinetic energy is recovered by the adjacent layers by momentum exchange process.By this the velocity of the layer goes on decreasing. Along a length of the wall of the model there might be a point from where the fluid cannot stick with the body as its becoming slower and gets separated from the flow. This phenomenon is called the boundary layer separation. The point at which the boundary layer is on the verge of separation is called point of separation.
At the starting the flow due to good initial velocity of the flow, the flow gets accelarated. Due to increase in velocity the pressure decreses in the direction of flow so the pressure gradient is negative and the flow gets separated. At the point of seapration the velocity gradient wrt to y direction is zero `(delu)/(dely)=0`. At the point of separation certain portion adjacent to wall of the body has back flow and eddies and continously formed in the region so the loss of kinetic energy is more. The point of separation has adverse pressure gradients which increases the drag on the body.
Solving Approach taken for Ahmed body:
- Geometry preparation.
- single enclosure and double enclosure
- Meshing
- setting up y+ inflation layer for ahmed body.
- setting up reference values.
- setting up solver ; in this case is density based.
- using k epsilon turbulence model with standard wall functions
- setting up drag and lift coeffcients
- monitoring the drag and lift along with velocity and pressure contours
- post processing the results for velocity vectors and velocity plot.
Geometry:
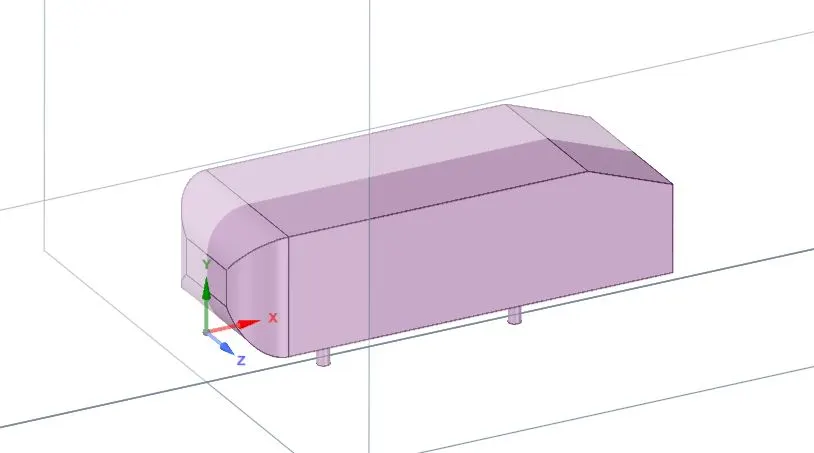
the enclosure for ahmed body:
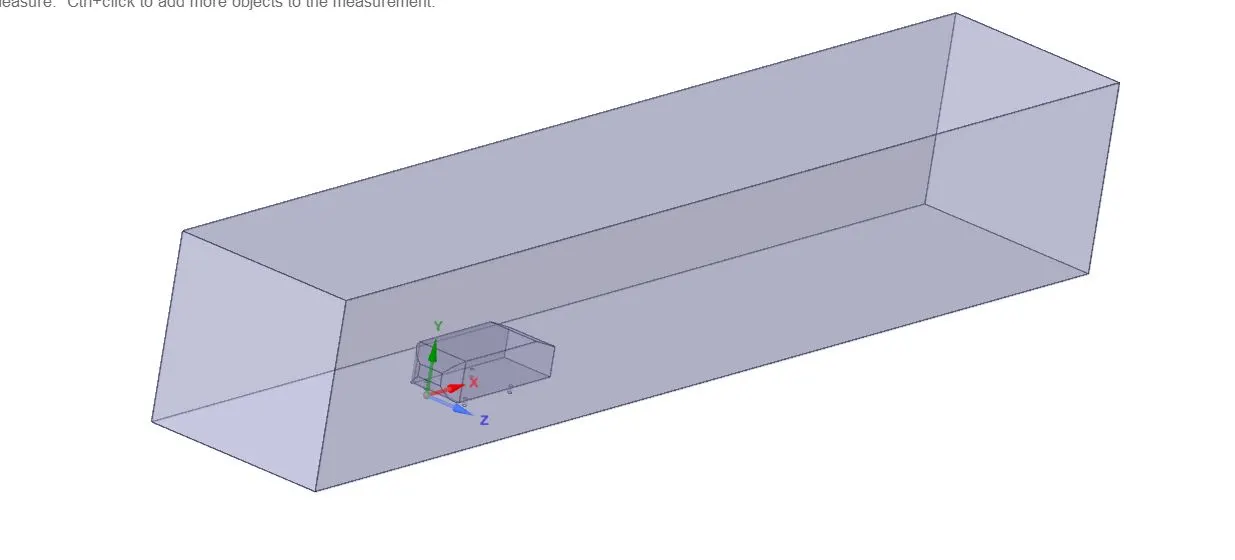
single enclosure :
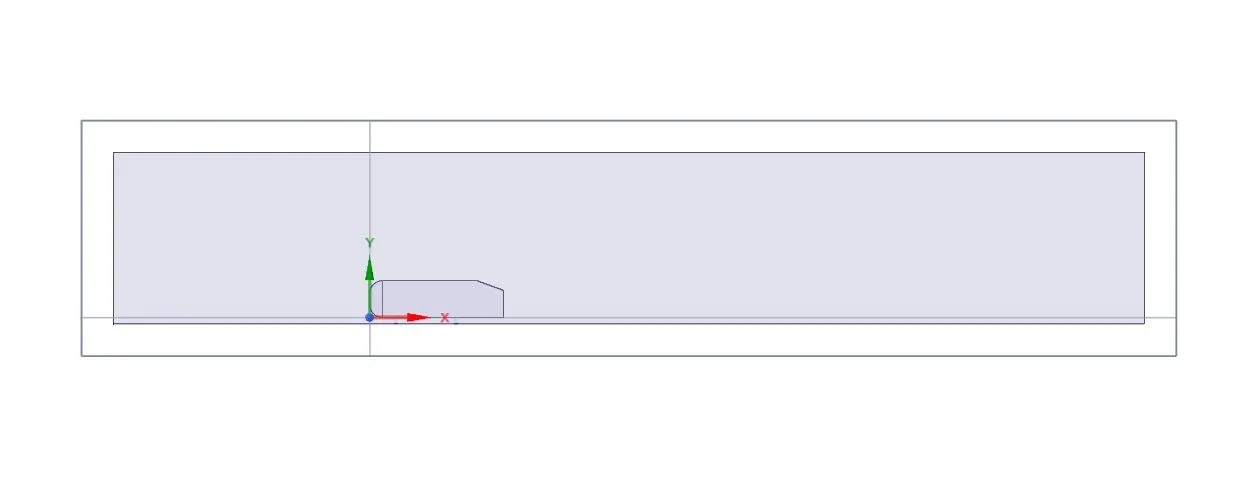
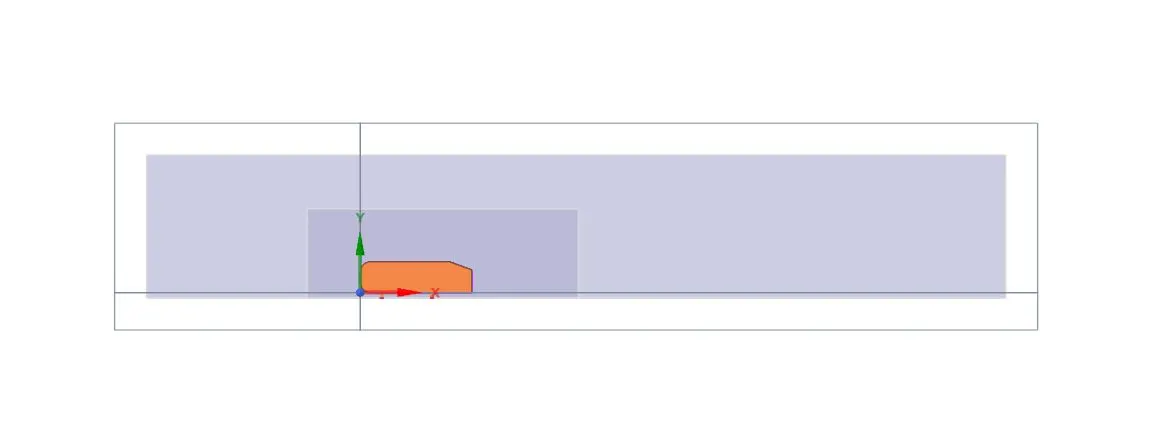
Double enclosure with body split:
Preparation of geometry:
- The cases which we will run need two different setups .
- The first will be a baseline run with single enclosure and second will be double enclosure
Cases we are going to setup:
- Baseline mesh case setup with single enclosure around Ahmed body.
- Refined mesh case setup with double enclosure around Ahmed body with y+ value of 70.
Grid dependency test for three cases:
- case 1 : Refined mesh case setup with an y+ value of 100
- case 2: Refined mesh case setup with an y+ value of 70
- case 3: Refined mesh case setup with an y+ value of 30
Baseline mesh case setup with single enclosure around Ahmed body.
Work flowpath:
- mesh
- setting up physics in fluent
- pre processing Results
- post-processing
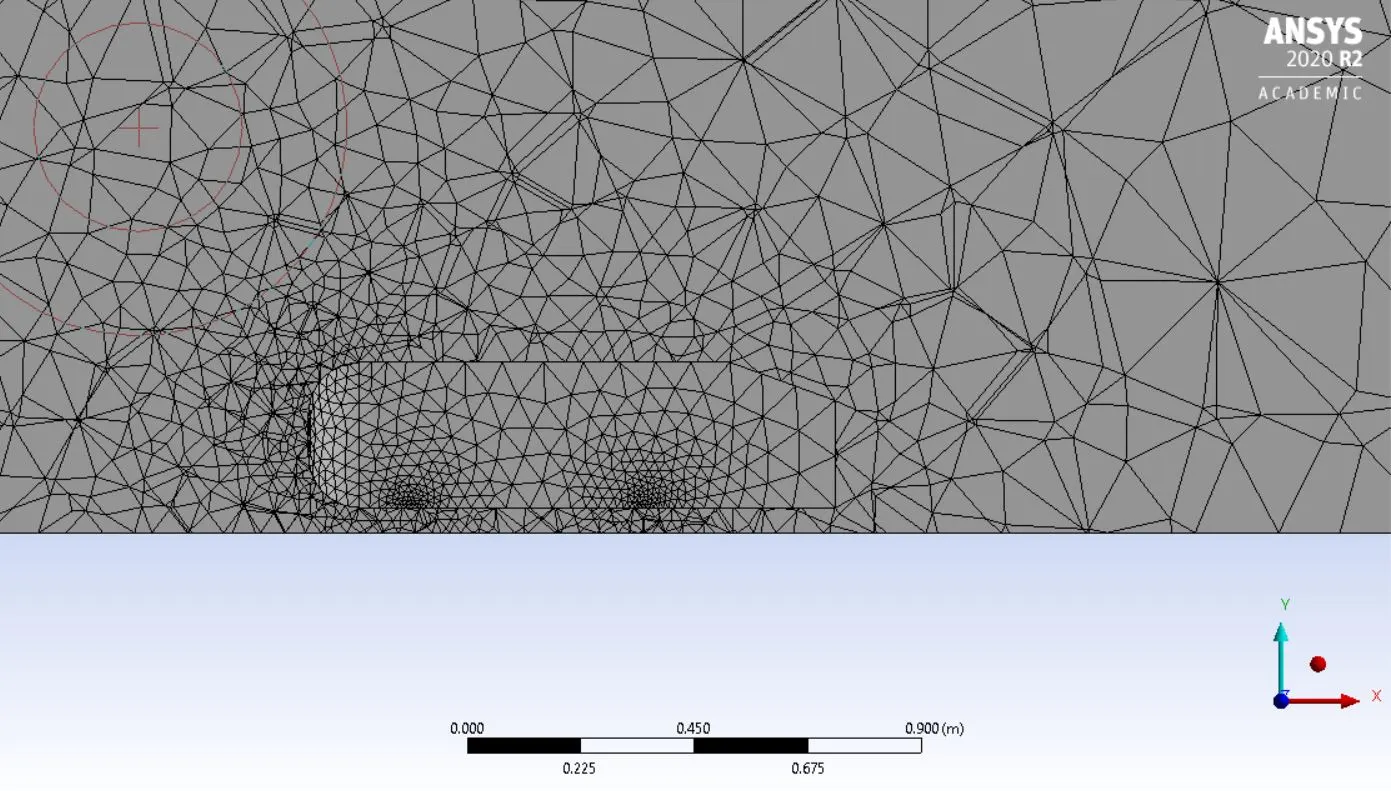
Mesh:
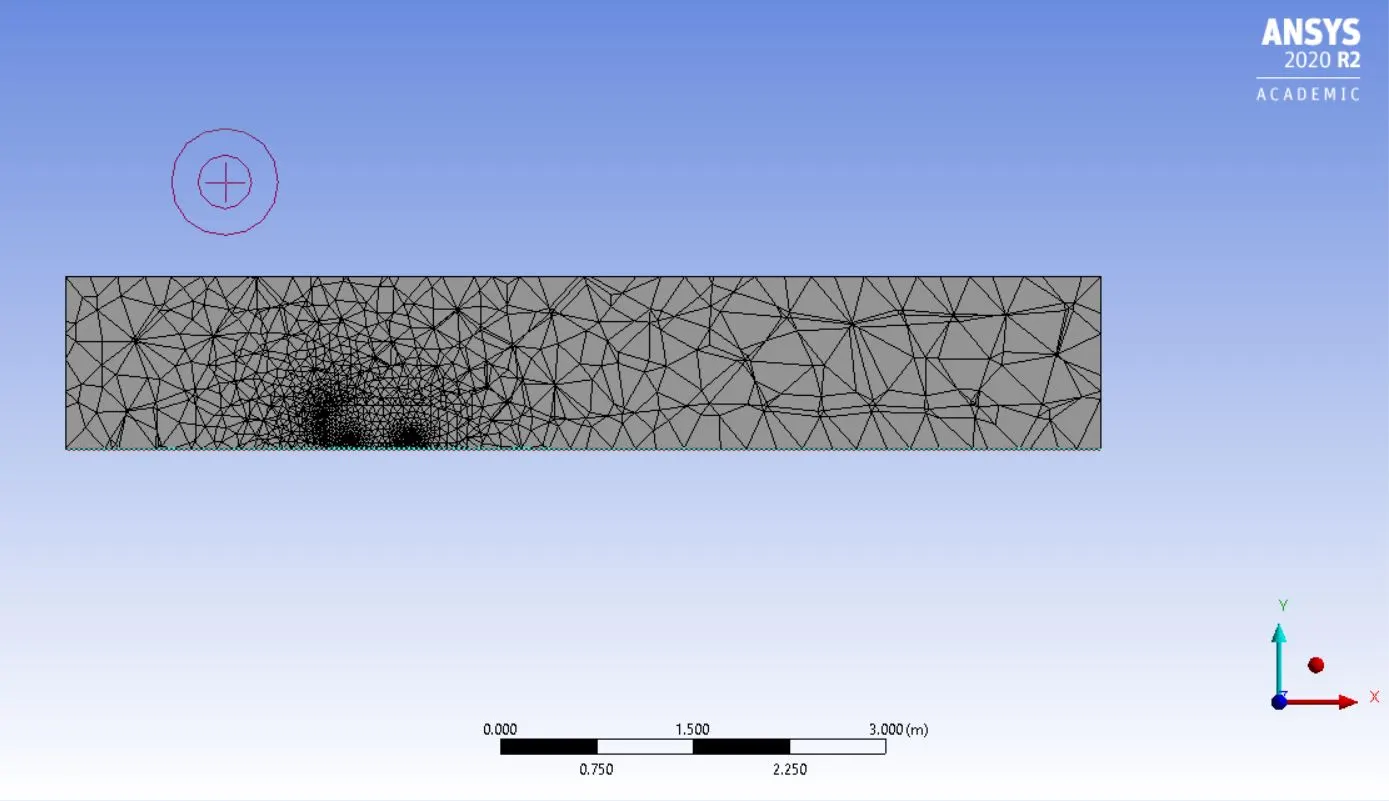
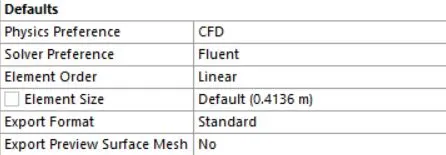
element size:

Fluent setup
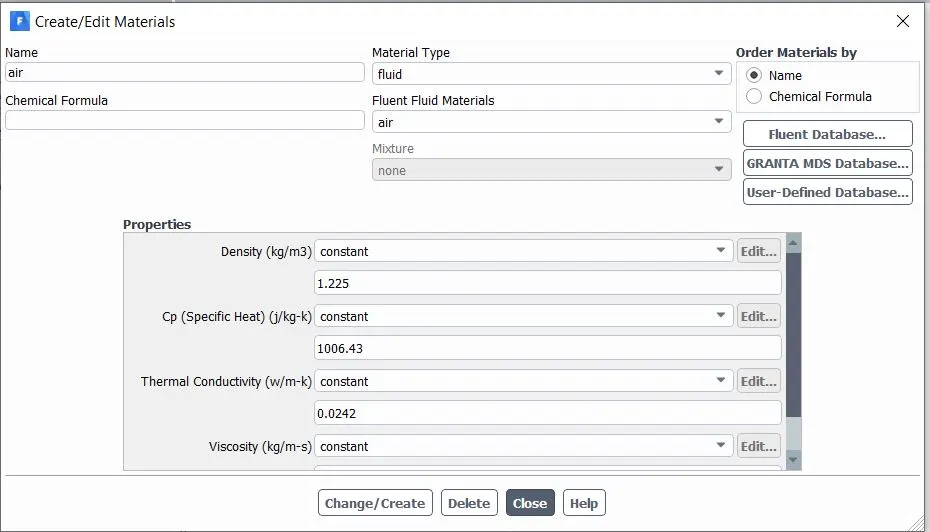
Material properties:
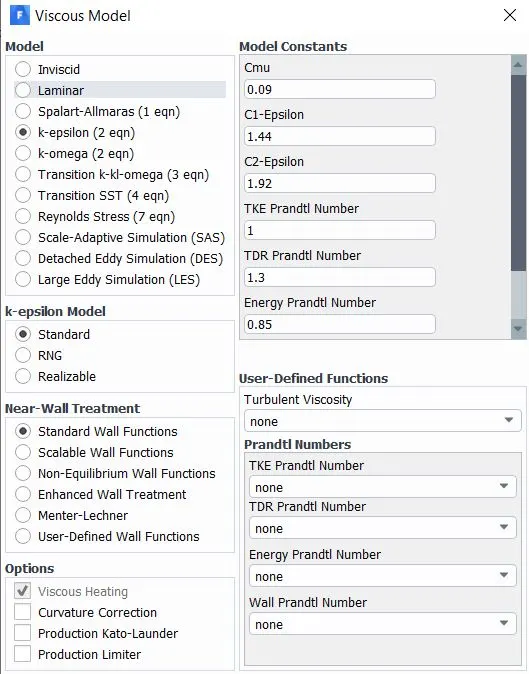
solving:
The model used is k epsilon with standard wall function which has two equations to solve.
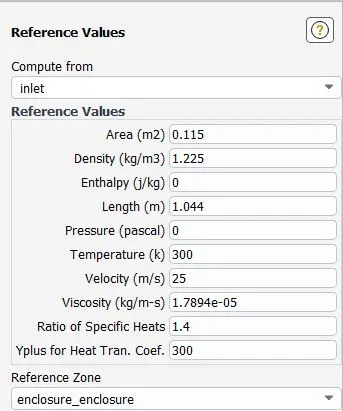
Pre-processing results:
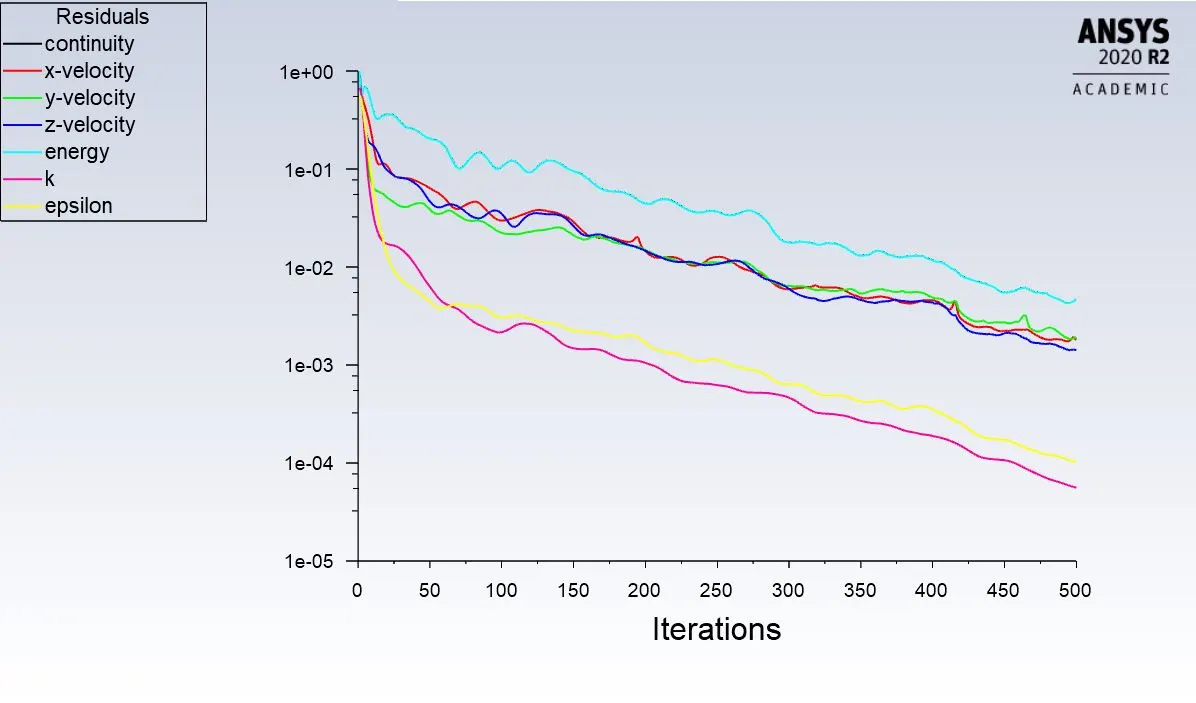
Residuals:
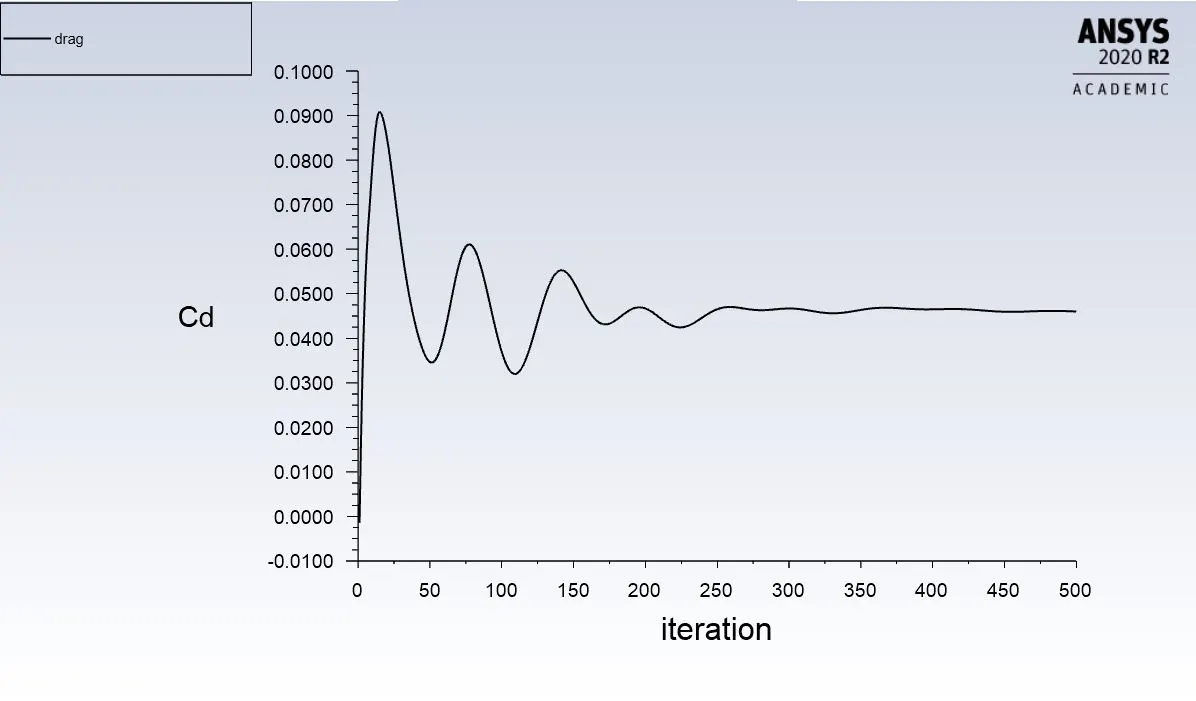
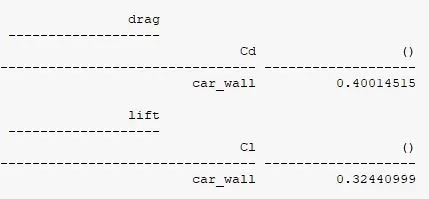
Drag and lift:
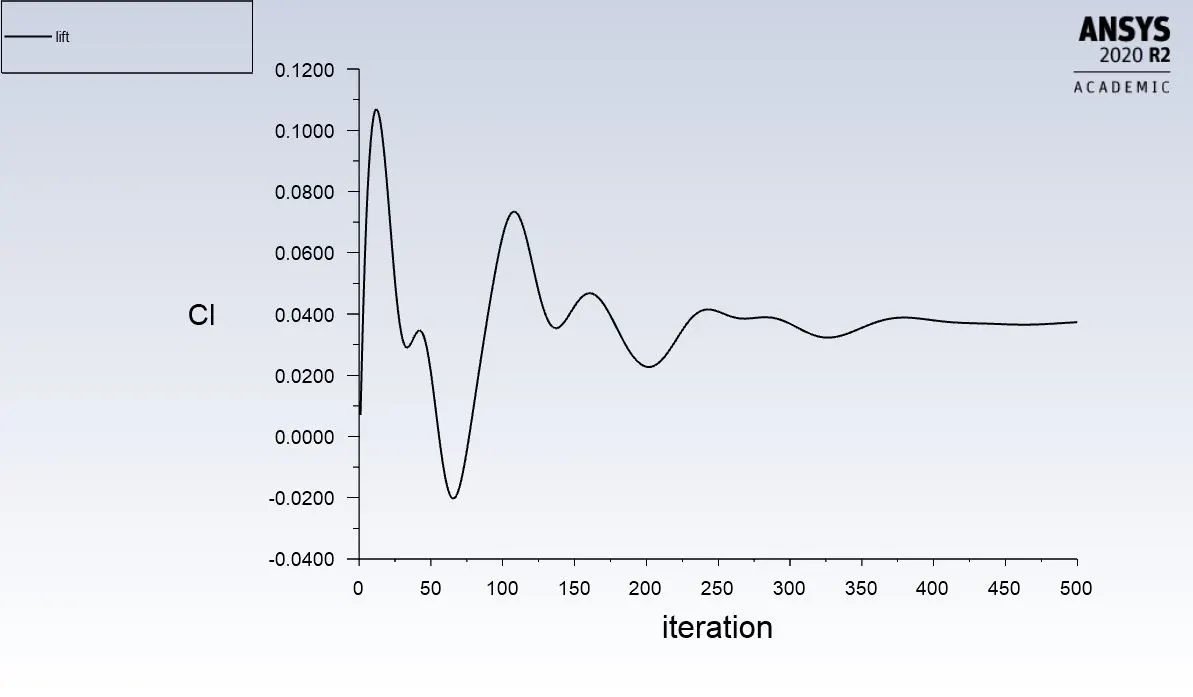
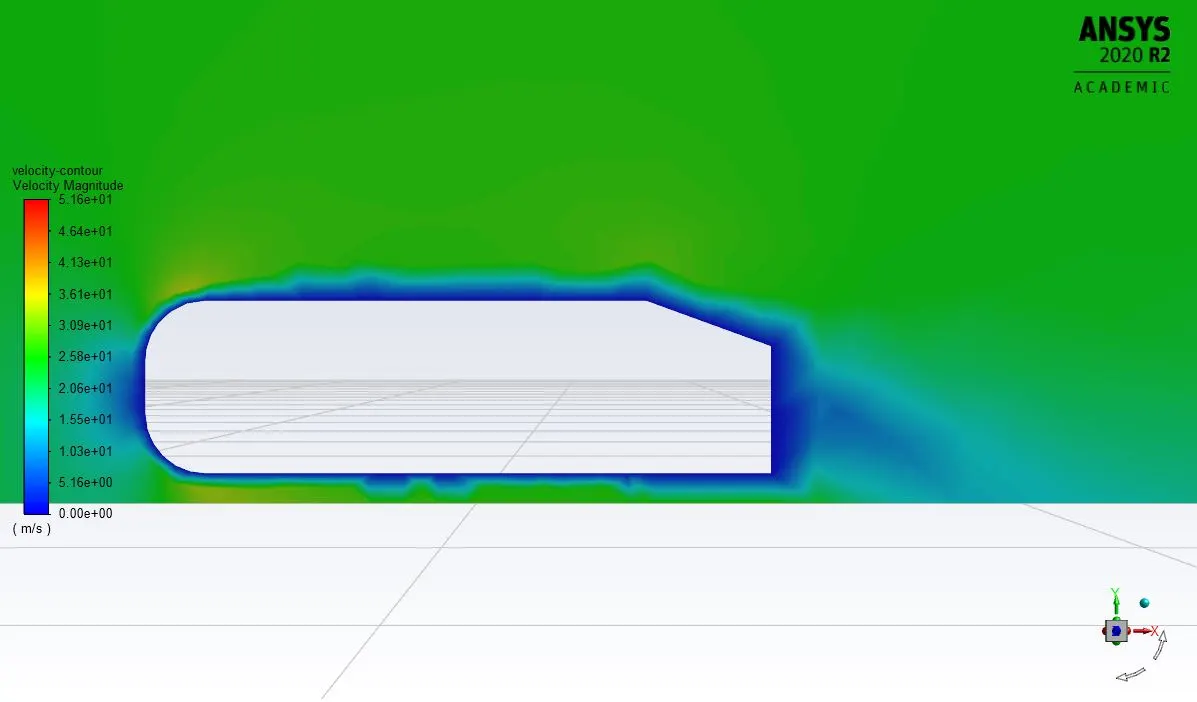
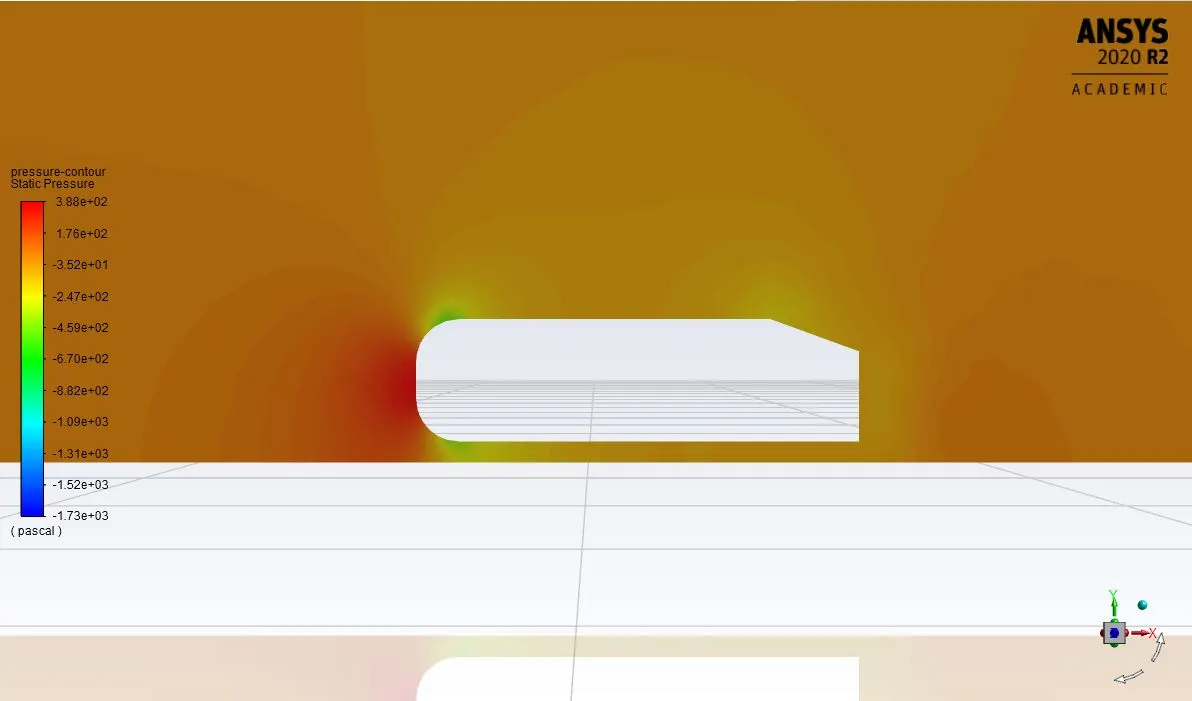
velocity and Pressure contour:
Post processing:
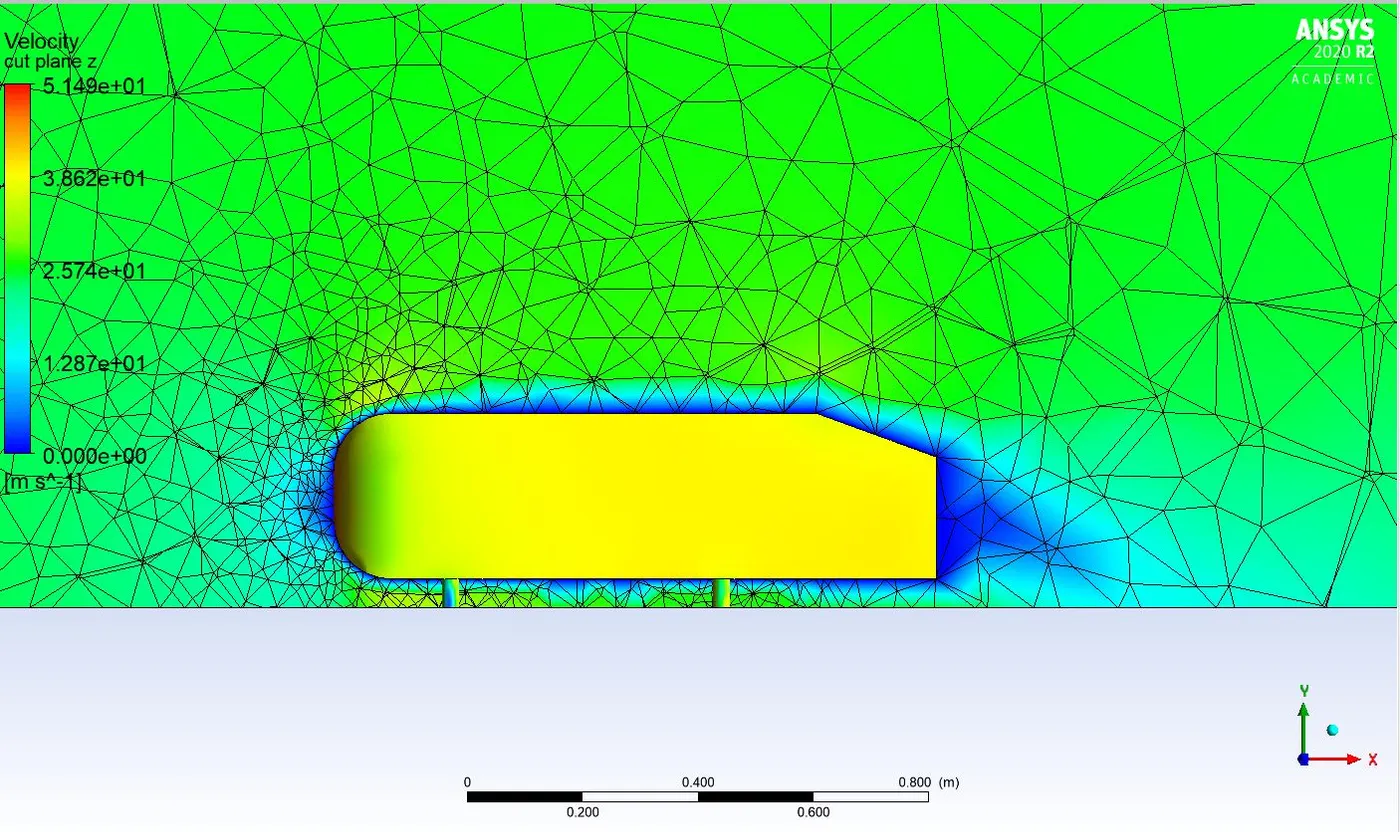
velocity vector:
-----------------------------------------------------Refined mesh case setup with double enclosure around Ahmed body with y+ value of 70------------------------------
case table:

Mesh:
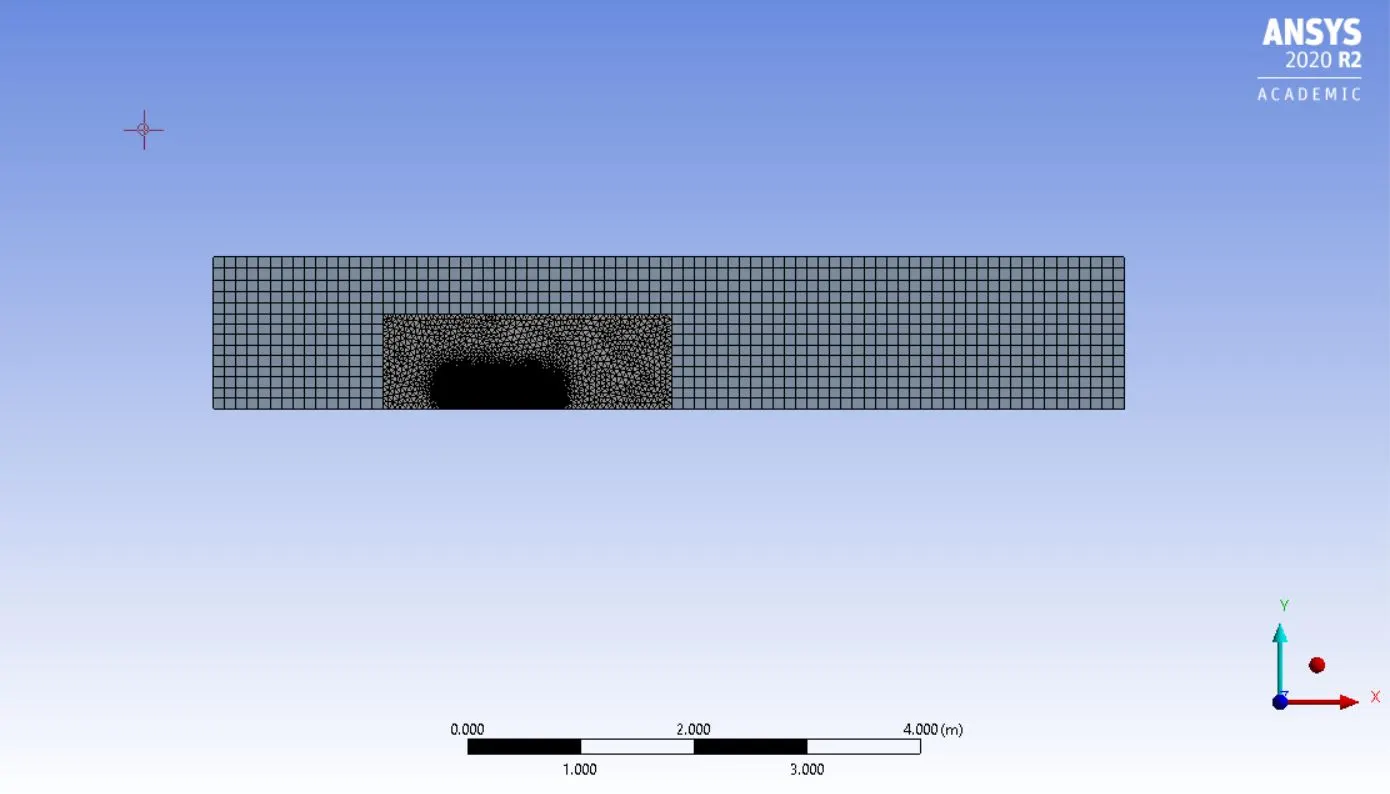
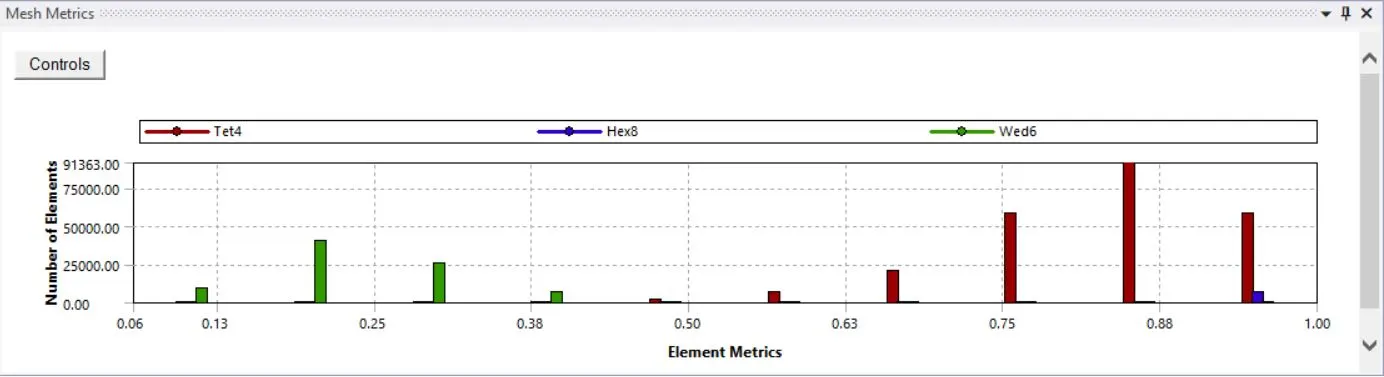
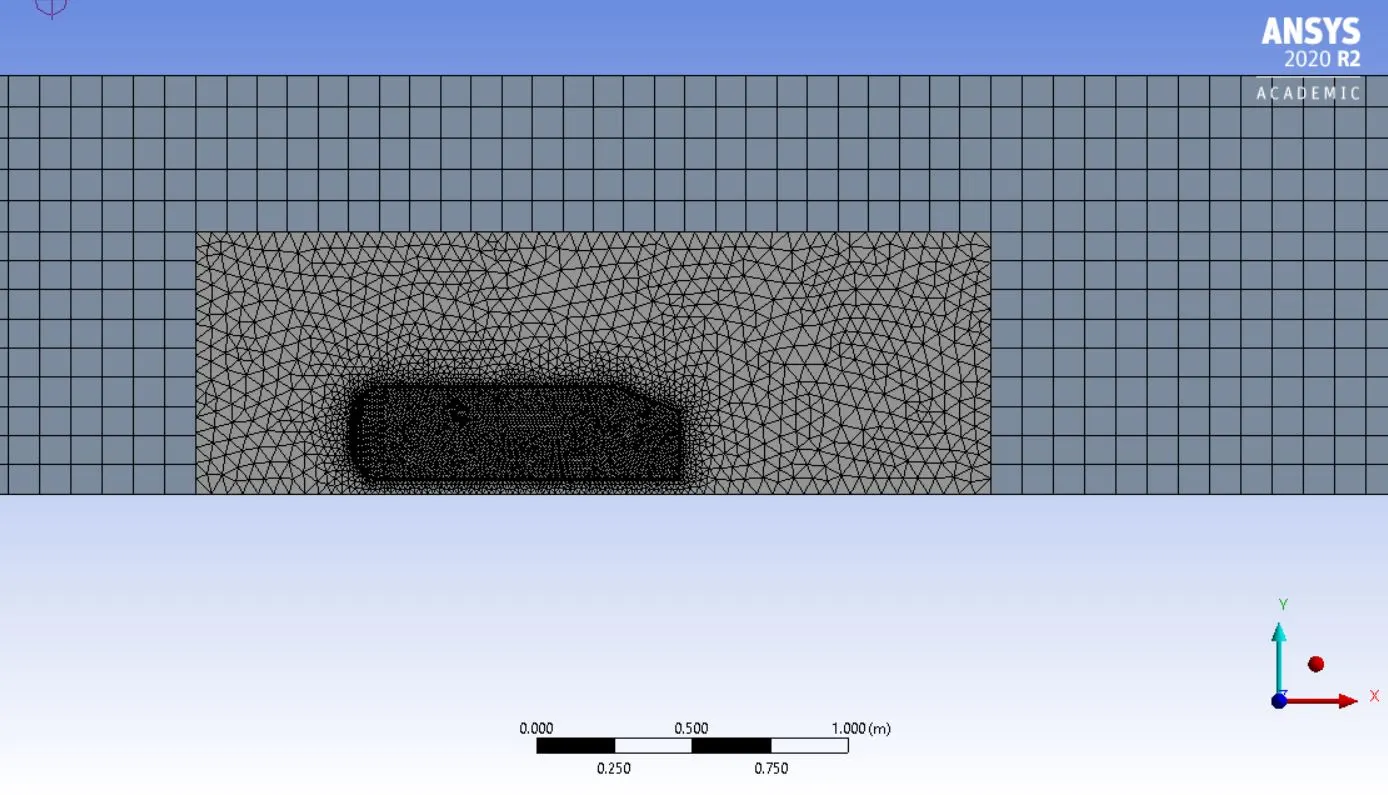
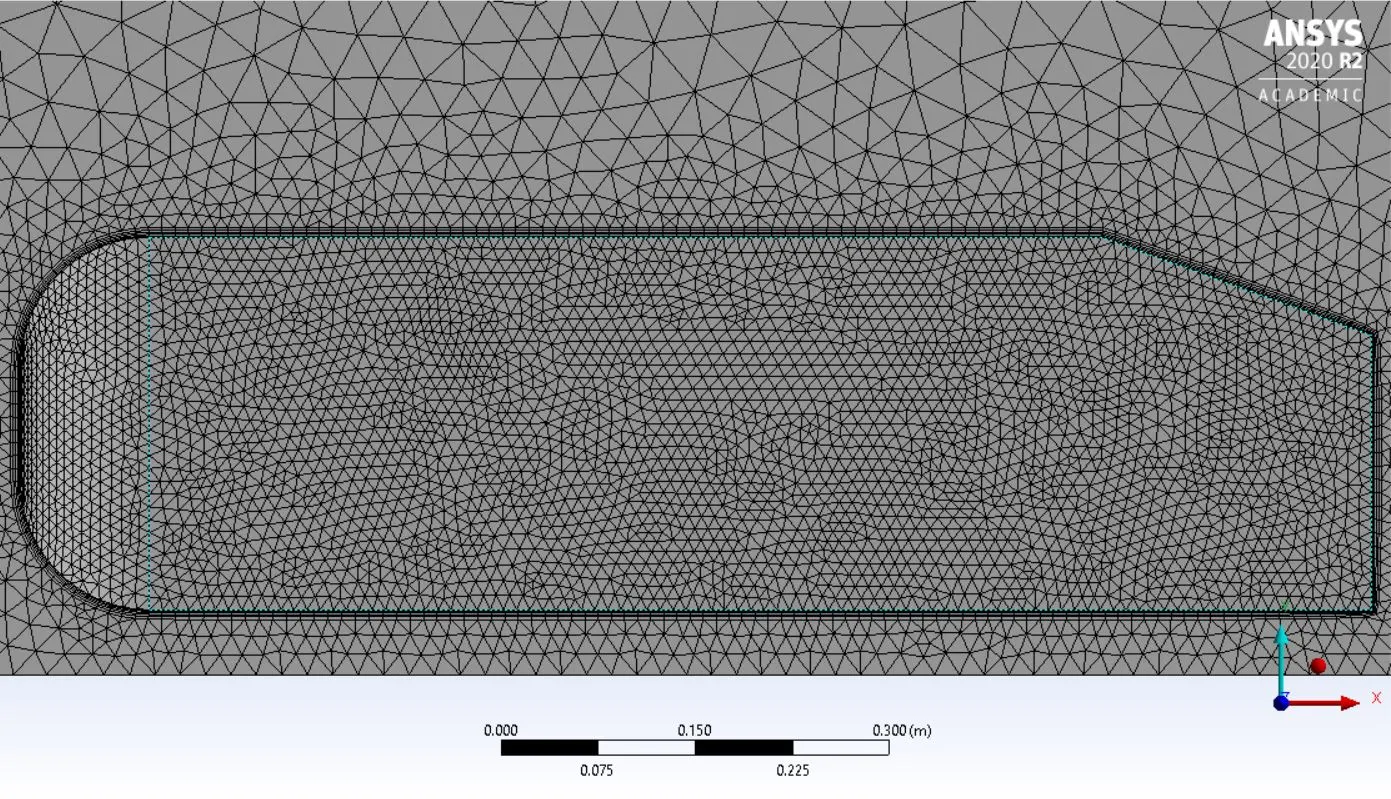
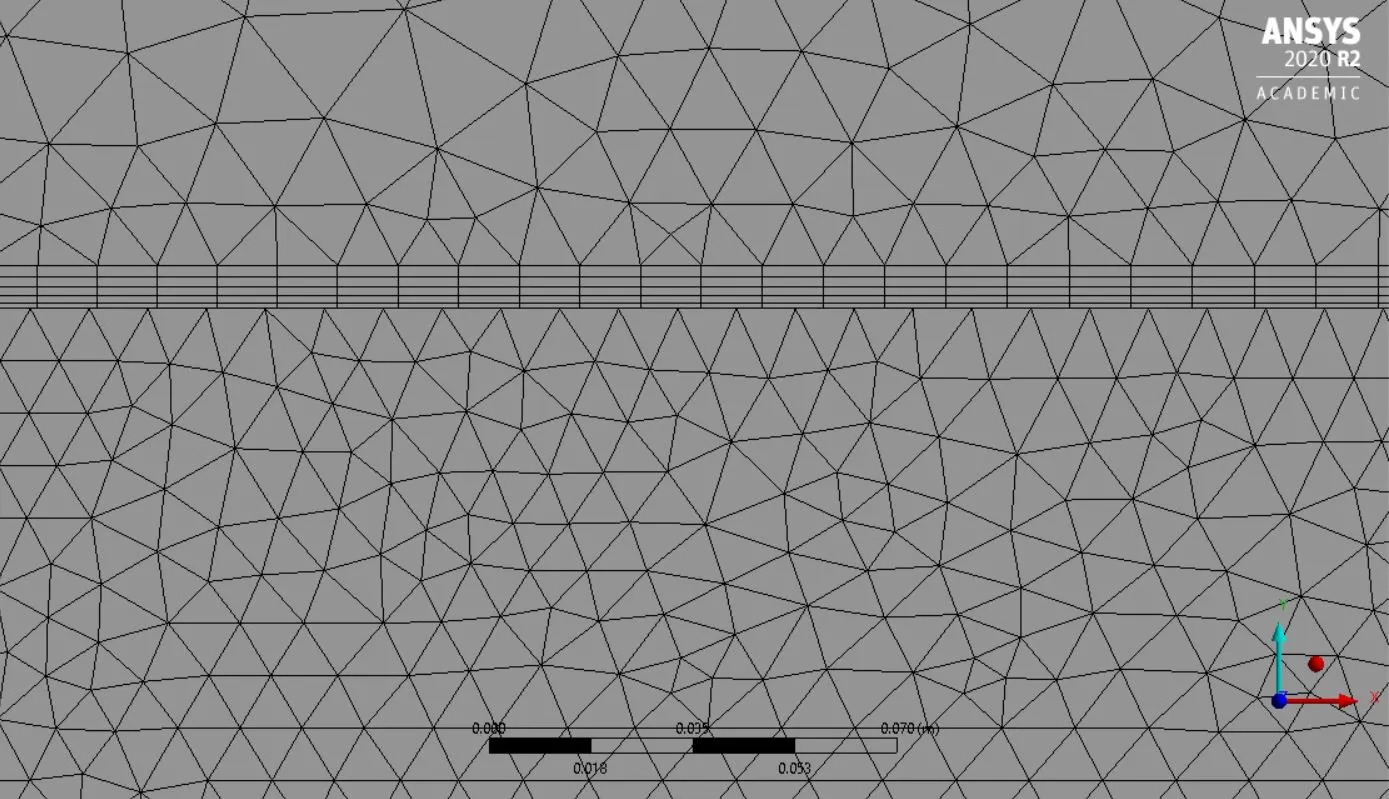
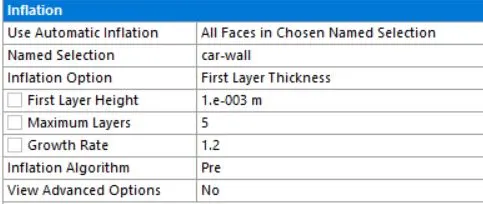
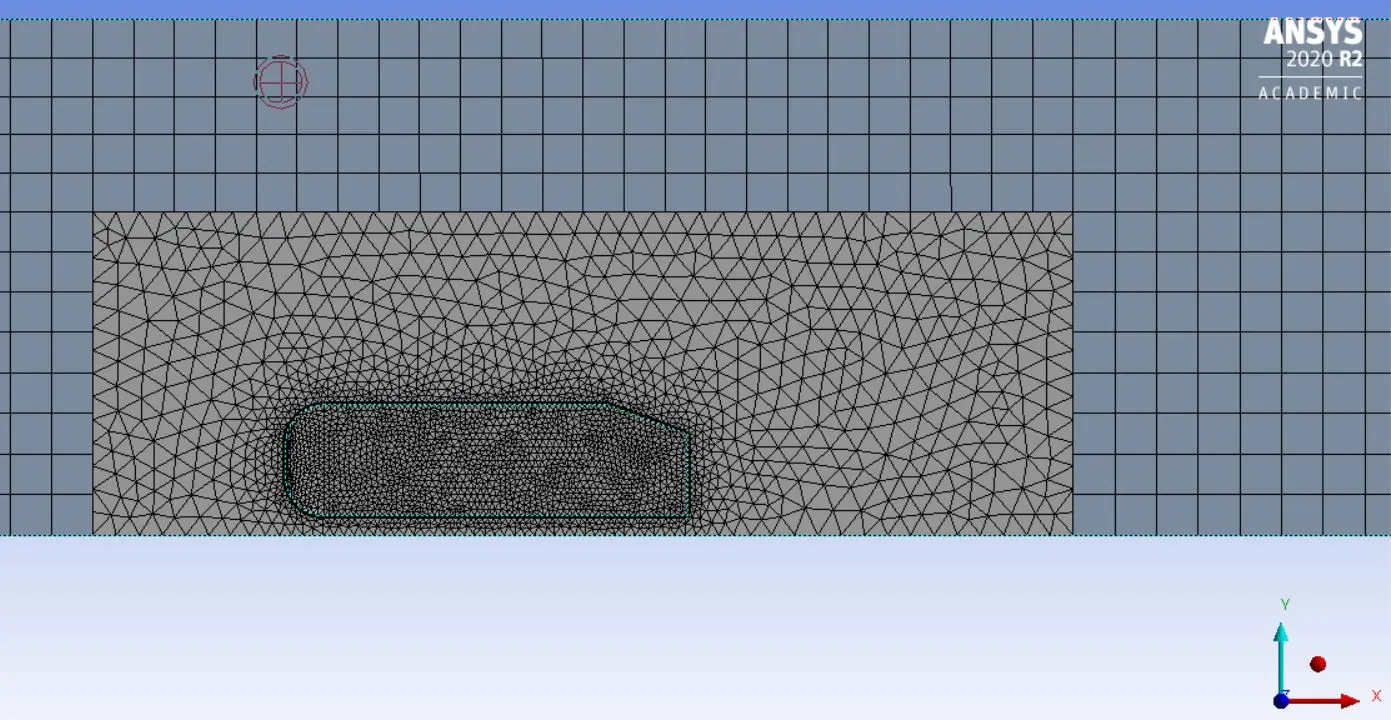
element size and inflation layer:
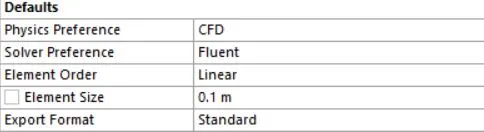

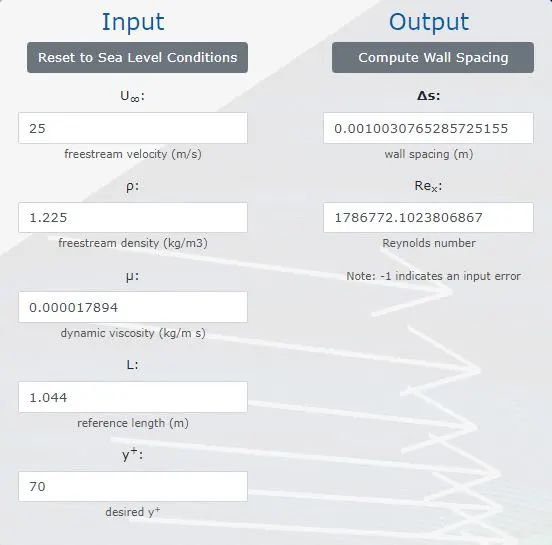
Y+ values:
Reynolds number:
`Re=(rhoVL)/(mu)=(1.225*25*1.004)/(1.7894*10^-5)=1718313.4=1.72*10^6`
Frictional Coefficient:
`Cf=0.0576*Re^-0.2`
`Cf=0.0576(1.72*10^6)^-0.2`
`Cf=0.003231`
Wall shear stress:
`tau=0.5*Cf*rho*u^2`
`tau=0.5*0.003231*1.225(25)^2`
`tau=1.23695548`
Frictional Velocity:
`Ut=sqrt((tau)/(rho))=1.005`
First Layer thickness:
`Deltay=(mu*y+)/(rho*Ut)=(1.7894*10^-5*70)/(1.225*1.005)=1mm`
Fluent setup:
Note: The setup is same to that of the baseline mesh except the reference value area is change to 0.56016 m^2
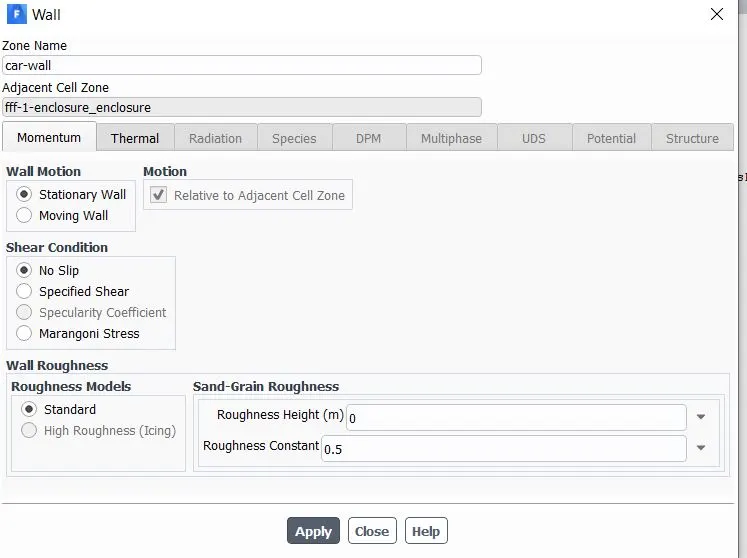
Boundary condition:
inlet velocity of 25m/s
temp=300k
outlet pressure of zero gauge
symmetry
for walls we use wall motion
Pre processing Results:
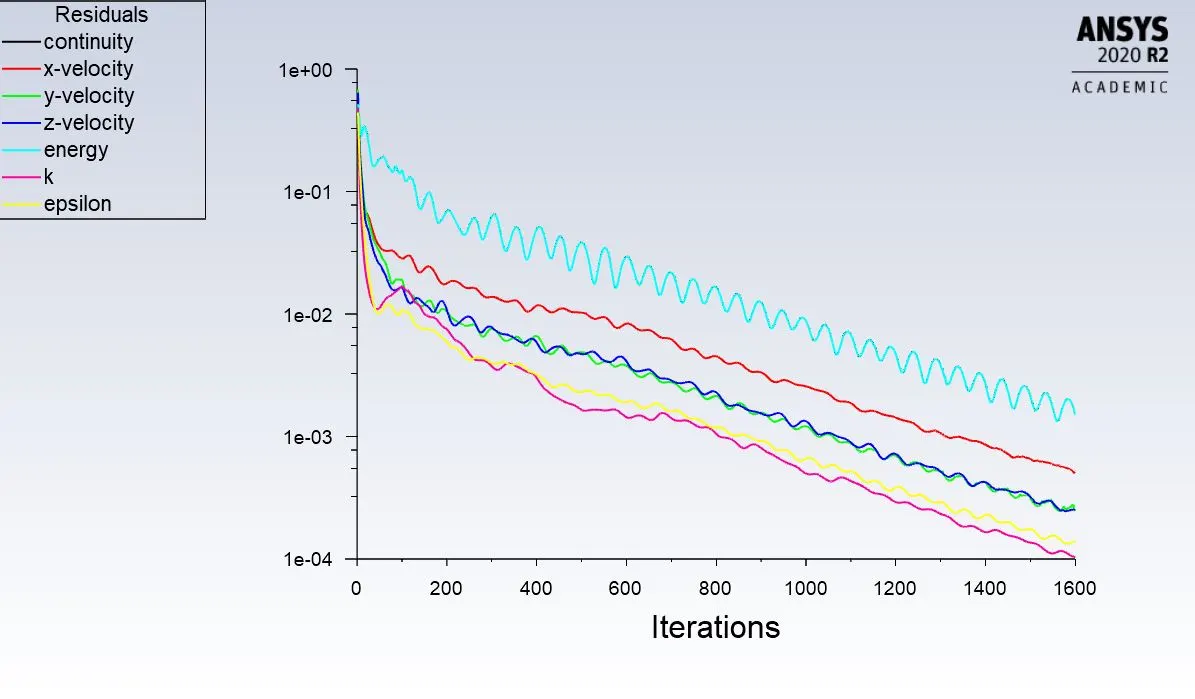
Residuals:
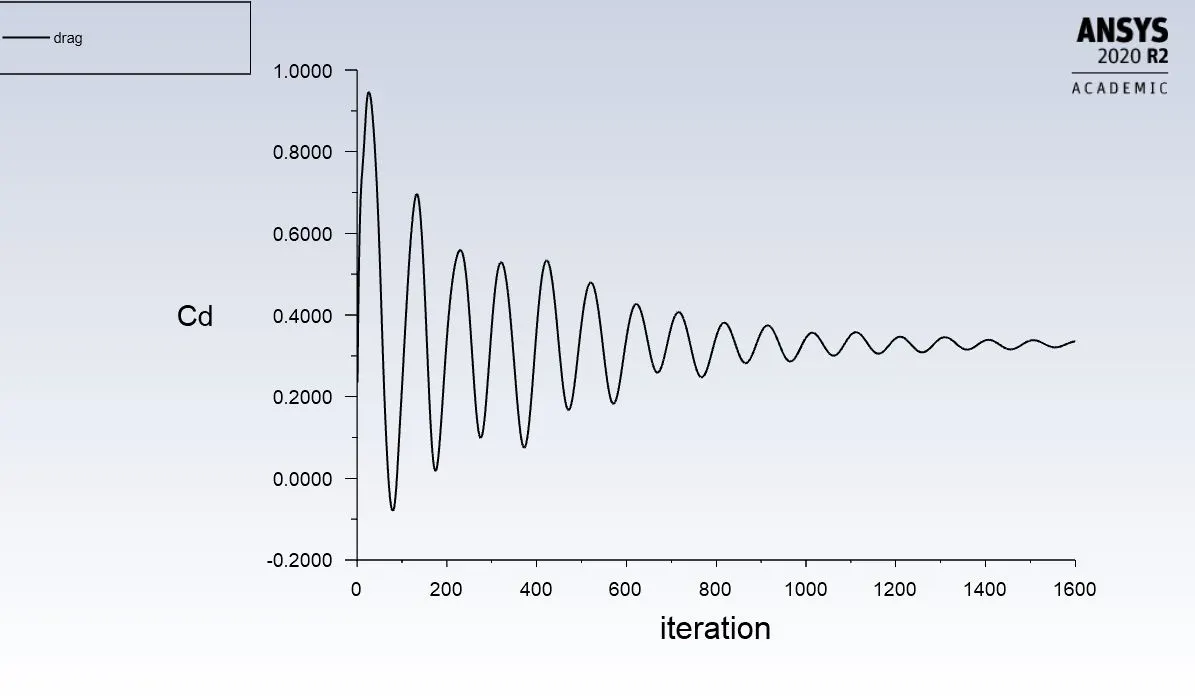
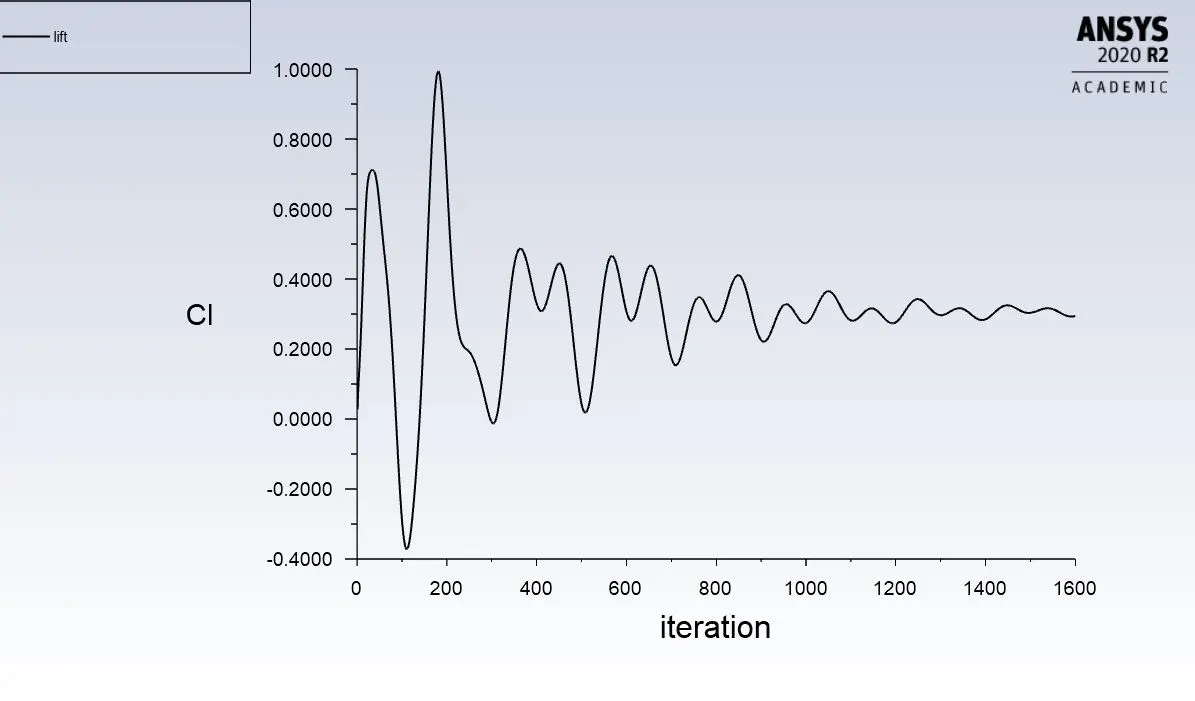
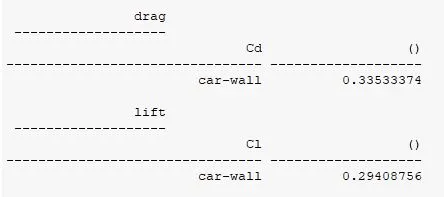
Drag and lift:
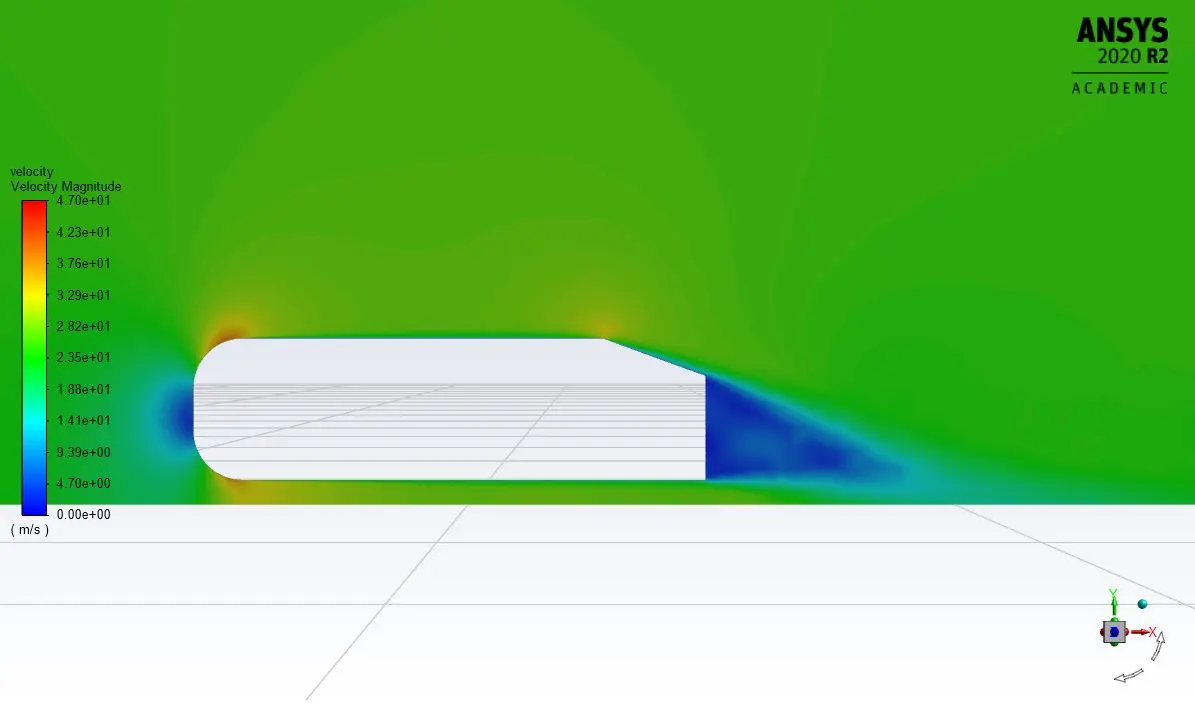
Velocity and pressure contours:
Post Processing:
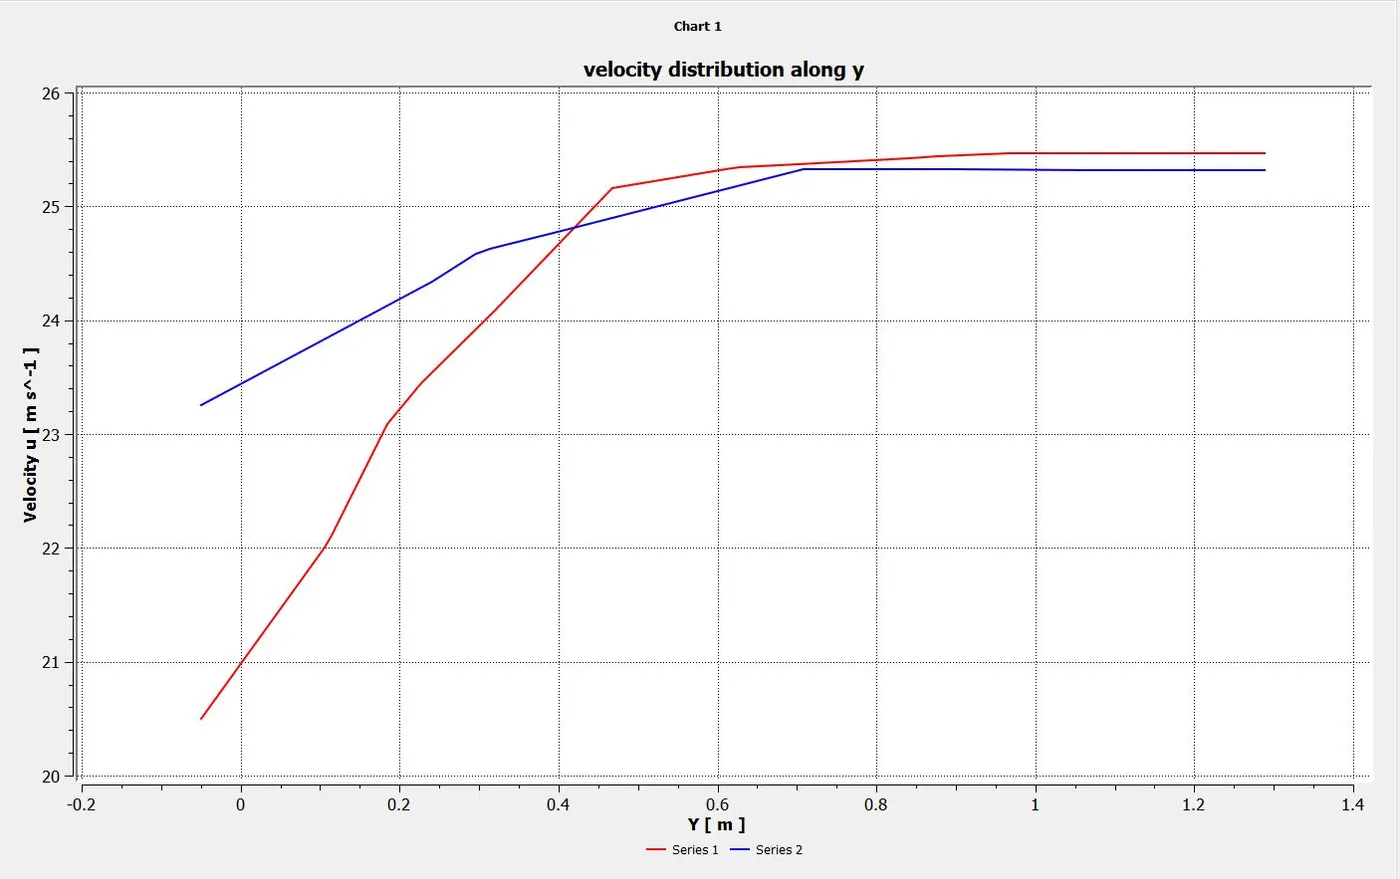
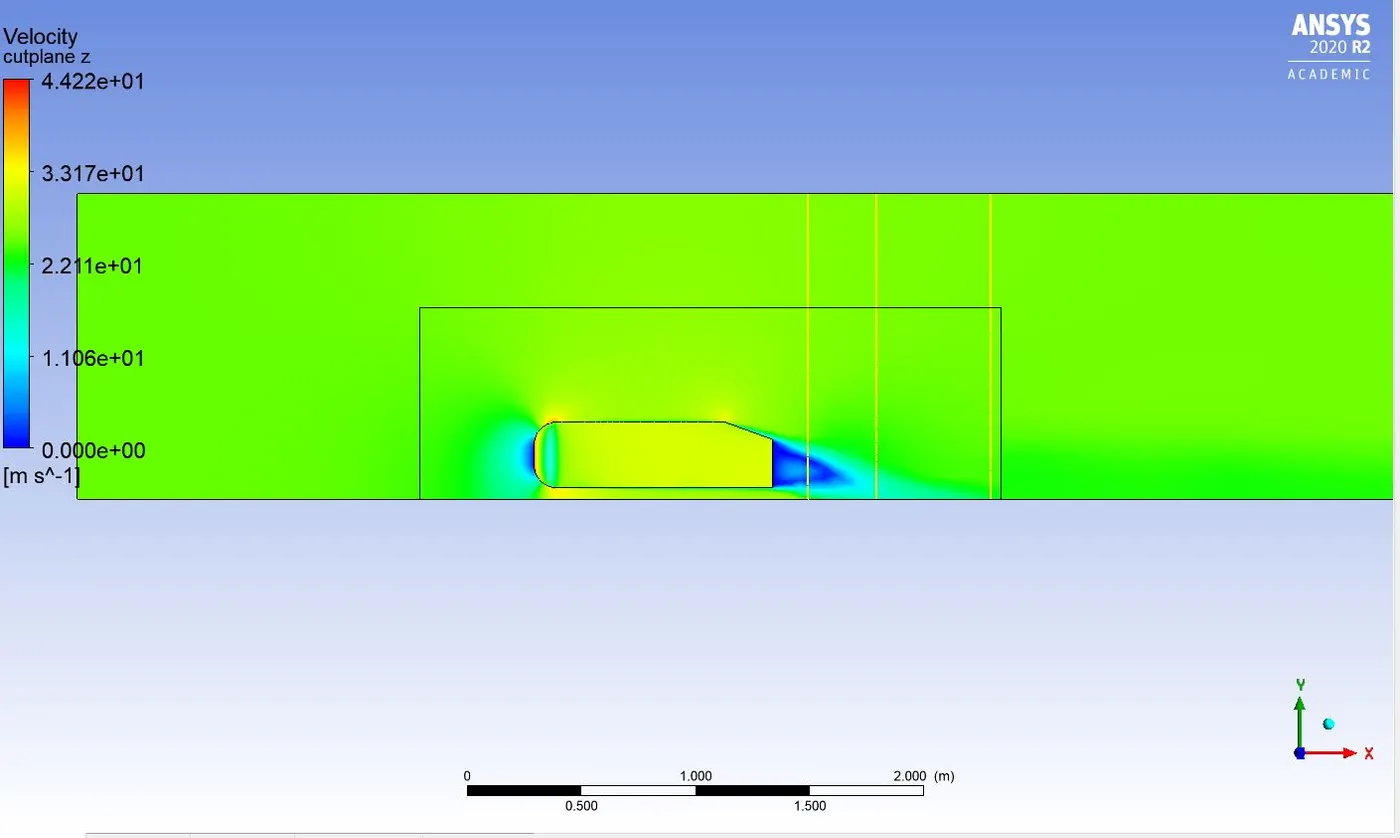
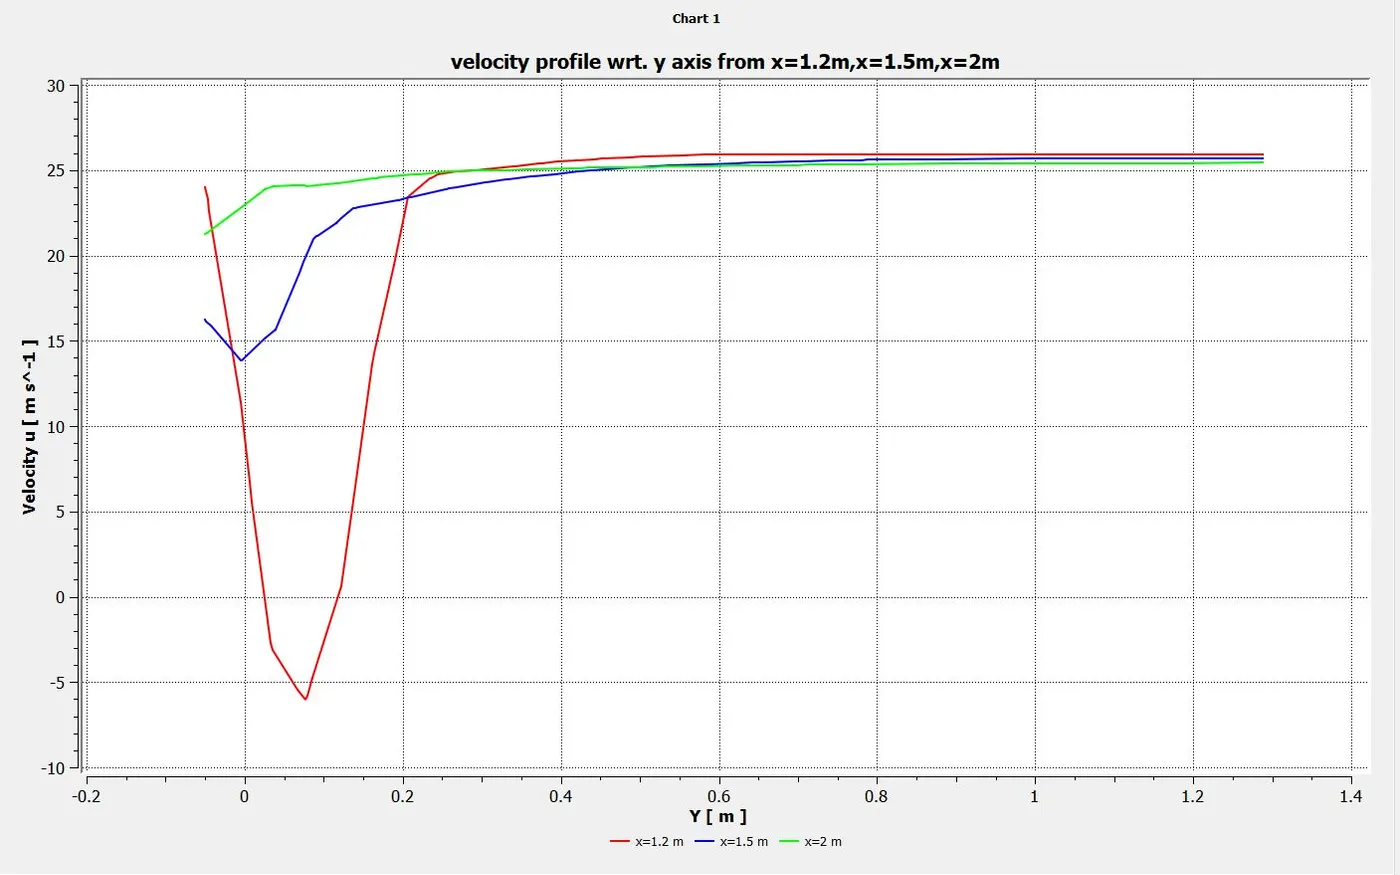
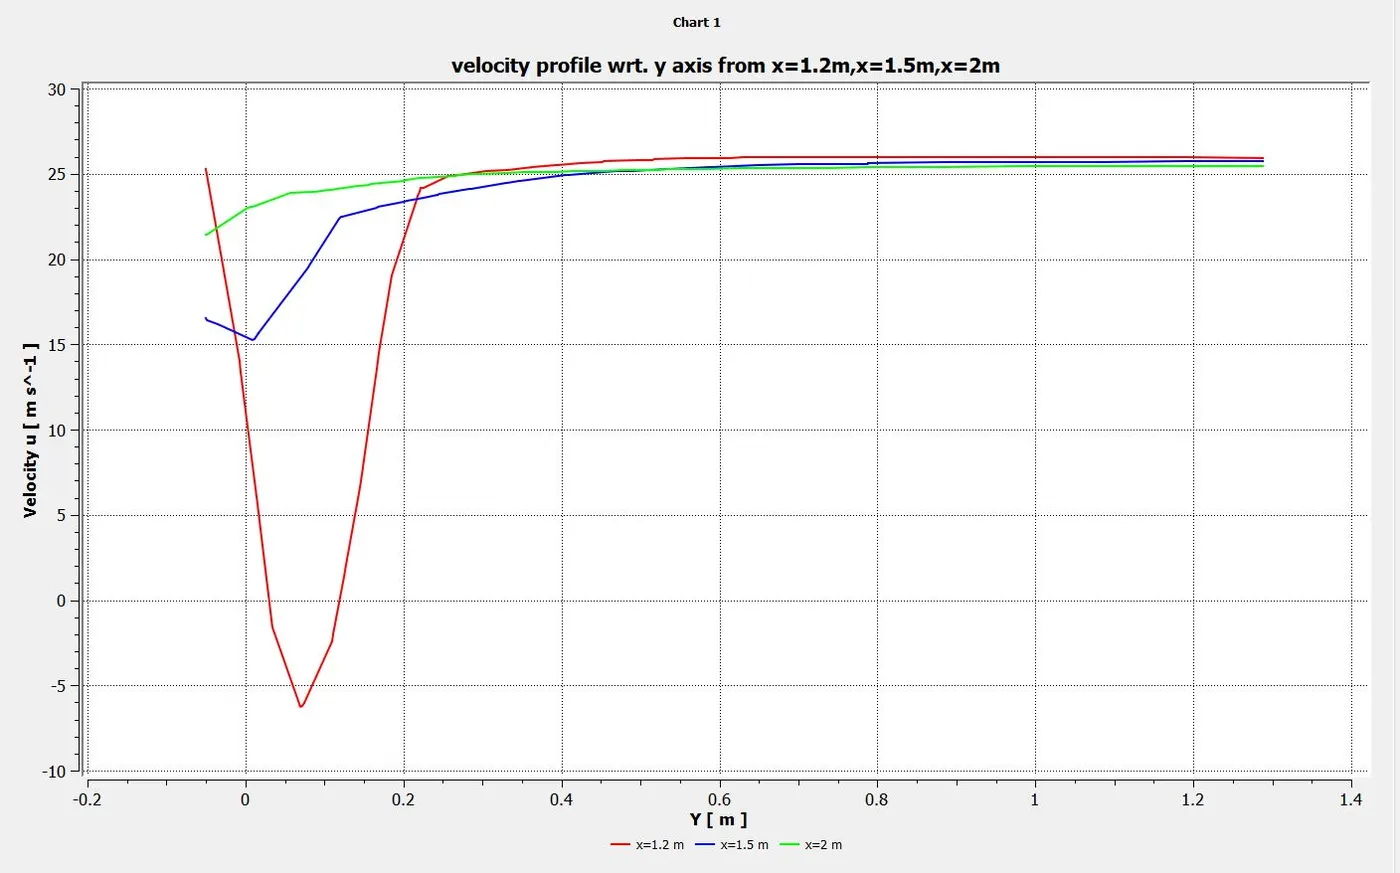
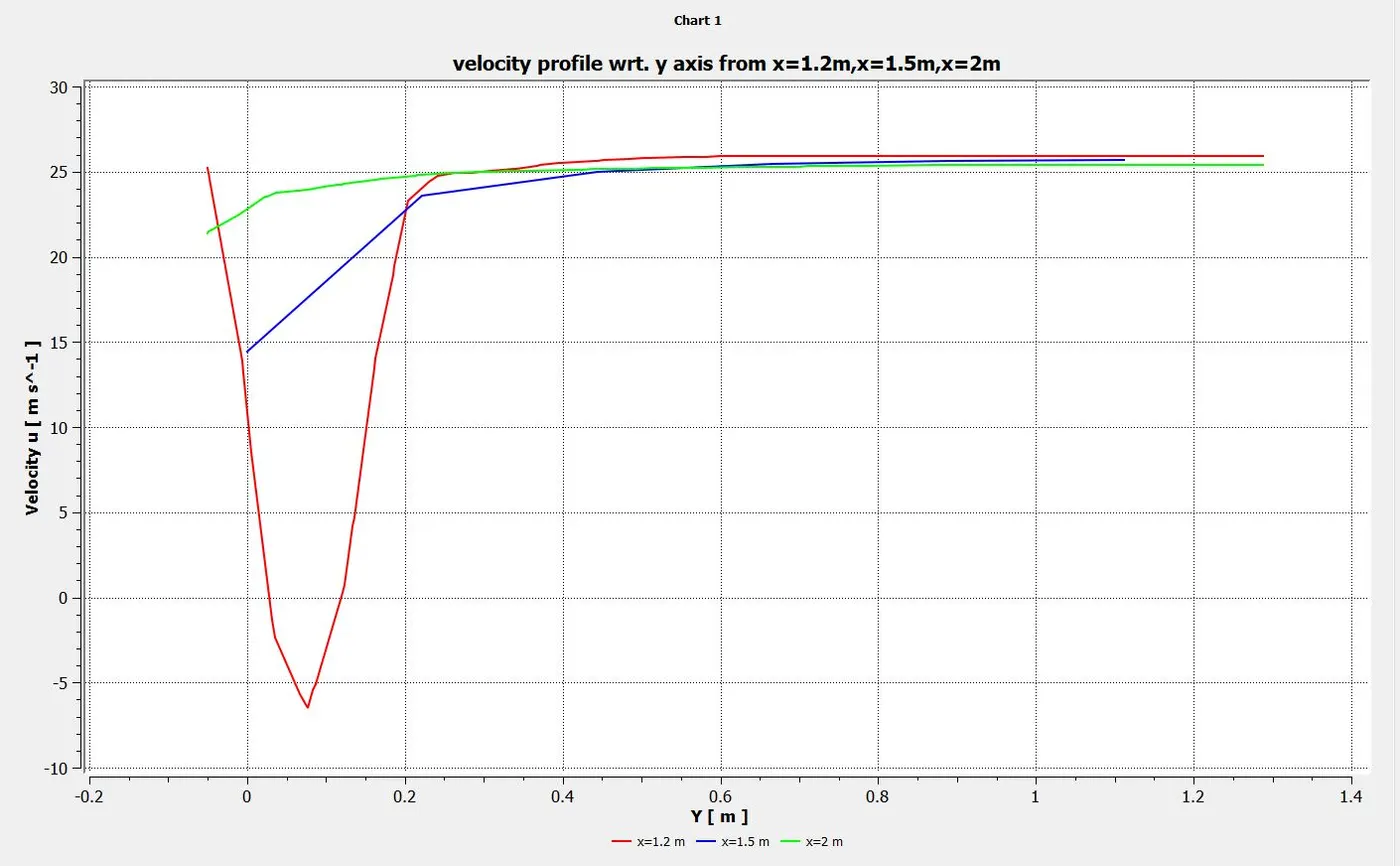
Velocity lines at x=1.2,2,3
velocity plot:
Velocity vector:
Inferences for refined case:
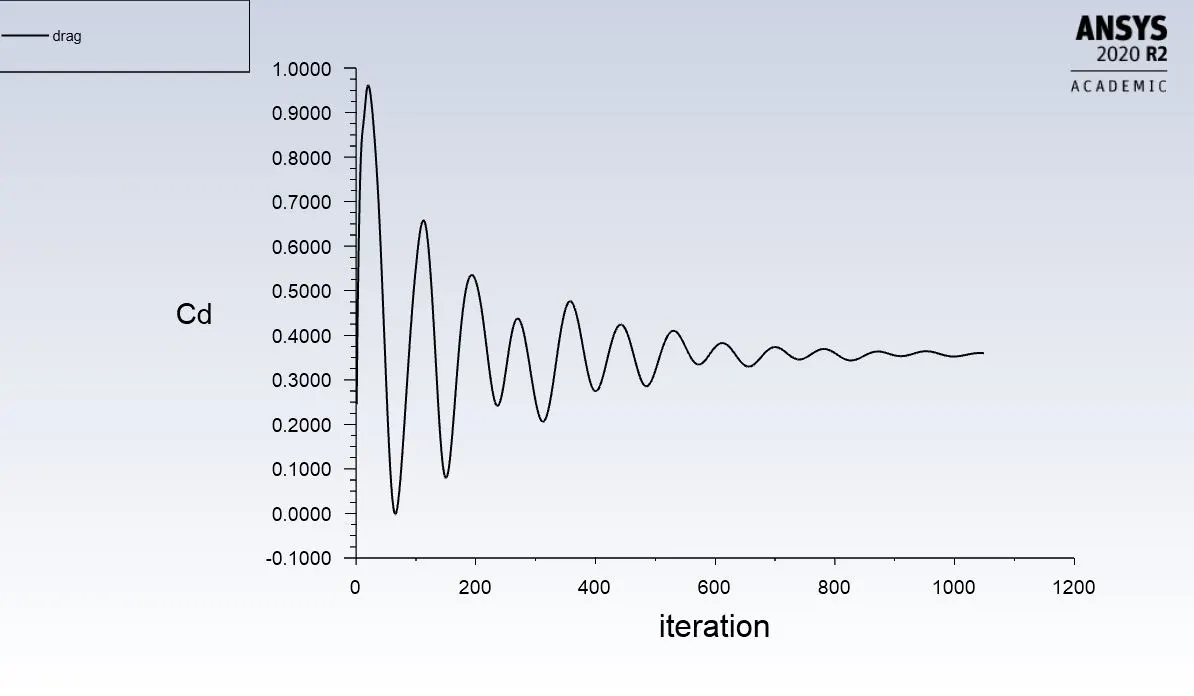
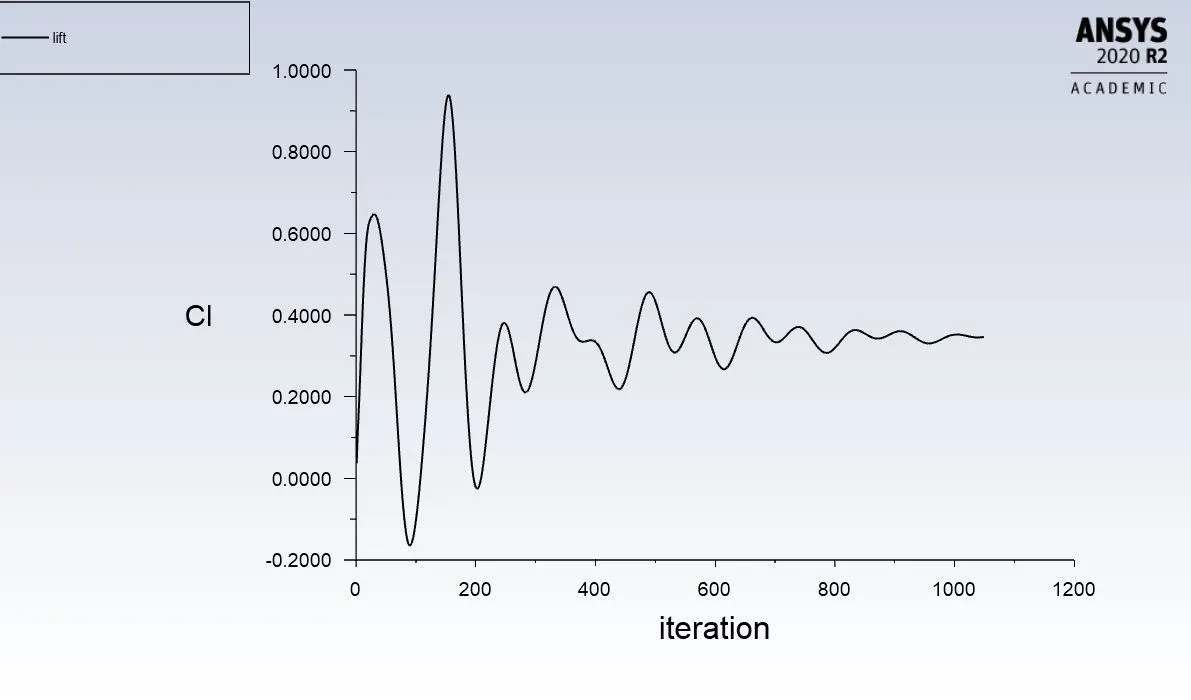
The coeffiecient of drag is 0.33 with 1600 iteration and we can see decent plots of velocity and and the physics capture is good enough with a y+=70 with first layer thickness as 1mm.
The mesh generated is a combination of different sizes with and refinement is key to the cfd approach in getting accurate results. we can see that there is a good amount of difference in values in reference to the baseline mesh generated with single enclosure.
-------------------------------------------------------------------Grid independency test----------------------------------------------------------------------------------------------------
In grid independency test three cases are setup with different grid sizes,body sizes and face sizes for inner and outer enclosure to monitor the results and residuals graphs.
Below are the three cases on which we simulate the Ahmed body for grid indendendency.

------------------------------------------------------------------Case 1:---------------------------------------------------------------------------------------------------------------

The geometry used is double enclosure model.
Mesh:
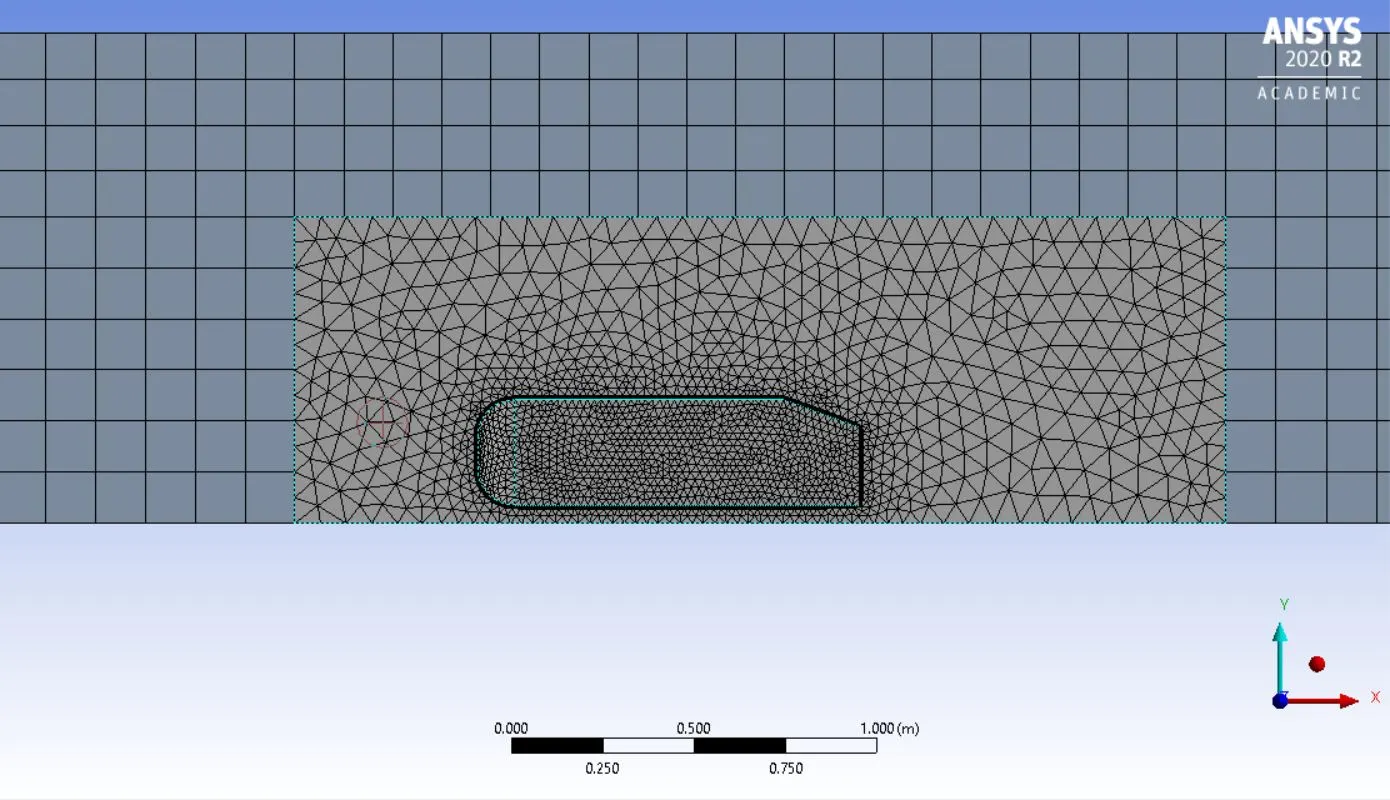
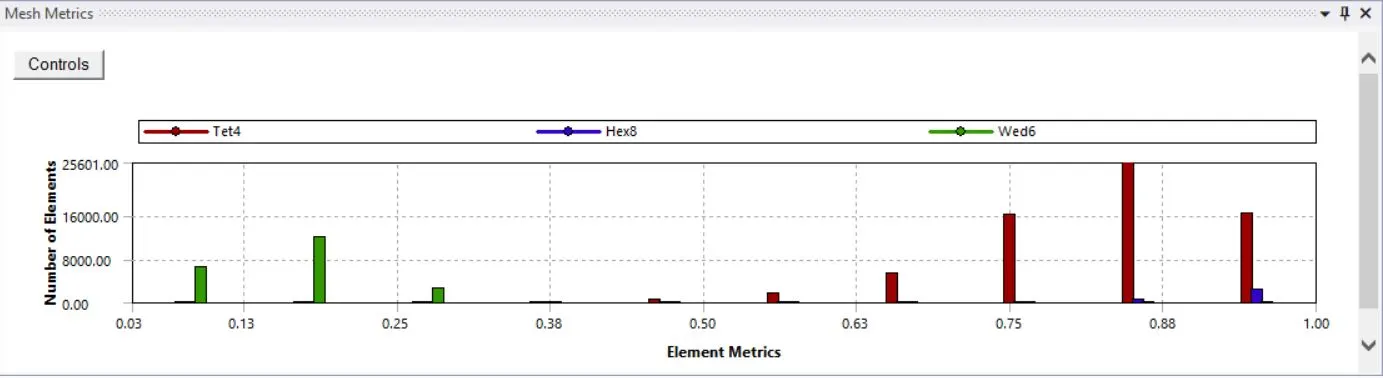
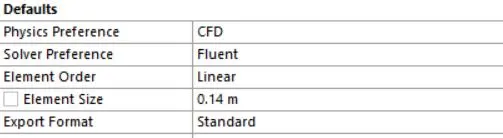
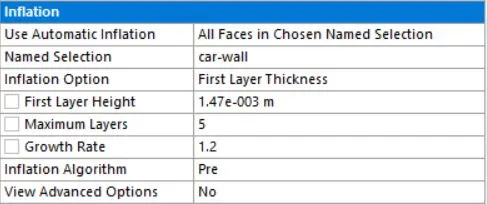

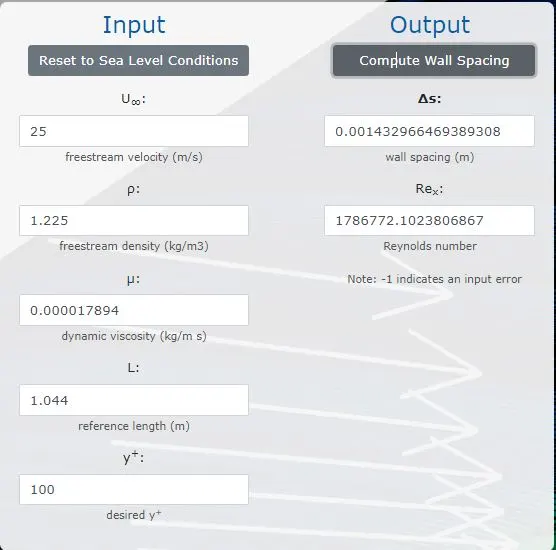
Y+ value: 100
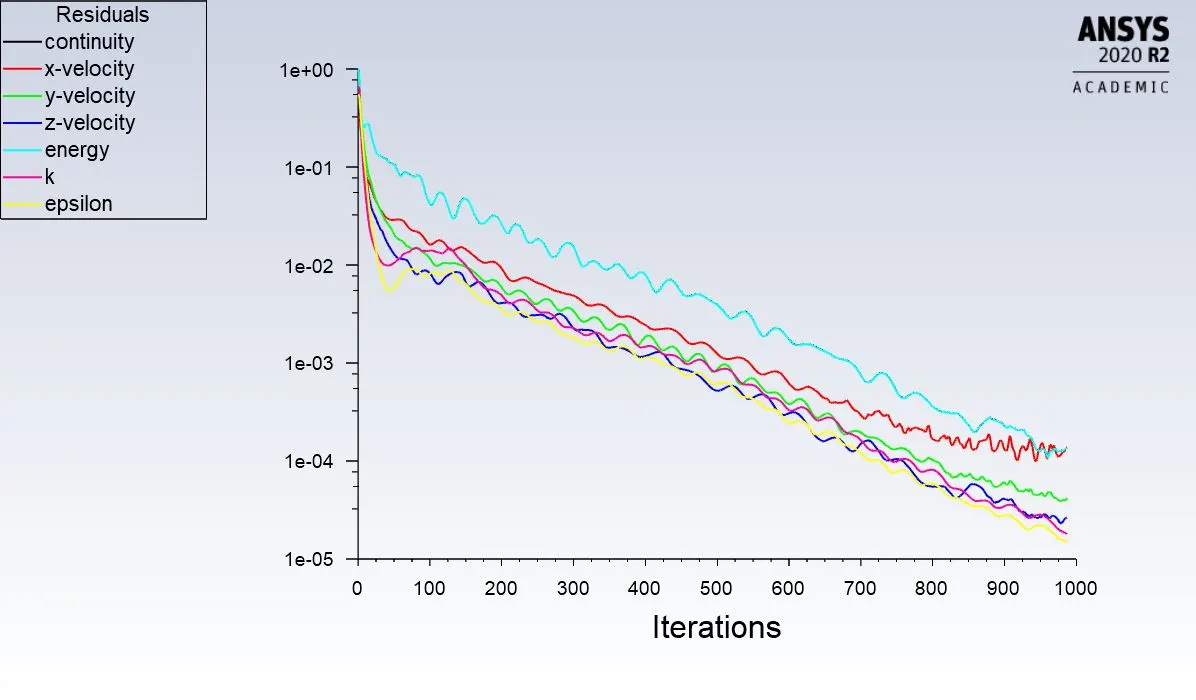
Pre-processing results:
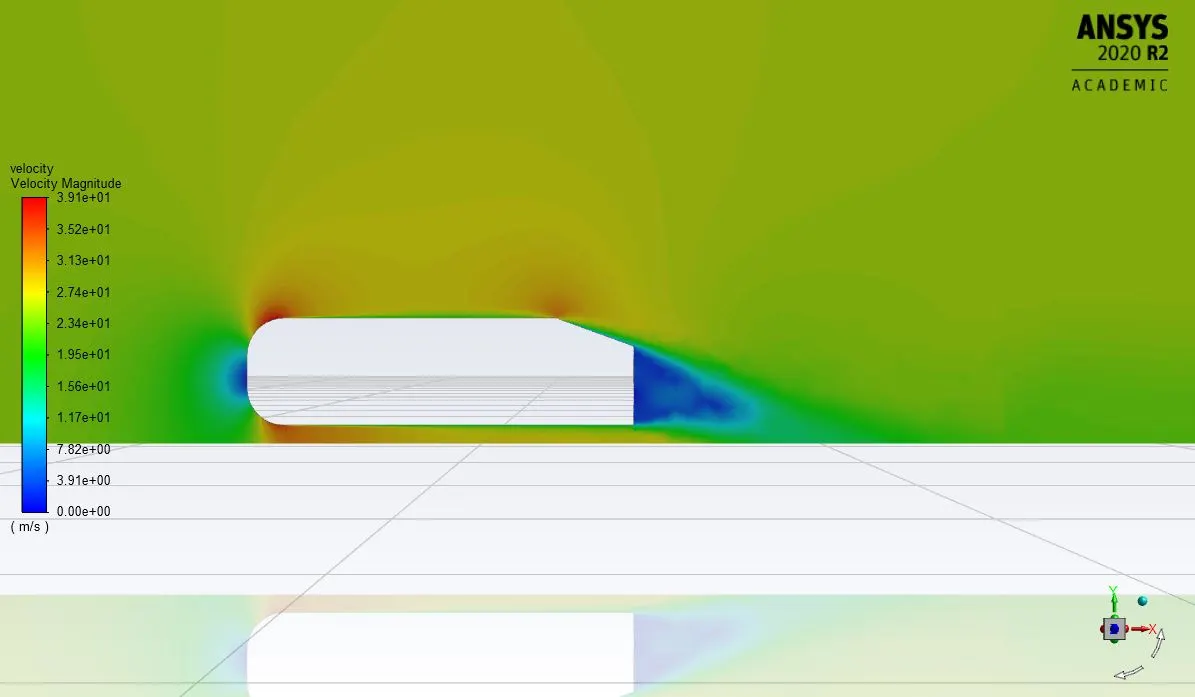
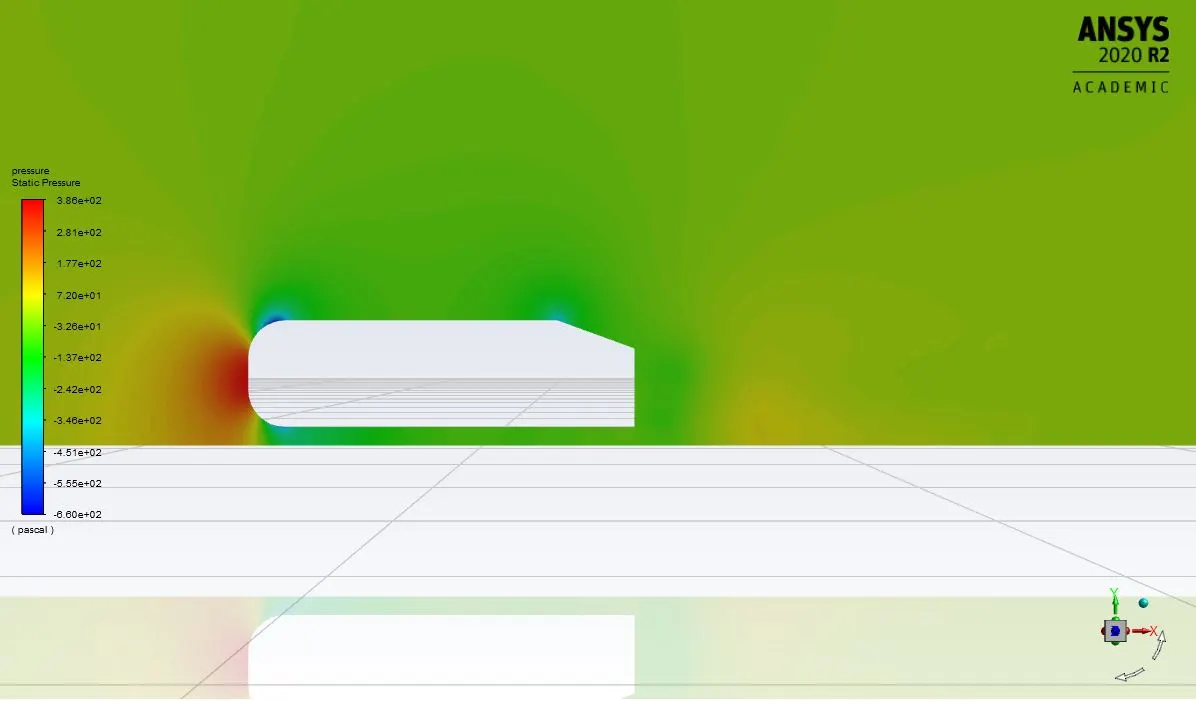
velocity and pressure contour:
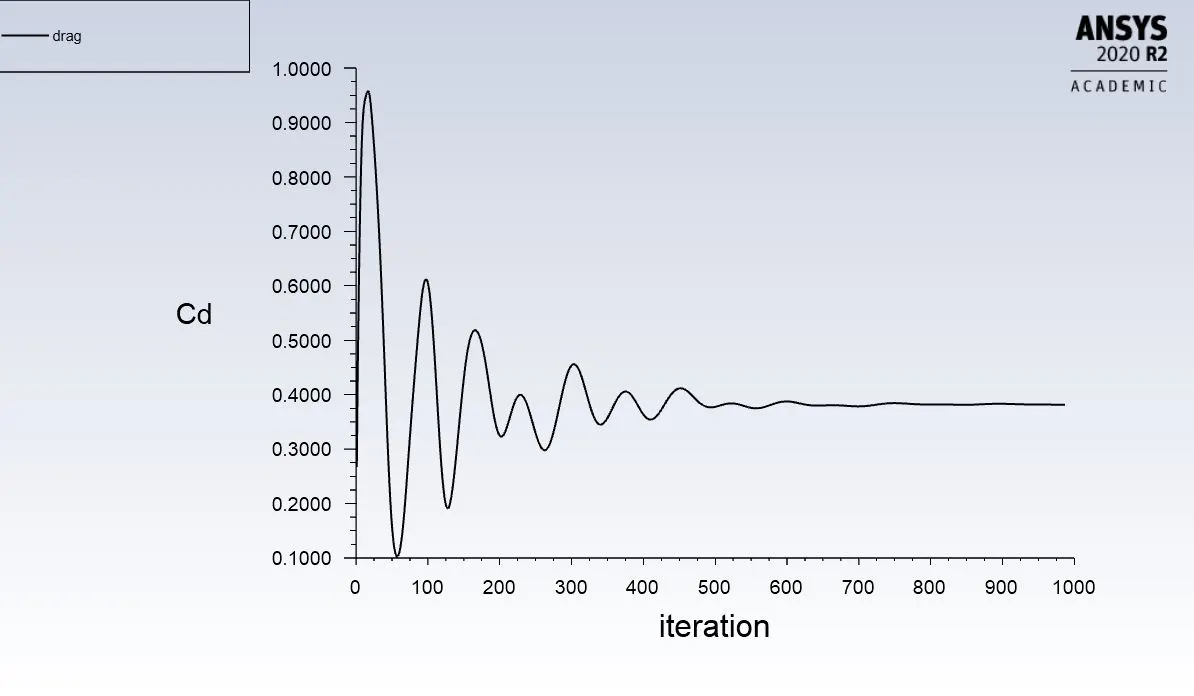
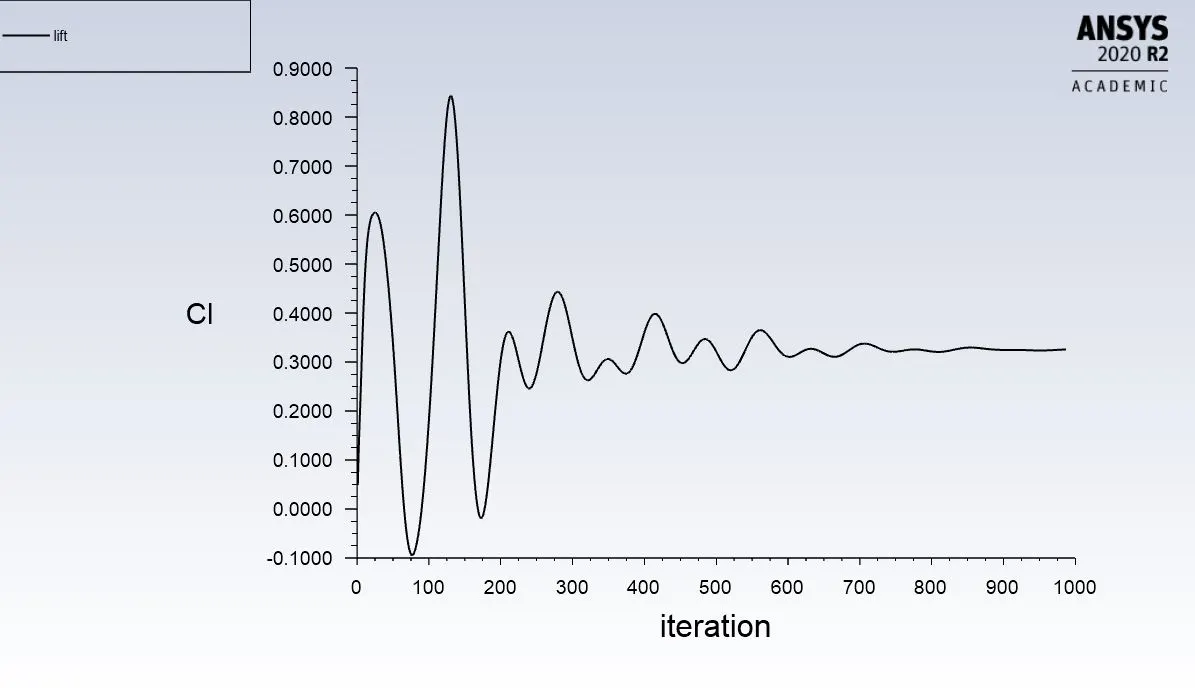
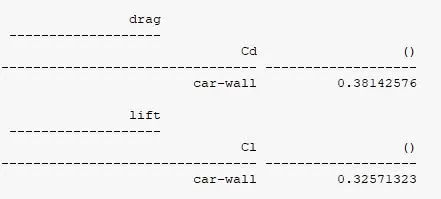
Drag and lift:
post processing:
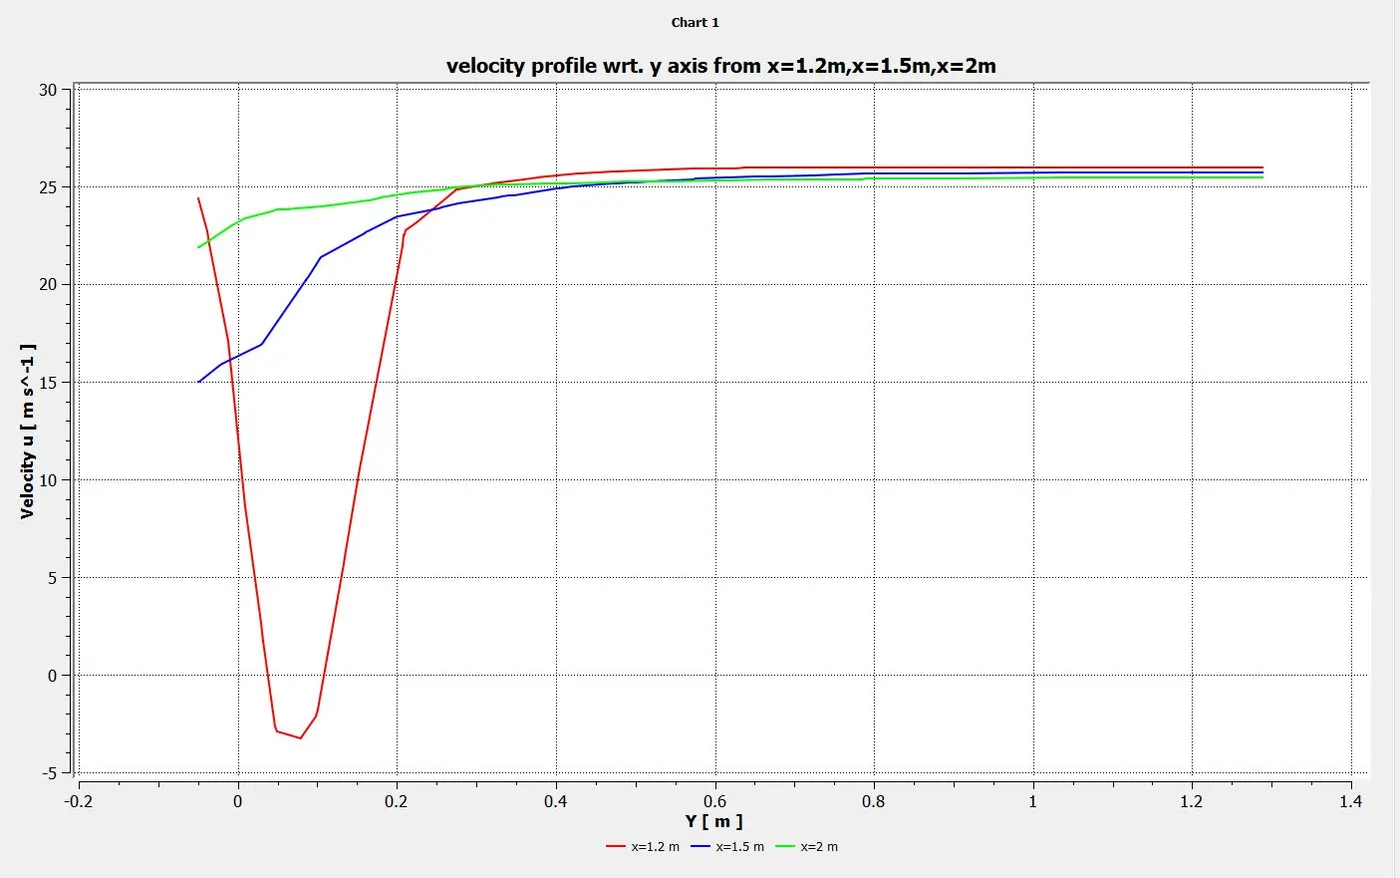
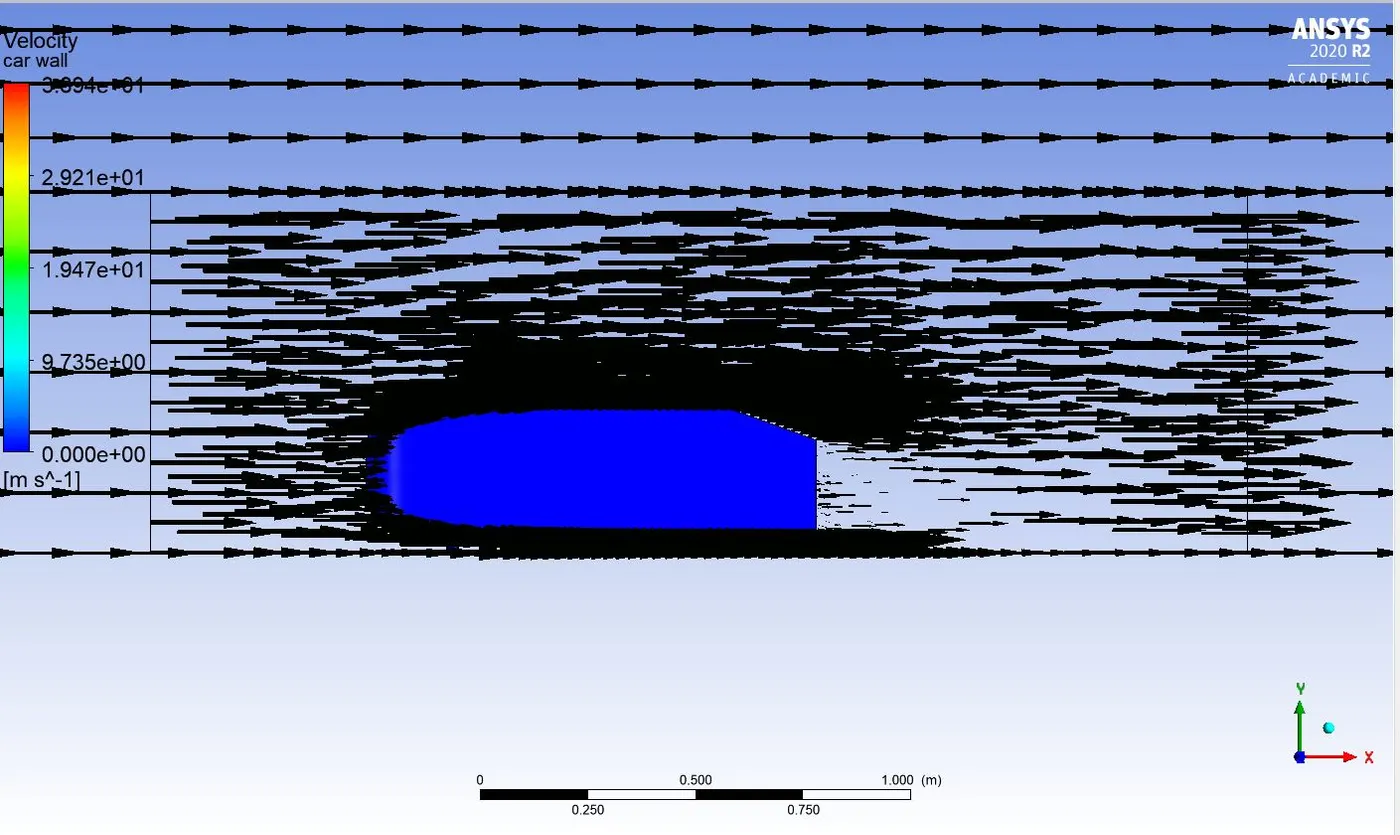
Velocity plot:
Velocity vector:
----------------------------------------------------------------------------Case 2:-------------------------------------------------------------------------------------------------------

The geometry used is double enclosure model.
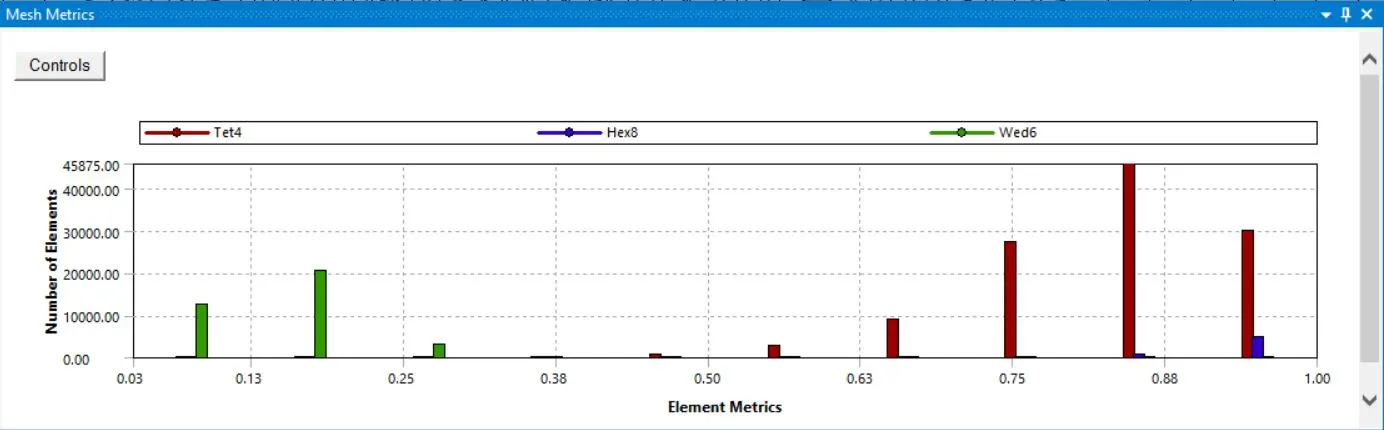
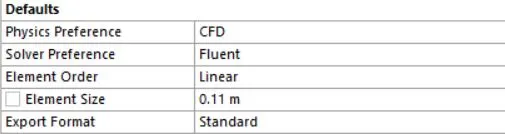
Mesh:
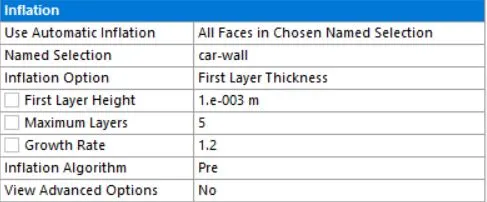

Y+ value: 70
Pre processing:
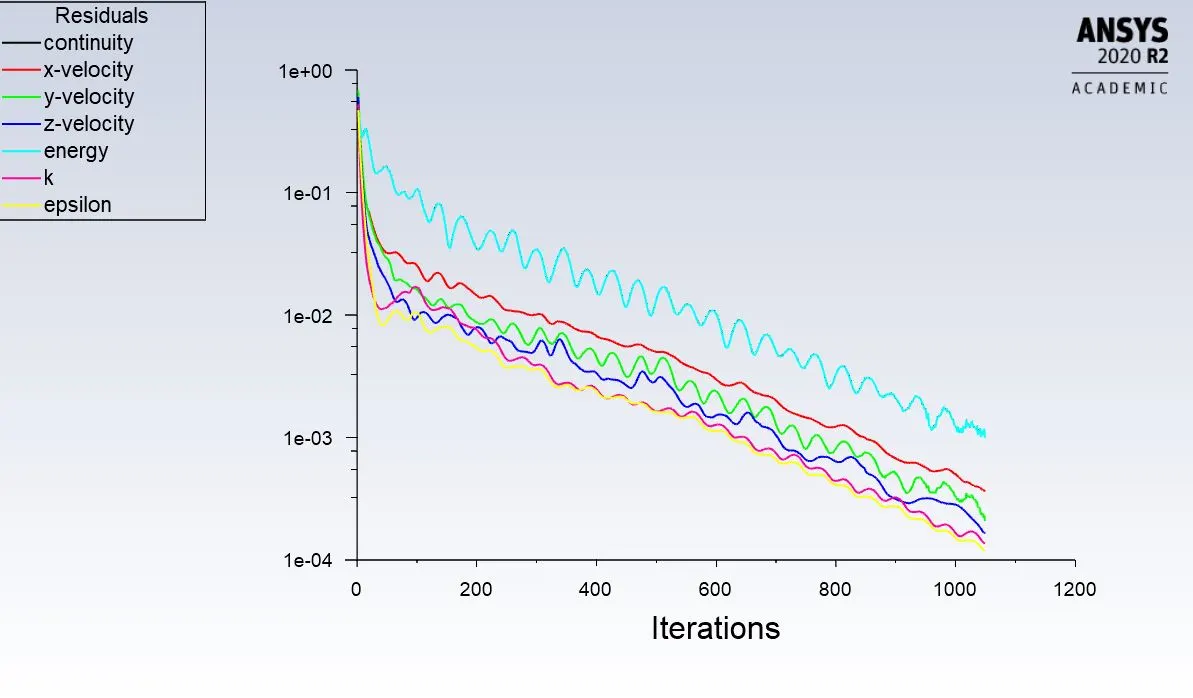
Residuals:
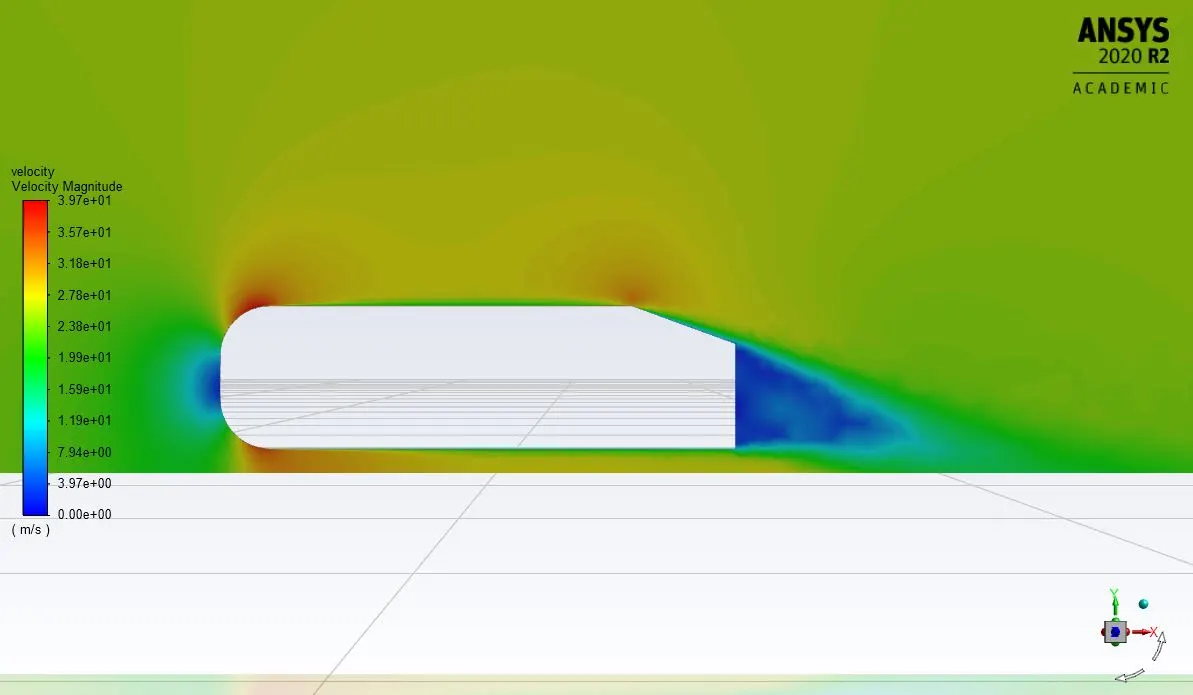
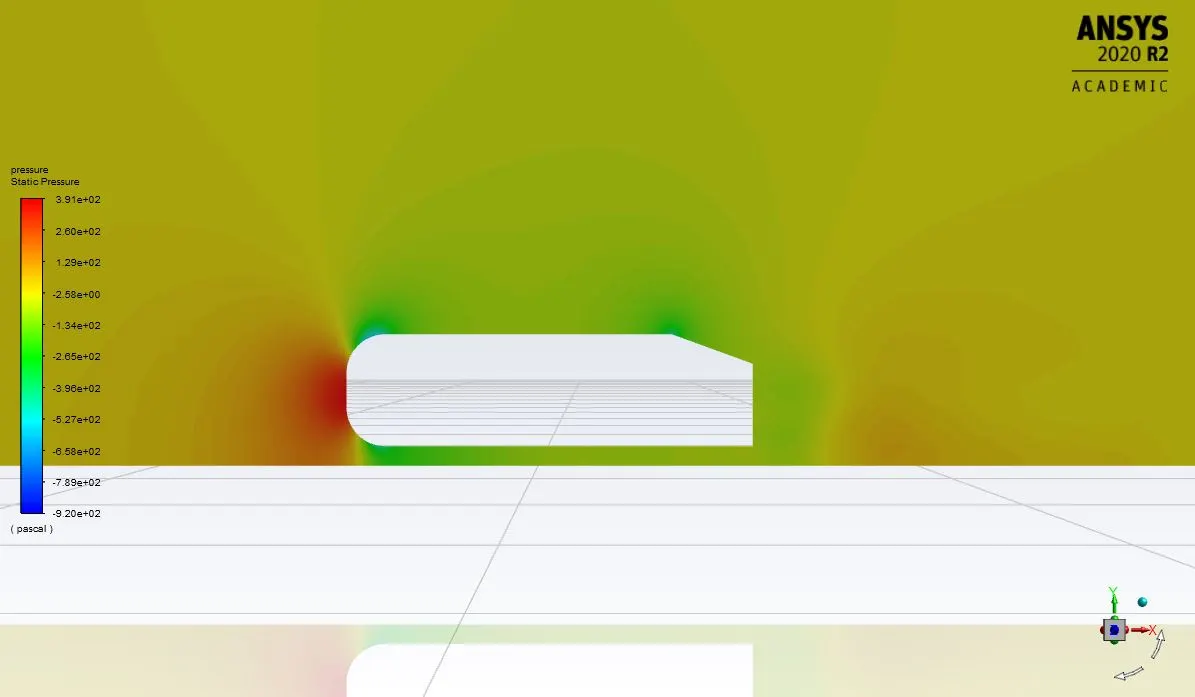
Velocity and pressure contour:
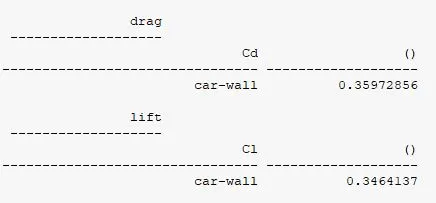
Drag and lift:
Post processing results:
velocity plot:
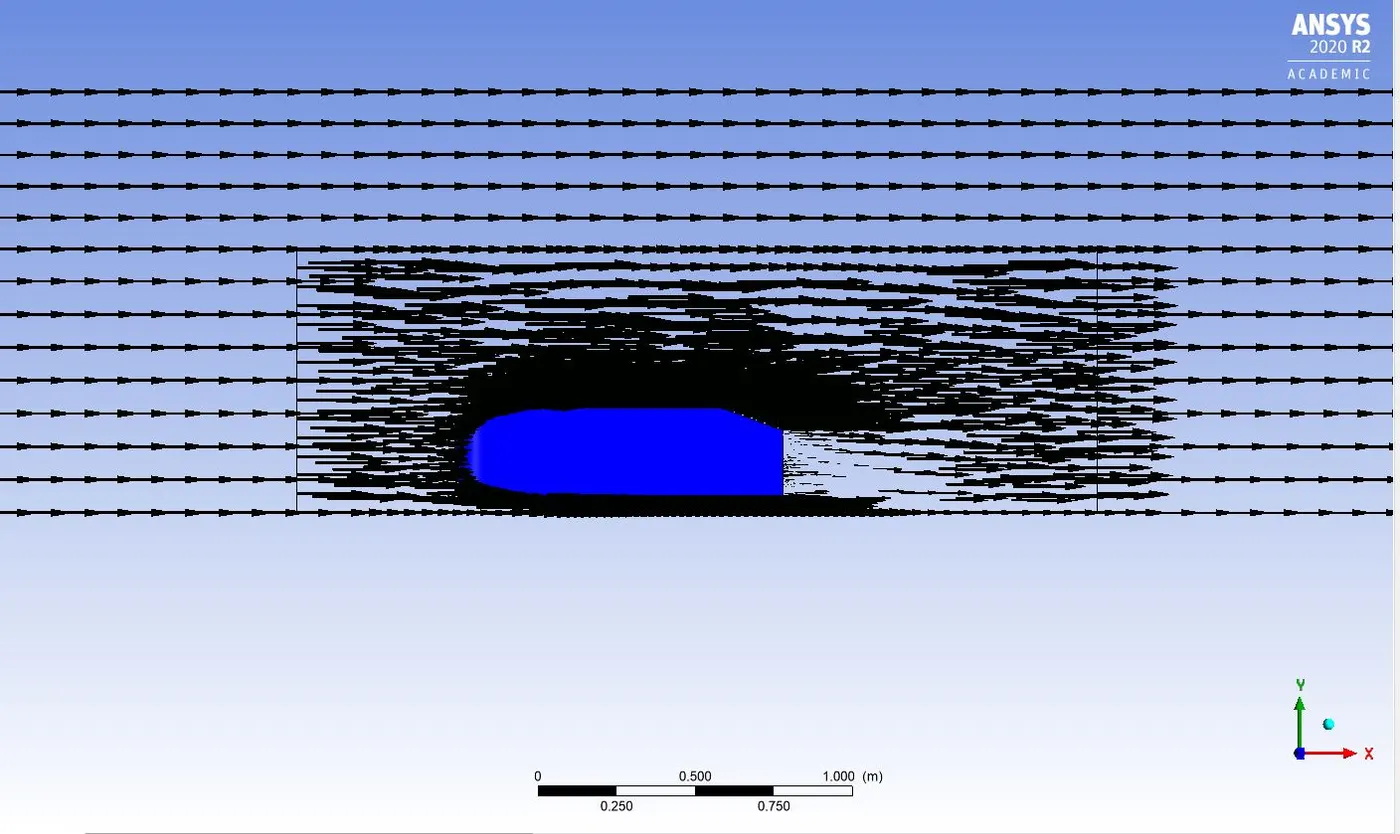
Velocity vector:
--------------------------------------------------------------------------Case 3--------------------------------------------------------------------------------------------------------

The geometry used is double enclosure model.
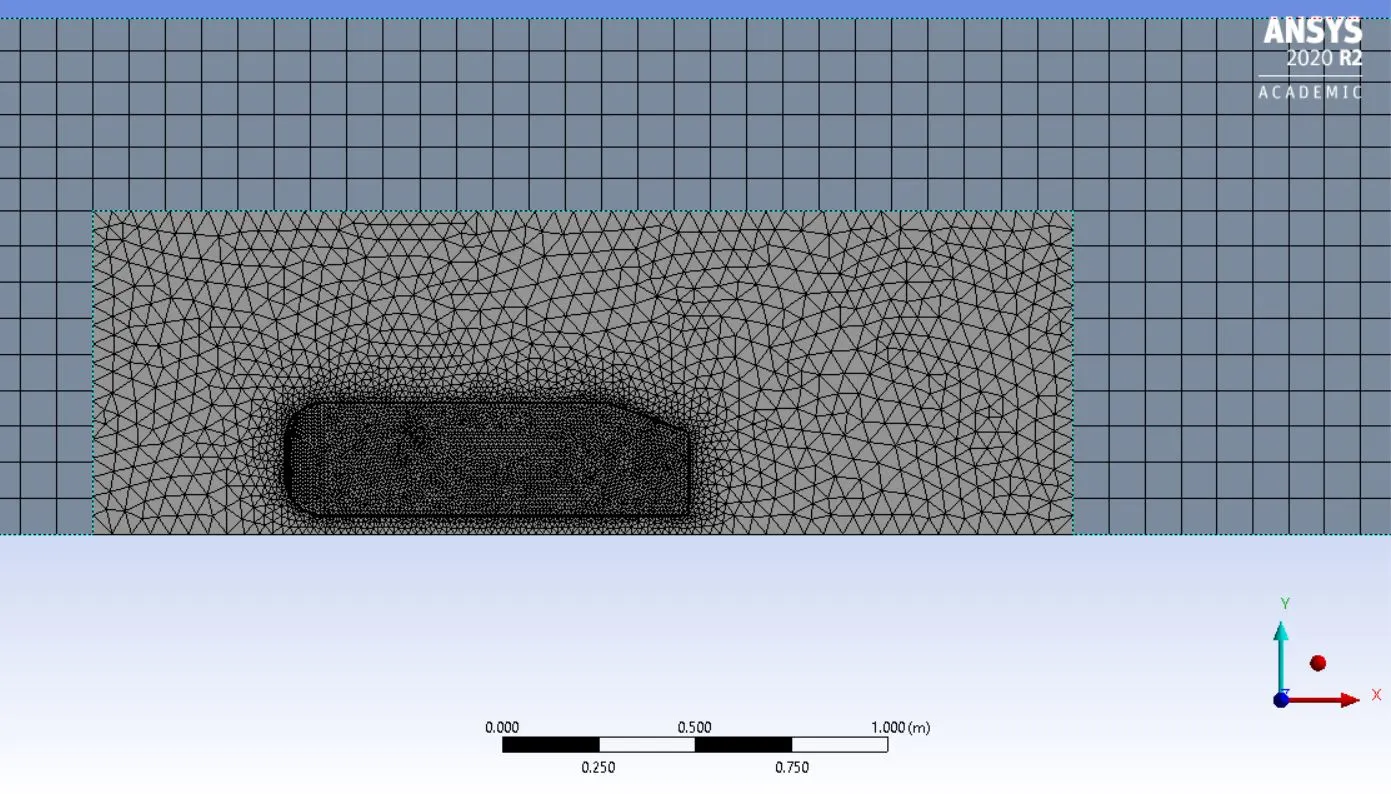
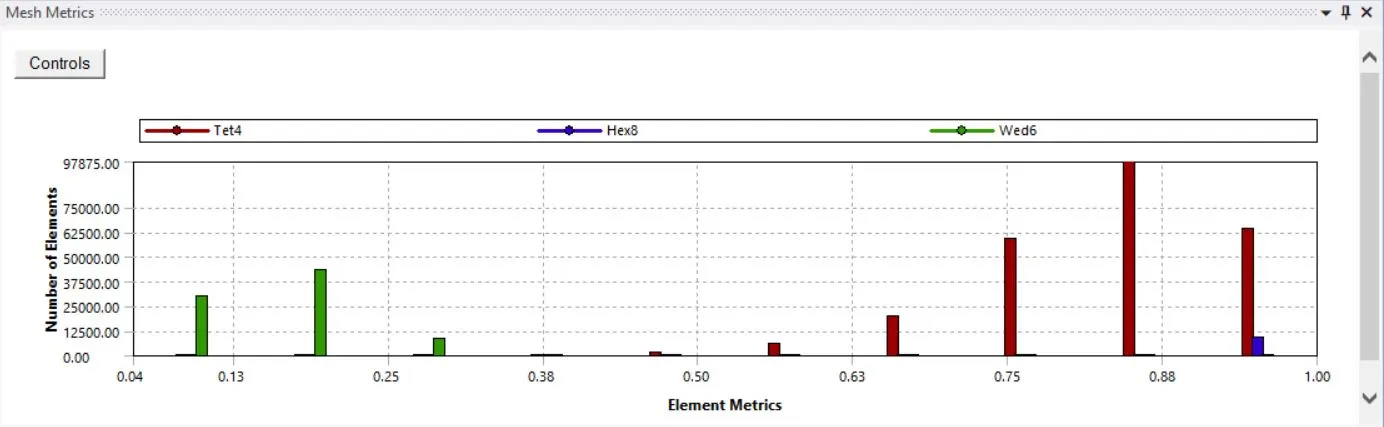
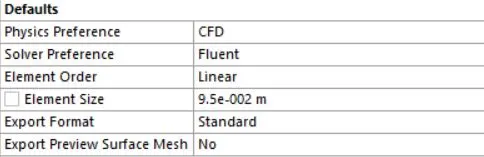
Mesh:
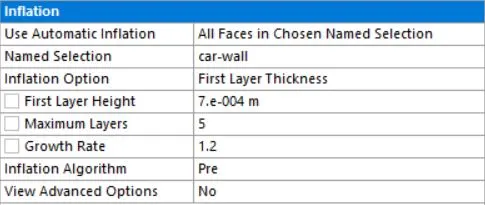

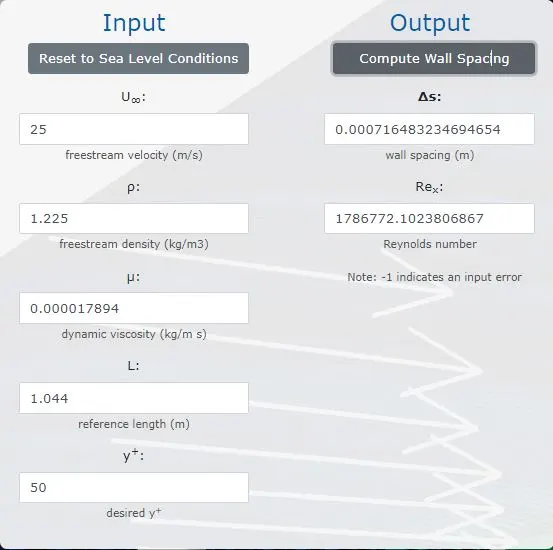
Y+ value 50:
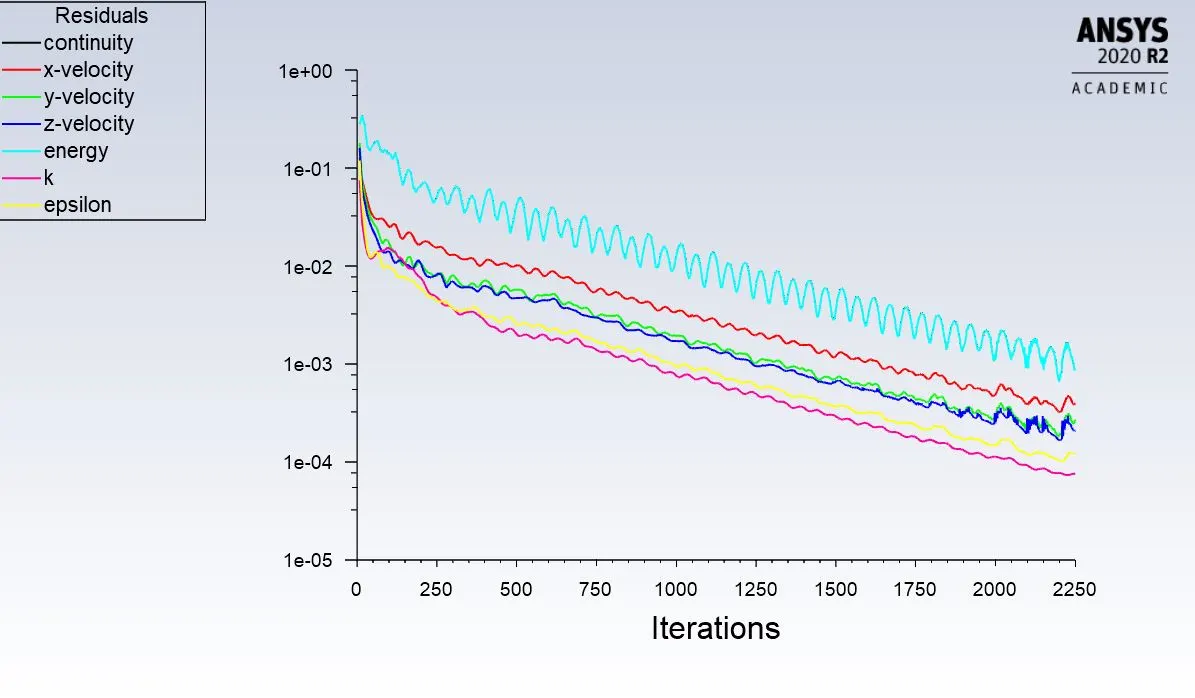
Pre processing results:
Residuals:
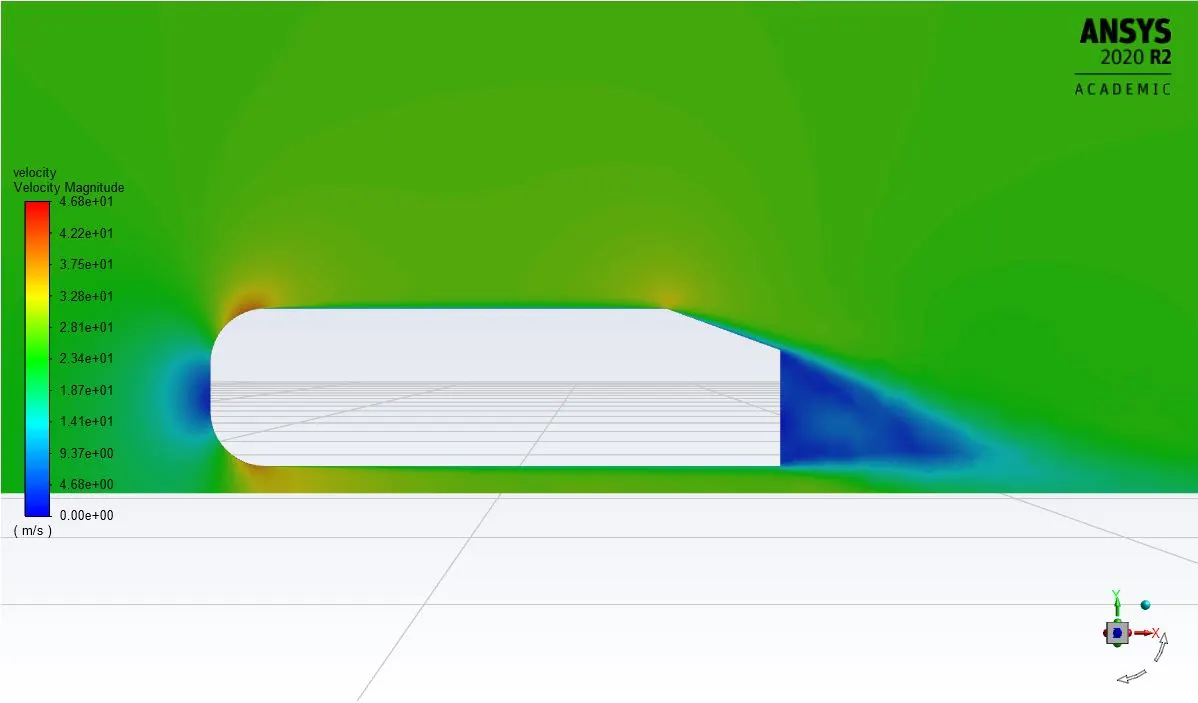
Velocity and pressure contour:
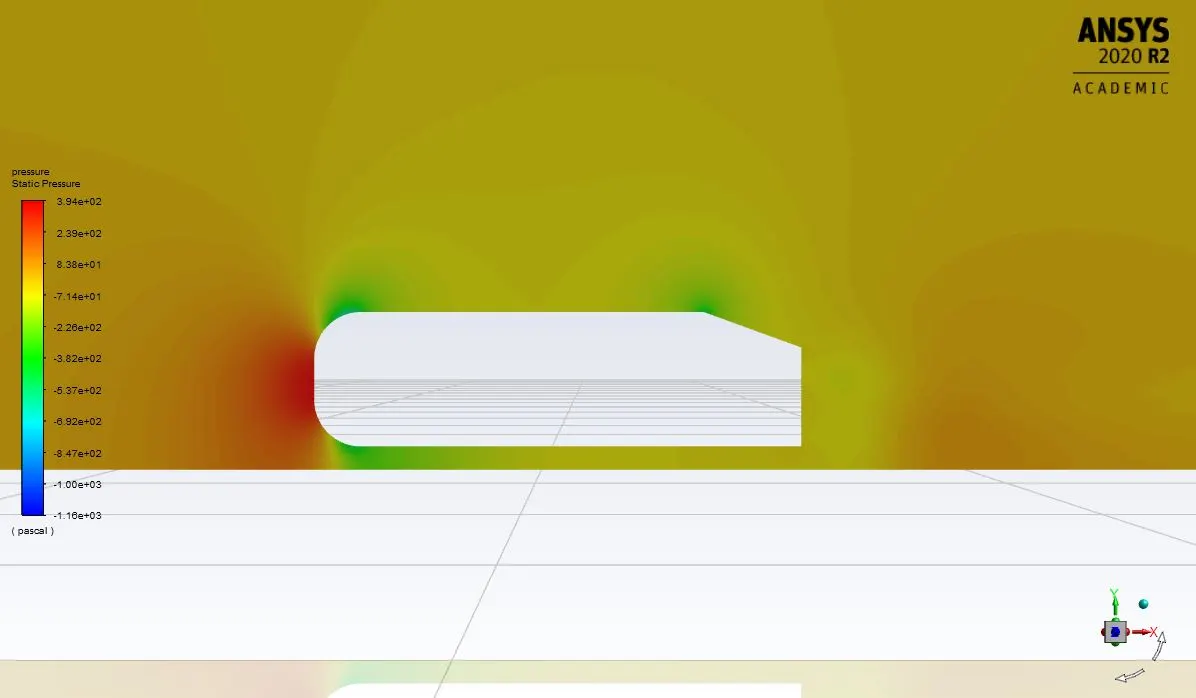
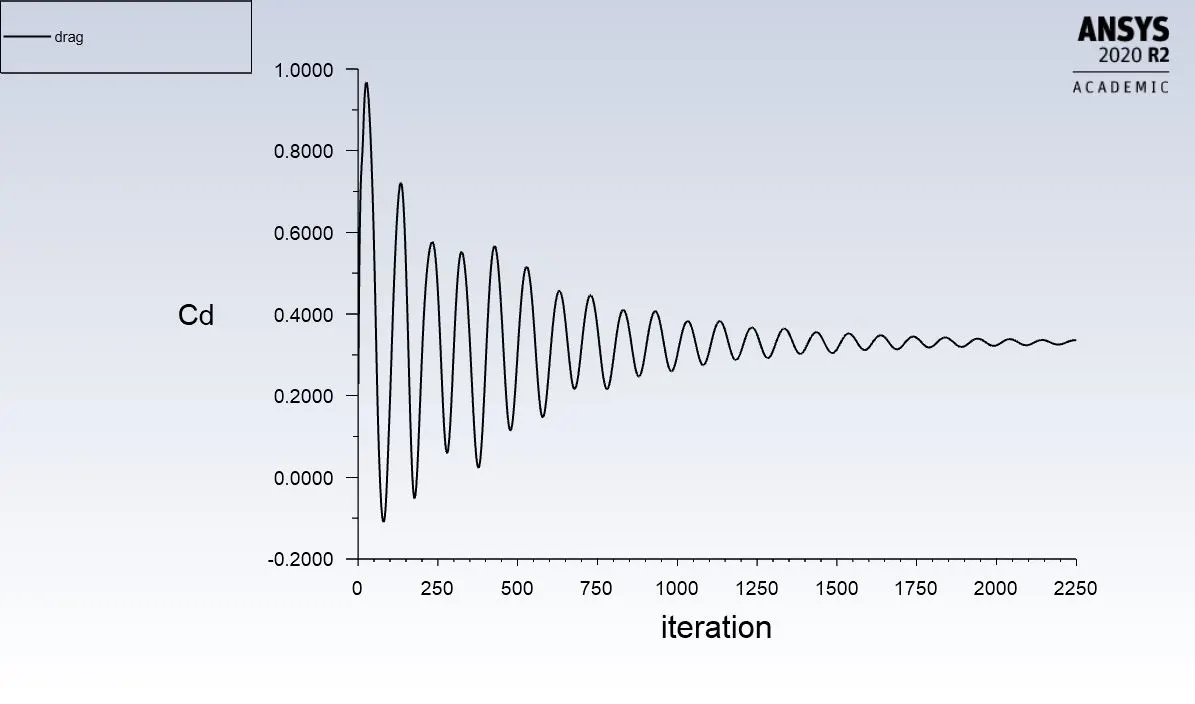
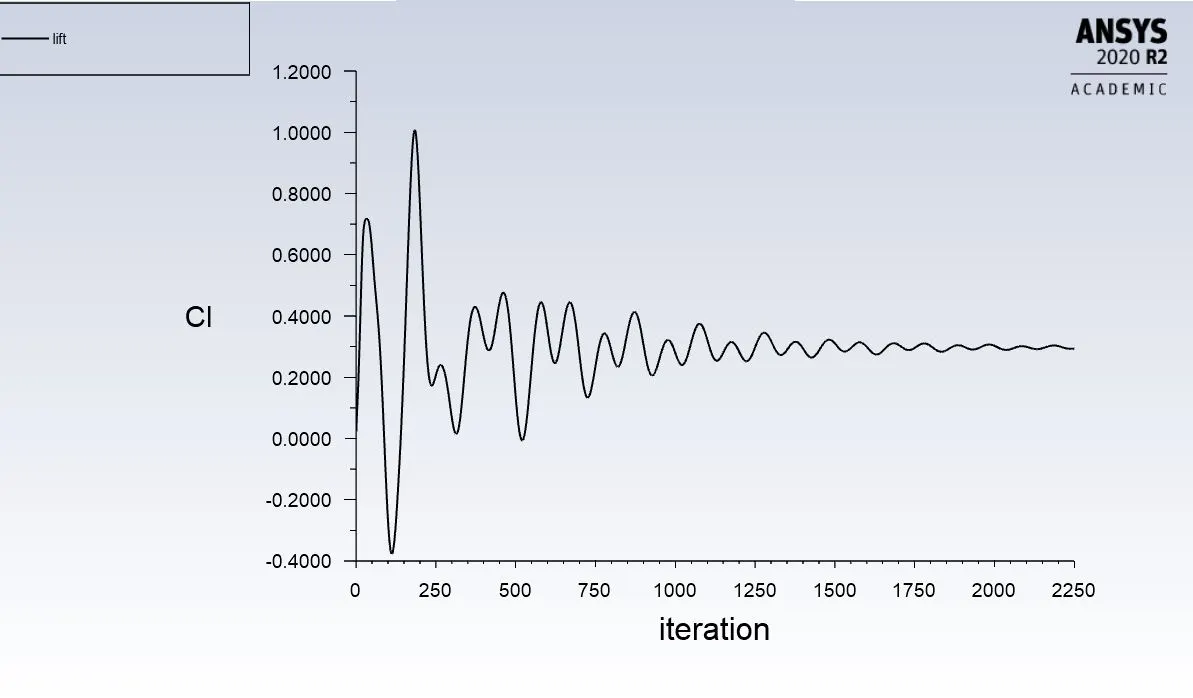
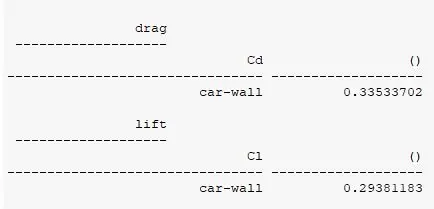
Drag and lift:
Post processing Results:
velocity plot:
Velocity Vector:
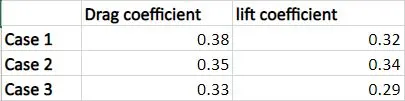
-----------------Results of grid independency test three cases with drag and lift values:
In ahmed body the results are very are very sensitive toward the size of mesh and inflation region with first layer thickness chosen wisely gives proper drag and lift value and better post processing results.

Conclusion and Inferences:
- The flow over the Ahmed body is vizualized.
- The value of y+ is an essential factor in building the physics over a wall.
- These y+ values are very essential in calculating drag and lift values.
- In post processing the flow separation , negative pressure in wake region is better visualized.
- In velocity contour the separation region is clearly seen.
- In the above cases we can see that as the mesh gets finer and the y+ values decreases the first layer thickness decreases then the drag coefficient gets more accurate to 0.33
- The body sizing , face sizing of legs and wall should be accurately chosen.
- The y+ values betweeen 30 to 200 can be used to calculate the coefficient of drag values as per the y+ graph by using k epsilon turbulent model with density based solver
- The major bridge is the model chosen k- epsilon is not a good choice to capture the phsyics around the car wall but due to computational limitations we chose this model or k-omega with lower y+values less than 30 can be used for better wall related applications.