Courses by Software
Courses by Semester
Courses by Domain
Tool-focused Courses
Machine learning
POPULAR COURSES
Success Stories
Week 5 - Rayleigh Taylor Instability
1. Some practical CFD models that have been based on the mathematical analysis of Rayleigh Taylor waves are:- Rayleigh-Taylor Instability: The Rayleigh–Taylor instability, or RT instability, is the instability of an interface between two fluids of different densities which occurs when the lighter fluid…
Athiyaman R
updated on 15 Jun 2021
1. Some practical CFD models that have been based on the mathematical analysis of Rayleigh Taylor waves are:-
Rayleigh-Taylor Instability:
The Rayleigh–Taylor instability, or RT instability, is the instability of an interface between two fluids of different densities which occurs when the lighter fluid is pushing the heavier fluid. Examples include the behaviour of water suspended above oil in the gravity of Earth, mushroom clouds like those from a volcanic eruption and atmospheric nuclear explosion, supernova explosions in which expanding core gas is accelerated into denser shell gas, instabilities in plasma fusion reactors and inertial confinement fusion.
Water suspended atop oil is an everyday example of Rayleigh–Taylor instability, and it may be modelled by two completely plane-parallel layers of immiscible fluid, the more dense on top of the less dense one and both subject to the Earth's gravity. The equilibrium here is unstable to any perturbations or disturbances of the interface: if a parcel of heavier fluid is displaced downward with an equal volume of lighter fluid displaced upwards, the potential energy of the configuration is lower than the initial state. Thus the disturbance will grow and lead to a further release of potential energy, as the more dense material moves down under the (effective) gravitational field, and the less dense material is further displaced upwards. This was the set-up as studied by Lord Rayleigh. The important insight by G. I. Taylor was his realisation that this situation is equivalent to the situation when the fluids are accelerated, with the less dense fluid accelerating into the more dense fluid. This occurs deep underwater on the surface of an expanding bubble and in a nuclear explosion.
Saffman-Taylor Instability:
The Saffman–Taylor instability, also known as viscous fingering, is the formation of patterns in a morphologically unstable interface between two fluids in a porous medium, described mathematically by Philip Saffman and G. I. Taylor in a paper of 1958. This situation is most often encountered during drainage processes through media such as soils. It occurs when a less viscous fluid is injected, displacing a more viscous fluid; in the inverse situation, with the more viscous displacing the other, the interface is stable and no instability is seen. Essentially the same effect occurs driven by gravity (without injection) if the interface is horizontal and separates two fluids of different densities, the heavier one being above the other: this is known as the Rayleigh-Taylor Instability. In the rectangular configuration, the system evolves until a single finger (the Saffman–Taylor finger) forms, whilst in the radial configuration, the pattern grows forming fingers by successive tip-splitting.
Richtmyer-Meshkov Instability:
The Richtmyer–Meshkov instability (RMI) occurs when two fluids of different density are impulsively accelerated. Normally this is by the passage of a shock wave. The development of the instability begins with small amplitude perturbations which initially grow linearly with time. This is followed by a nonlinear regime with bubbles appearing in the case of a light fluid penetrating a heavy fluid, and with spikes appearing in the case of a heavy fluid penetrating a light fluid. A chaotic regime eventually is reached and the two fluids mix. This instability can be considered the impulsive-acceleration limit of the Rayleigh-Taylor Instability.
Kelvin-Helmholtz Instability:
The Kelvin–Helmholtz instability typically occurs when there is velocity shear in a single continuous fluid, or additionally where there is a velocity difference across the interface between two fluids. A common example is seen when the wind blows across a water surface; the instability constant manifests as waves. Kelvin-Helmholtz instabilities are also visible in the atmospheres of planets and moons, such as in cloud formation on Earth or the Red spot on Jupiter, and the atmospheres (coronas) of stars, including the sun's.
Mushroom Cloud:
A mushroom cloud is a distinctive mushroom-shaped flammagenitus cloud of debris, smoke and usually condensed water vapour resulting from a large explosion. The effect is most commonly associated with a nuclear explosion but any sufficiently energetic detonation or deflagration will produce the same effect. They can be caused by powerful conventional weapons, like thermobaric weapons, including the ATBIP and GBU-43/B Massive Ordnance Air Blast Some Volcanic eruptions and impact events can produce natural mushroom clouds.
Mushroom clouds result from the sudden formation of a large volume of lower-density gases at any altitude, causing a Rayleigh-Taylor instability. The buoyant mass of gas rises rapidly, resulting in turbulence vortices curling downward around its edges, forming a temporary vortex ring that draws up a central column, possibly with smoke, debris, and/or condensed water vapour to form the "mushroom stem". The mass of gas plus entrained moist air eventually reaches an altitude where it is no longer of lower density than the surrounding air; at this point, it disperses, drifting back down. The stabilization altitude depends strongly on the profiles of the temperature, dew point, and wind shear in the air at and above the starting altitude.
Plateau-Rayleigh Instability:
The Plateau–Rayleigh instability, often just called the Rayleigh instability, explains why and how a falling stream of fluid breaks up into smaller packets with the same volume but less surface area. It is related to the Rayleigh-Taylor Instability and is part of a greater branch of fluid dynamics concerned with fluid thread breakup. This fluid instability is exploited in the design of a particular type of ink jet technology whereby a jet of liquid is perturbed into a steady stream of droplets.
Practical CFD Models:
SPH method(Smoother particle hydrodynaics):
Smoothed-particle hydrodynamics (SPH) is a computational method used for simulating the mechanics of continuum media, such as solid mechanics and fluid flows. Smoothed-particle hydrodynamics is being increasingly used to model fluid motion as well. This is due to several benefits over traditional grid-based techniques. First, SPH guarantees the conservation of mass without extra computation since the particles themselves represent mass. Second, SPH computes pressure from weighted contributions of neighboring particles rather than by solving linear systems of equations. Finally, unlike grid-based techniques, which must track fluid boundaries, SPH creates a free surface for two-phase interacting fluids directly since the particles represent the denser fluid and empty space represents the lighter fluid.
Single-fluid model:
A typical approach used for the analysis of two-phase flows is a mixture model, i.e. the individual fluid phases are assumed to behave as a flowing mixture described in terms of the mixture properties. The applied single-fluid model is a five-equation model consisting of the mass, momentum and energy equations for a vapor/liquid mixture, and two equations describing the formation and growth of the liquid phase.
Two-fluid model:
In the two-fluid model, separate sets of the governing equation for the vapor and liquid phases have been used. The interaction between the droplets and the heat exchange between the liquid phase and the solid boundary are not modelled here as well. Additionally, the velocity slip between vapor and the liquid phase is in this model taken into account.
Turbulence model:
Turbulence models are needed to predict the average mixing behaviour in flows that are on average one- or two-dimensional. The approach to the construction of tile turbulence model is guided by the experimental behaviour. The equations governing turbulent flows can only be solved directly for simple cases of flow. For most real life turbulent flows, CFD simulation use turbulent models to predict the evolution of turbulence. These turbulence models are simplified constitutive equations that predict the statistical evolution of turbulent flows.
CASE 1
Geometry:
In the geometry, we are creating the CAD model for the simulation that is shown in the below figure it is a 2-Dimensional model.

the geometry is created as above with the dimensions as given below.
20x20mm the upper domain is water.
20x20mm the lower domain is air.
And then the share topology has been enabled to observe the phenomenon happening at the interface.
MESH:
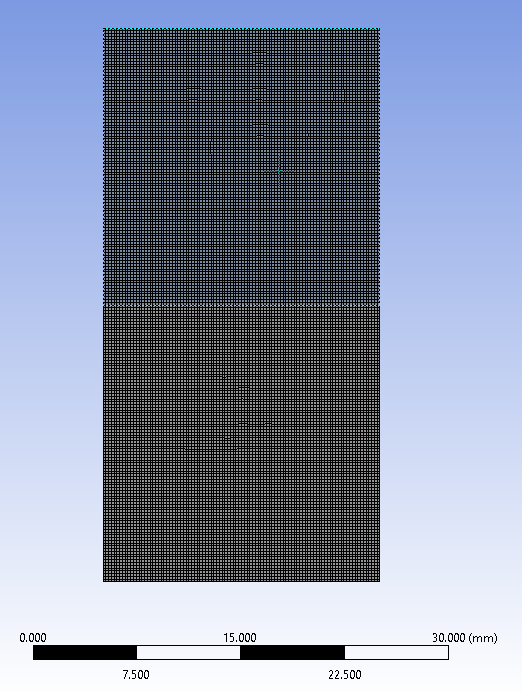
Element size: 0.5 mm.
Elements: 3200
Nodes: 3321
Solver: Pressure based, Transient Time solver.
Viscous model: Laminar.
Fluid Materials: Air and Water.

Setup:

viscous model -> laminar

Multiphase model:


Materials:


Initialization:
Standard initialisation
patch:
volume fraction of water
alpha = 0 for air side
alpha = 1 for water side


Timestep size: 0.005s
No. of Timesteps: 1000
Results:
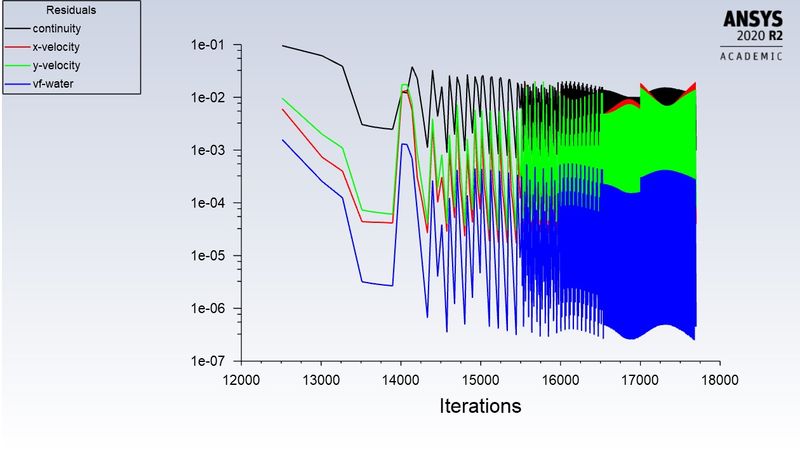
Residuals

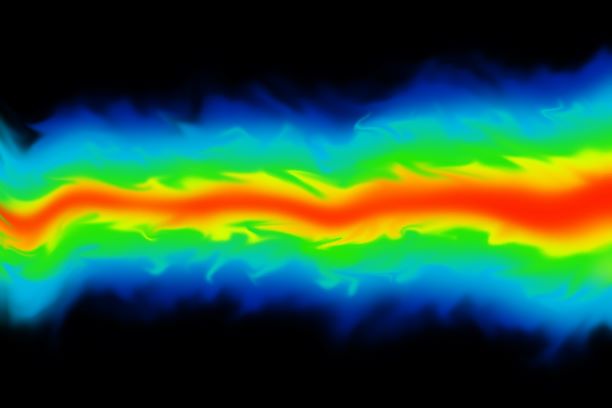
Contour:

Animation for the baseline simulation to observe Rayleigh-Taylor instability.
CASE 2
The Refined mesh with the cell counts:
Element size: 0.3 mm.
Elements: 8978
Nodes: 9180
Solver: Pressure based, Transient Time solver.
Viscous model: Laminar.
Fluid Materials: Air and Water.
Timestep size: 0.005s
No. of Timesteps: 1000

Results:

Contour:

Animation Created for this case.
CASE 3
The Refined mesh with the cell counts:
Element size: 0.2 mm.
Elements: 20000
Nodes: 20301
Solver: Pressure based, Transient Time solver.
Viscous model: Laminar.
Fluid Materials: Air and Water.
Timestep size: 0.005s
No. of Timesteps: 1000
Mesh:

Results:
Residuals

Contours:

Animation
TABLE-
|
case 1 |
case 2 |
case 3 |
|
Element size: 0.5 mm. Nodes: 3321 Elements: 3200 |
Element size: 0.3 mm. Nodes: 9180 Elements: 8978 |
Element size: 0.2 mm. Nodes: 20301 Elements: 20000 |
We observe that as case 1 to case 2 to case 3, as element size reduces the bubble formation increases.
Steady is not used in this case because at steady state we will get to the behavior of fluid at independent of time but in case we need to study instability at interface from instant when it starts which help to get better idea how heavy dense get mixed and lighter density fluid rise above with respect to time domain.
one more simulation with water and user-defined material(density = 400 kg/m3, viscosity = 0.001 kg/m-s) for refined mesh.


Mesh:
Element size: 0.3 mm.
Nodes: 9180
Elements: 8978
Solver: Pressure based, Transient Time solver.
Viscous model: Laminar.
Fluid Materials: user-defined material with a density of 400 kg/m^3, the viscosity of 0.001 kg/m-s and Water.
Timestep size: 0.005s
No. of Timesteps: 1000

Results
residuals:

contour:

Animation:
Atwood Number.
The Atwood number (A) is a dimensionless number in fluid dynamic used in the study of hydrodynamic instabilities in density stratified flows. It is a dimensionless density ratio defined as
where
- = density of heavier fluid
- = density of lighter fluid
Atwood number is an important parameter in the study of Rayleigh-Taylor instability. For Atwood number close to 0, RT instability flows take the form of asymmetric “finger” of fluid; for Atwood number close to 1, the much lighter fluid “below” the heavier fluid takes the form of larger bubble-like plumes.
Calculating the Atwood Number for the above cases.
For case 1, 2, 3
Denser fluid (Water) = 998.2 kg/m^3
Lighter fluid (Air)= 1.225 kg/m^3
Atwood Number,
A=998.2−1.225998.2+1.225
A=0.997
For case 4,
Denser fluid (Water) = 998.2 kg/m^3
Lighter fluid (user defined material)= 400 kg/m^3
A=0.427
variation in Atwood number in the above two cases affects the behaviour of the instability.
For Atwood number close to 0, RT instability flows take the form of symmetric fingers of fluid.
When Atwood number close to 1, the much lighter fluid below the heavier fluid takes the form of larger bubble-like plumes.
Therefore, from the value of Atwood number it is seen from the simulations that air forms larger bubbles when water is poured down the air pushes through and forms large bubbles. Therefore, the results can be validated by obtaining the value of the Atwood number.
Atwood number is an important parameter in the body of Rayleigh Taylor instability and Richtmyer-Meshkov instability. In Rayleigh-Taylor instability, the penetration distance of heavy fluid bubbles into the lighter fluid is a function of the acceleration time scale. A*g*t^2, where 'g' is the acceleration due to gravity and 't' is the time.
Atwood number effects on the instability of a uniform interface driven by a perturbed shock wave and Rayleigh Taylor instability:-
The evaluation of a uniform interface subjected to a perturbed shock wave has been experimentally studied over a range of atwood numbers 0.22 <= A <= 0.68 and mach numbers 1.2 <= M <= 1.8 using a vertical shock tube. The perturbed shock wave is produced by diffracting a planar insident shock over a regid cylinder. The wave patterns of the perturbed shock are captured by high speed shadowgraphy while the evoluation of the shock interface is captured by planar Mie scattering. Besides the formation of a cavity and two steps, an apparent counter rotating vortex pair emerges on the shock interface due to the baroclinic vorticity deposition, as both the atwood number and mach number increase, Quantitatively it is interesting to note that the amplitude growth rae of the shocked interface decreases with increasing the atwood number, which is fundamentaly different from the results related to the classical RM instability. This notable features is explained by the approximation of an oblique shock hitting a uniform interface. For weak shock, a suitable time scaling is employed to collapse experimental data irrespective of the Atwood number difference.
Leave a comment
Thanks for choosing to leave a comment. Please keep in mind that all the comments are moderated as per our comment policy, and your email will not be published for privacy reasons. Please leave a personal & meaningful conversation.
Other comments...
Be the first to add a comment
Read more Projects by Athiyaman R (16)
Week 10 - Simulating Combustion of Natural Gas.
Theory of Combustion: It is a high-temperature exothermic reaction (redox) between a fuel (reductant ) and an oxidant or the oxidizer to release a large amount of chemically bound energy. A flame is a characteristic indicator of the combustion reaction.lt is a sequence of elementary radical reactions. Solid fuels undergo…
23 Sep 2021 08:31 AM IST
Week 9 - Parametric study on Gate valve.
Introduction The gate valve is the fluid valve that opens by lifting the barrier gate from the path of the fluid flowing thriugh a pipeline. Gate valves require generally very less space and are and can be fitted along the pipe axis and they hardly restict any fluid flow when they are fully opened. The schematic of the…
06 Sep 2021 05:19 AM IST
Week 8 - Simulating Cyclone separator with Discrete Phase Modelling
Empirical models for Cyclone Separator Efficiency: Iozia and Leith Model: Iozia and Leith logistic Model is a modified version of Barth (1956) model which is developed based on force balance. The model assumes that a particle carried by the vortex endures the influence of two forces: a centrifugal force Z, and flow resistance,…
26 Aug 2021 01:44 PM IST
Week 6 - CHT Analysis on a Graphics card
Conjugate Heat Transfer (CHT) Conjugate heat transfer is defined as the heat transfer between two domains by exchange of thermal energy. For a system the thermal energy available is defined by its temperature and the movement of thermal energy is defined by its heat flux through the outer walls. Heat transfer in…
02 Jul 2021 05:34 PM IST
Related Courses


Skill-Lync offers industry relevant advanced engineering courses for engineering students by partnering with industry experts.
Our Company
4th Floor, BLOCK-B, Velachery - Tambaram Main Rd, Ram Nagar South, Madipakkam, Chennai, Tamil Nadu 600042.
Top Individual Courses
Top PG Programs
Skill-Lync Plus
Trending Blogs
© 2025 Skill-Lync Inc. All Rights Reserved.


