Week-4 Challenge WOT Condition Part-2
1) What is the difference between mapped and dynamic model of engine, motor and generator? How can you change model type
ANS:
1.Mapped and dynamic models in SIMULINK
Mapped model:
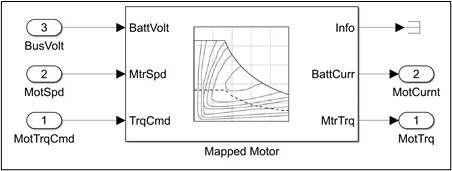
Mapped model of Motor.
- It makes use of lookup tables and the values should be pre-defined.
- The simulation time is less.
- The results obtained will not resemble the actual result.
Dynamic model:
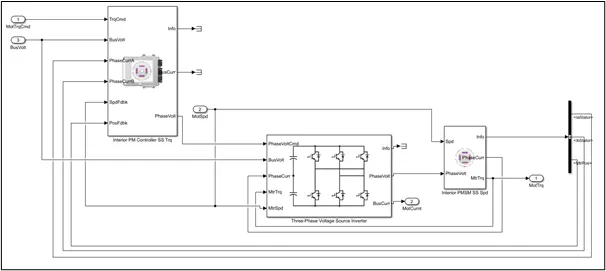
Dynamic model of Motor.
- The values that are used as input are first calculated using the Simulink blocks so that the values resemble the actual case.
- The results obtained using this model will resemble the actual results.
- The simulation time is more.
|
Mapped Engine model |
Dynamic Engine model |
|
Mapped engines represent macro engine behaviour as a set of lookup tables (brake torque, fuel flow, air mass flow, exhaust temperature, efficiency, and emissions) as functions of commanded load and measured engine speed. |
Dynamic engines decompose engine behaviour into individual component models that account for engine dynamics, most notably intake airflow and turbocharger dynamics. |
|
Mapped engine models are suitable for analysis and design activities that do not require engine subsystem dynamic characteristics |
Dynamic engine models are suitable for designing control, estimator, and diagnostic algorithms that depend on dynamic subsystem states, for example, in closed-loop AFR control algorithm development. |
|
Mapped Motor model |
Dynamic Motor model |
|
The Mapped Motor block implements mapped motor and drive electronics operating in torque-control mode. The output torque tracks the torque reference demand and includes a motor-response and drive-response time constant. |
The model will be built using Simulink blocks and feedback from few models is also considered. |
|
Mapped Generator model |
Dynamic Generator model |
|
All the parameters will be pre-defined in the block for this model. |
This model will be built using the Simulink blocks and the all the input values will be dynamic. |
To changed model type from mapped to dynamic or dynamic to mapped
After entering into passenger block > electric plant> motor will get this window where MotGenMapped is by default selected as a model type for motor
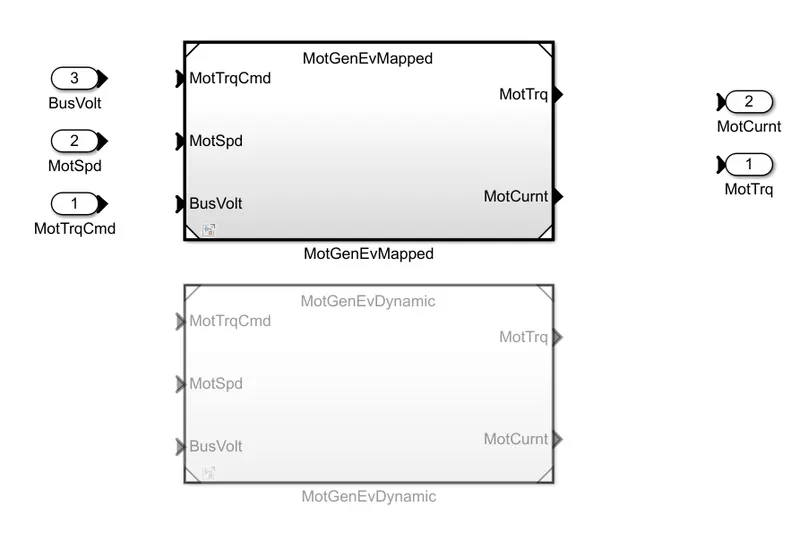
To change from MotGenEvMapped to MotGenEVdynamic
first, we open our reference model into Matlab
here we are choosing EV as an example
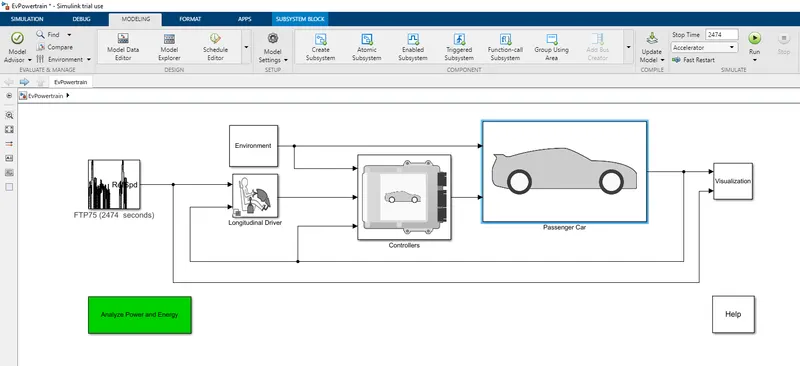
then after clicking on the modeling section and after that in the design block, we will select the variant manager option
after the variant manager window gets opened.
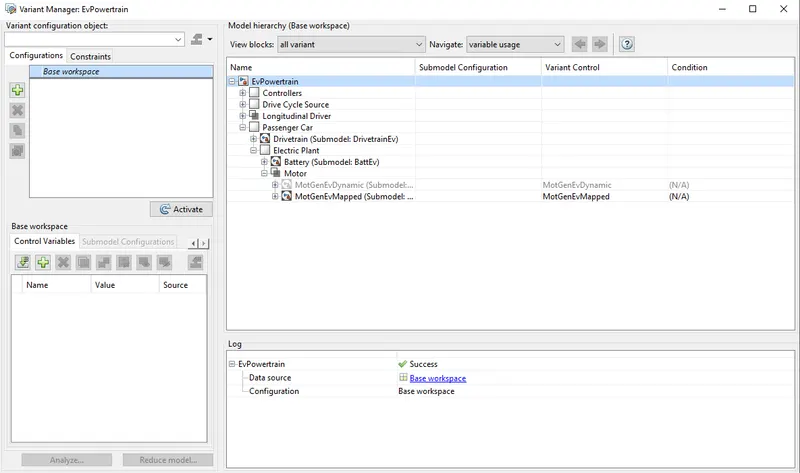
then by clicking on the passenger car expand option there will electric plant option that will expand that too in that will get both battery and motor
We are taking motor as an example so after expanding the motor option we will get
1)MotGenEVdynamic
2)MotGenEVmapped
so the default one is MotGenmapped to change into MotGenEVdynamic
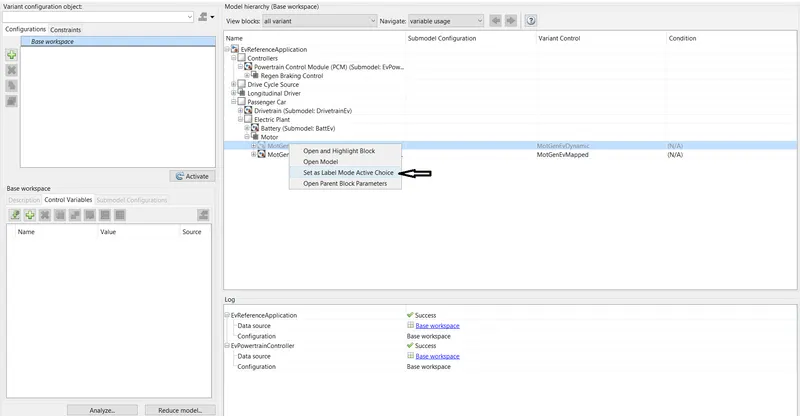
we need to right-click on our preference and after that, a pop up will be shown in which we need to select 'set as label mode active choice' and after that our motor variant will be MotGenEVdynamic
-same we can do for the battery to
- to verify whether its change or not will return to our model and open passenger block >electric plant>motor
and clicking on the motor block will get this window.
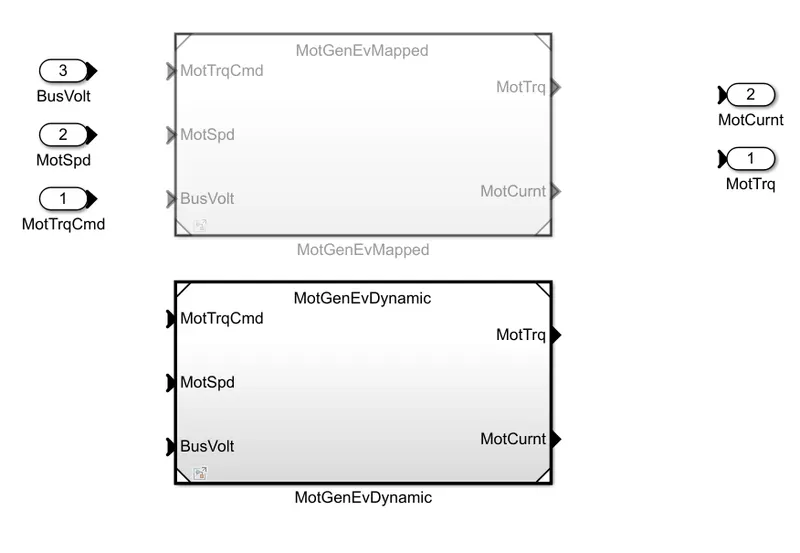
as we can see we changed our variant from MotGenMapped to MotGendynamic
a same procedure we can do for changing variant from MotGendynamic to MotGenMapped for both battery and motor.
that's how we can change our model type
2) How does the model calculate miles per gallon? Which factors are considered to model fuel flow?
ANS:
Theory:-
MPG, or miles per gallon, is the distance, measured in miles, that a car can travel per gallon of fuel. MPG is also the primary measurement of a car's fuel efficiency: The higher a car's MPG, the more fuel-efficient it is.
The U.S. Environmental Protection Agency, or the EPA, is the government agency responsible for certifying a vehicle's MPG figures, notes How stuffs works.
A car's MPG can be inconsistent because it is affected by a number of different factors, so it is difficult to get an accurate measurement. For example, factors like traffic and road conditions can affect MPG in any given context. That's why the EPA runs tests over a standard set of courses, then averages the results to calculate a vehicle's official MPG.
The EPA gives each vehicle three different MPG ratings, as All Car Leasing notes:
- Highway MPG: the average a car will get while driving on an open stretch of road without stopping or starting, typically at a higher speed.
- City MPG: the score a car will get on average in city conditions, with stopping and starting at lower speeds.
- And, combined MPG, a combined average of highway and city MPG.
In recent years, the EPA has expanded its testing capabilities to include alternatively-fuelled vehicles including electric vehicles. These ratings calculate the equivalent amount of energy that a vehicle uses to one gallon of traditional fuel. This allows consumers to compare the fuel efficiency of electric vehicles with regular ones.
MPG is an important metric to know about any vehicle that you're considering purchasing. It tells you about the difference in cost between operating different vehicles by giving you a sense of how much money you're likely to spend on fuel. This becomes especially important when fuel prices are higher, since every bit of savings count for your budget.
While MPG can help you compare different vehicles, it doesn't tell you anything about real-world fuel prices. However, you can easily calculate approximately how much you'll spend on fuel at different price levels, depending on how much distance you drive on a regular basis.
How does the model calculate miles per gallon?
-To calculate the fuel flow, vehicle speed & battery power are taken into consideration.
HEV model has separate blocks to calculate the MPG Which are shown below.
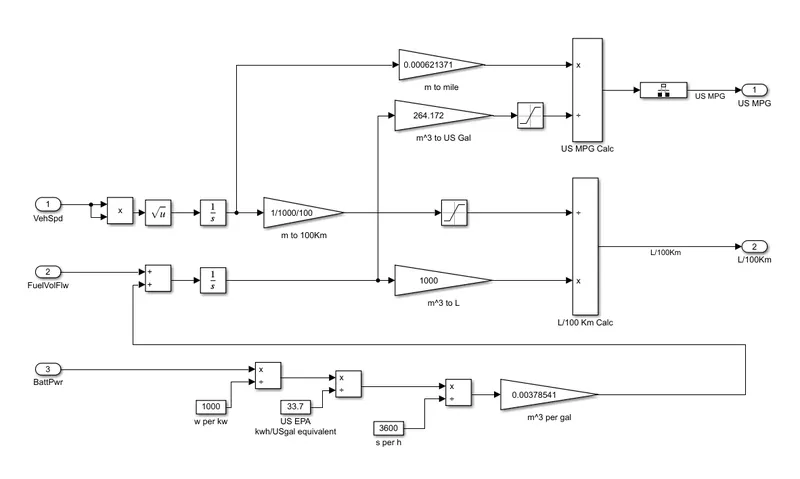
The above snap shows the Simulink model built to shows the fuel economy in Miles per Gallon using the vehicle speed, fuel flow velocity and the battery power. The HEVs use both fuel and battery power.
- The vehicle speed is integrated with time to determine the distance and converts the distance in miles by multiplying with 0.000621371.
- The battery power is converted to kWh by dividing it with 1000 and the then it is divided with 33.7 (standard value) to convert it into kWh to kWh/USgal then the value is divided by 3600 so the resulting value will be in m^3 then ot will be converted to m^3/gal by multiplying it with 0.00378541 and the resulting value from this block will be added with the fuel flow velocity.
- The fuel flow velocity is added with the value from ‘m^3 per gal’ then it is integrated and multiplied with 264.172 such that the resulting will be in US Gallon.
- Finally, dividing the distance (in miles) by fuel flow (in US Gal) we get the US MPG.
The following are factors which are considered to model fuel fuel.
-Vehicle speed
-Fule flow
-Battery power
3) Run the HEV ReferenceApplication with WOT drive cycle. Change the grade and wind velocity in the environment block. Comment on the results.
ANS:
The Hybrid Electric Vehicle reference application represents a full multimode hybrid electric vehicle (HEV) model with an internal combustion engine, transmission, battery, motor, generator, and associated powertrain control algorithms.
By default, the HEV multimode reference application is configured with:
- Mapped motor and generator.
- 1.5–L spark-ignition (SI) dynamic engine.
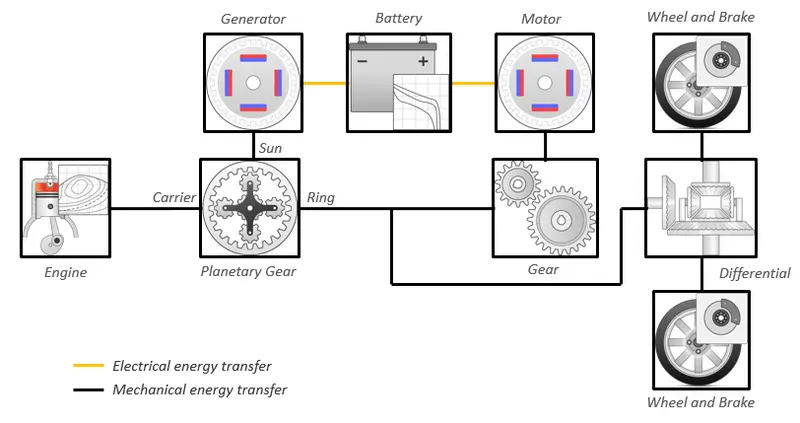
Powertrain Configuration of Hybrid Electric Vehicle
3a. Without changes in grade and wind velocity values.
Simulink model:
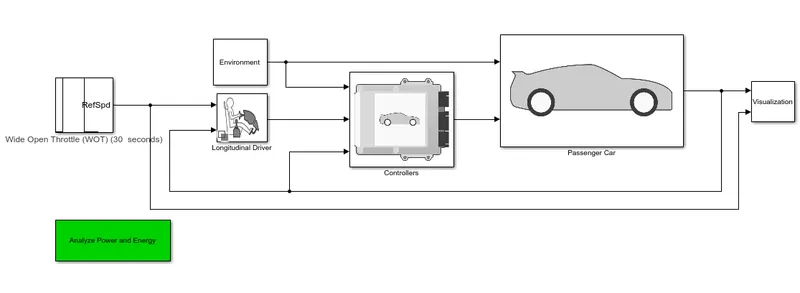
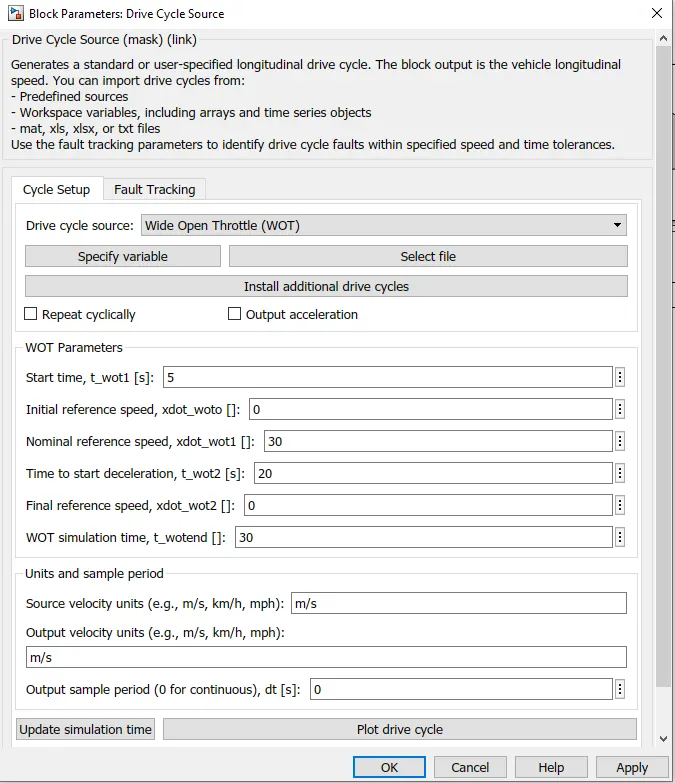
Drive cycle source:
The drive cycle source for this model is set to Wide Open Throttle (WOT) and other parameters are provided with the values as shown in below snap.
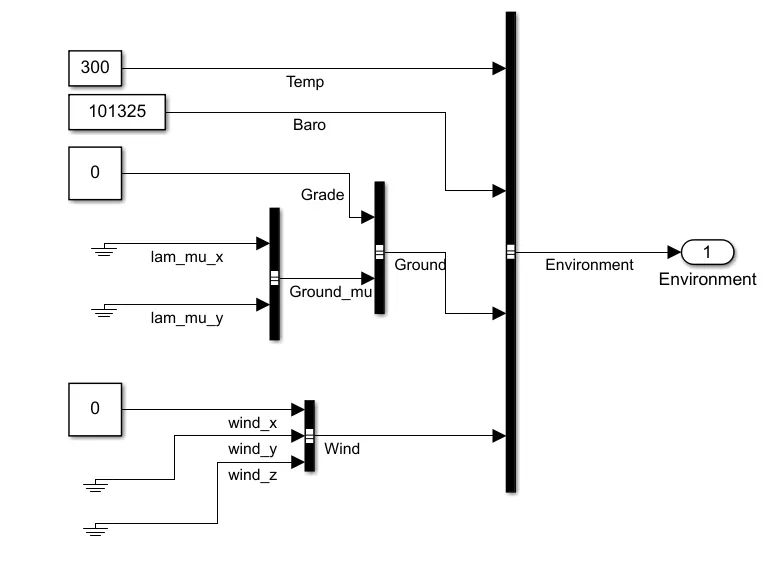
Environment sub system:
This is the subsystem where, the environmental conditions can be changed as per user requirement.
All the other parameters are kept in default condition with grade and wind velocity set to zero.
Output:
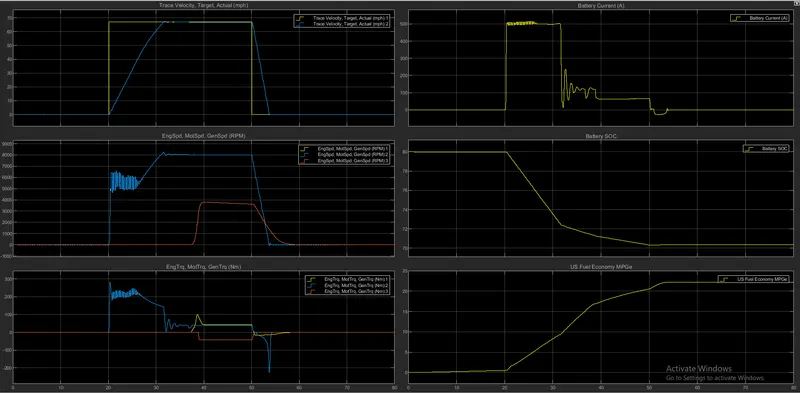
- In the first graph the yellow curve is the ideal WOT cycle and the blue curve is actual WOT cycle obtained for the given parameters.
- In the second graph (Speed), it can be observed that the speed of the engine and the generator are same throughout the drive cycle and rapid increase in motor speed can be observed and then after few seconds the engine speed also increases and reduces while decelerating.
- In the third graph (Torque), the torque of motor is high for few seconds during full throttle and then it reduces gradually and this is same for both motor and generator.
- In the fourth graph (Battery current), the current utilized is more till the engine is turned on, once the engine turns on the vehicle runs on both engine and electric motor power with reduced use of current.
- In the fifth graph (SOC), we can see that the SOC of the battery reduces gradually when the vehicle runs on electric motor and from 32 to 50 sec of time interval, we can see that the SOC reduces slowly because the generator charges the battery.
- In sixth graph (Fuel economy), which indicates the economy of fuel high when the vehicle runs on electric motor.
3b. With changed grade and wind velocity values.
All the parameters and the Simulink model are kept same without any changes except wind velocity and grade in environment subsystem.
Environment subsystem:
This is subsystem where the environmental conditions can be changed as per user requirement.
All the other parameters are kept same except grade and wind velocity values.
Grade is set to 110 and wind velocity to 22.22ms-1 as shown in below snap.
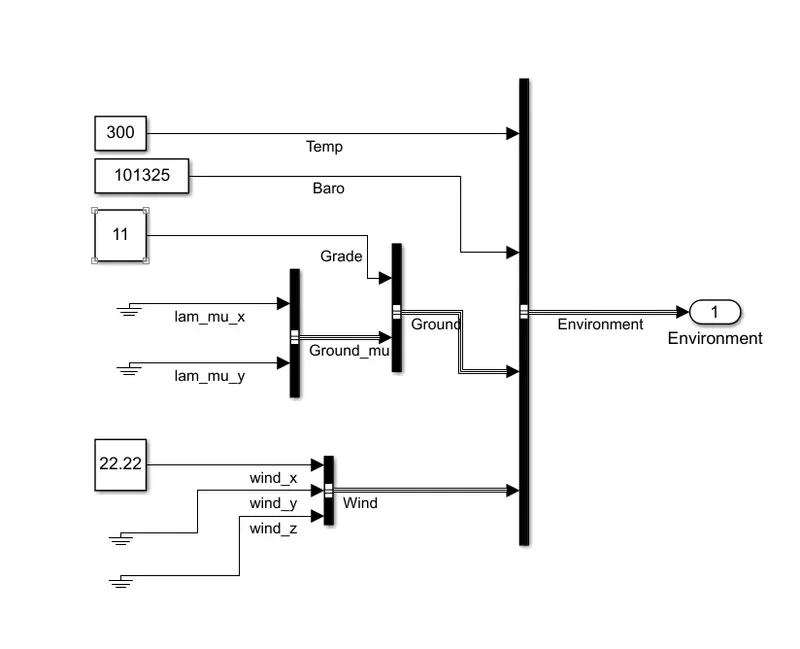
After making all the required changes the simulation is run for 80 seconds and the following output was obtained.
Output:
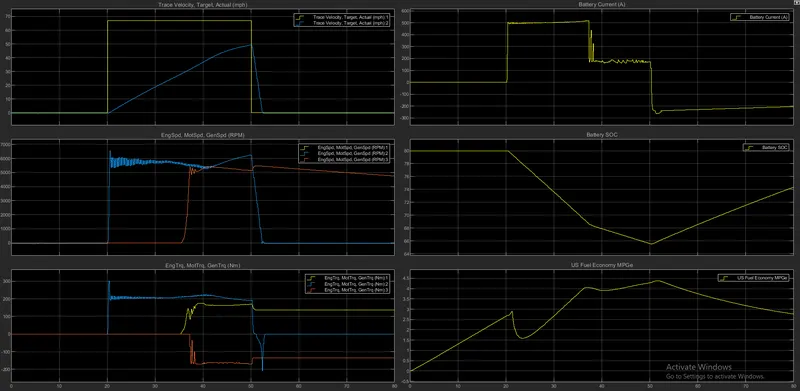
- In the first graph, the blue curve is the ideal WOT cycle and the red curve is actual WOT cycle obtained for the given parameters.
- In the second graph (Speed), it can be observed that the speed of the engine and the generator are same throughout the drive cycle and we can also see that with the reduce in the current supply the motor speed reduces during this the engine speed is increased gradually. Now, for few seconds both engine and motor operate to displace the vehicle and then the speed of engine and generator reduces gradually.
- In the third graph (Torque), the torque of both motor and engine is more with more acceleration and reduces with deceleration. But the nature of torque plot of generator is negative which indicates the generator is activated and the battery is getting charged.
- In the fourth graph (Battery current), the current utilized is more till the engine is turned on, once the engine turns on the vehicle runs on both engine and electric motor power.
- In the fifth graph (SOC), we can see that the SOC of the battery reduces gradually when the vehicle runs on electric motor and from 37 to 50 sec of time interval, we can see that the SOC reduces slowly because the generator charges the battery.
- In sixth graph (Fuel economy), which indicates the economy of fuel high when the vehicle runs on electric motor.
At last, by comparing both it can be concluded that the HEV with grade and wind velocity requires more speed, torque and battery current to overcome the given environment condition.
4) Keeping all other parameters same, compare the simulated results of hybrid and pure electric powertrains.
ANS:
a.EV
Simulink model:
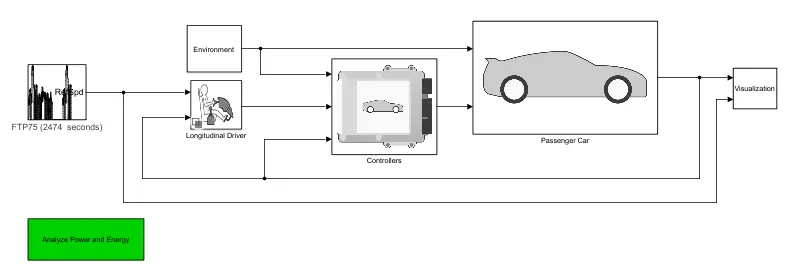
Drive cycle source:
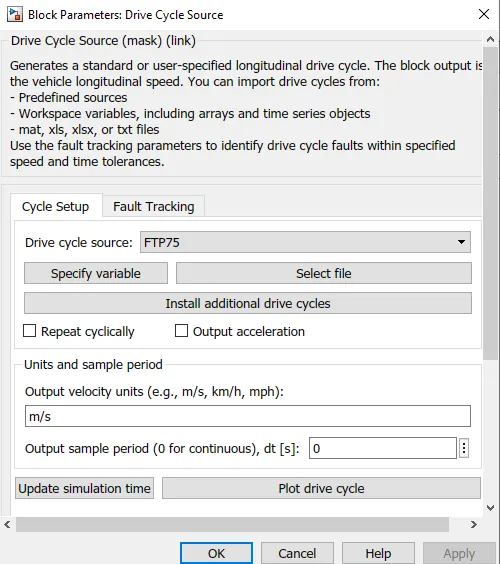
The drive cycle source for this model is set to FTP75 and simulation time for this drive cycle is 2474 seconds. The below snap shows the parameters that are defined for the drive cycle and also the type of drive cycle opted.
Environment sub system:
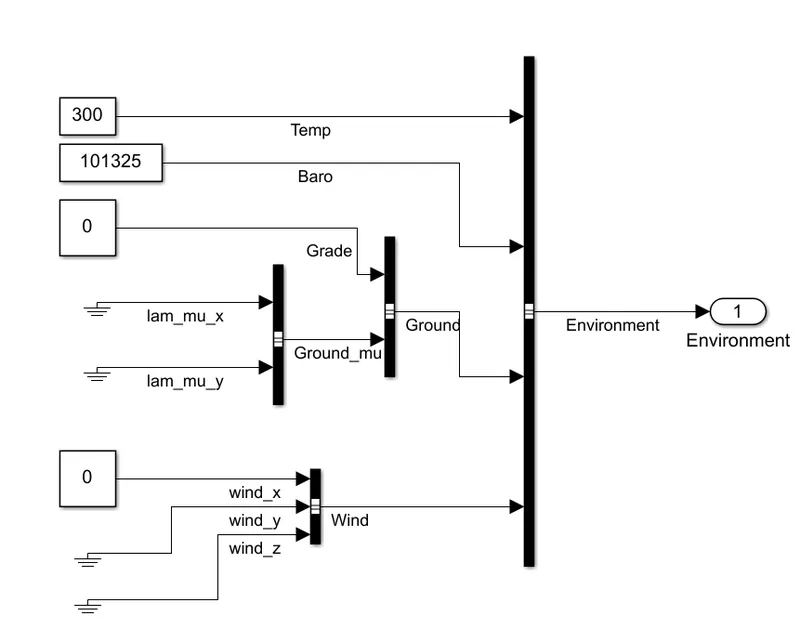
This is the subsystem where, the environmental conditions can be changed as per user requirement.
This allows us to get the results which will be similar to an actual vehicle.
Output:
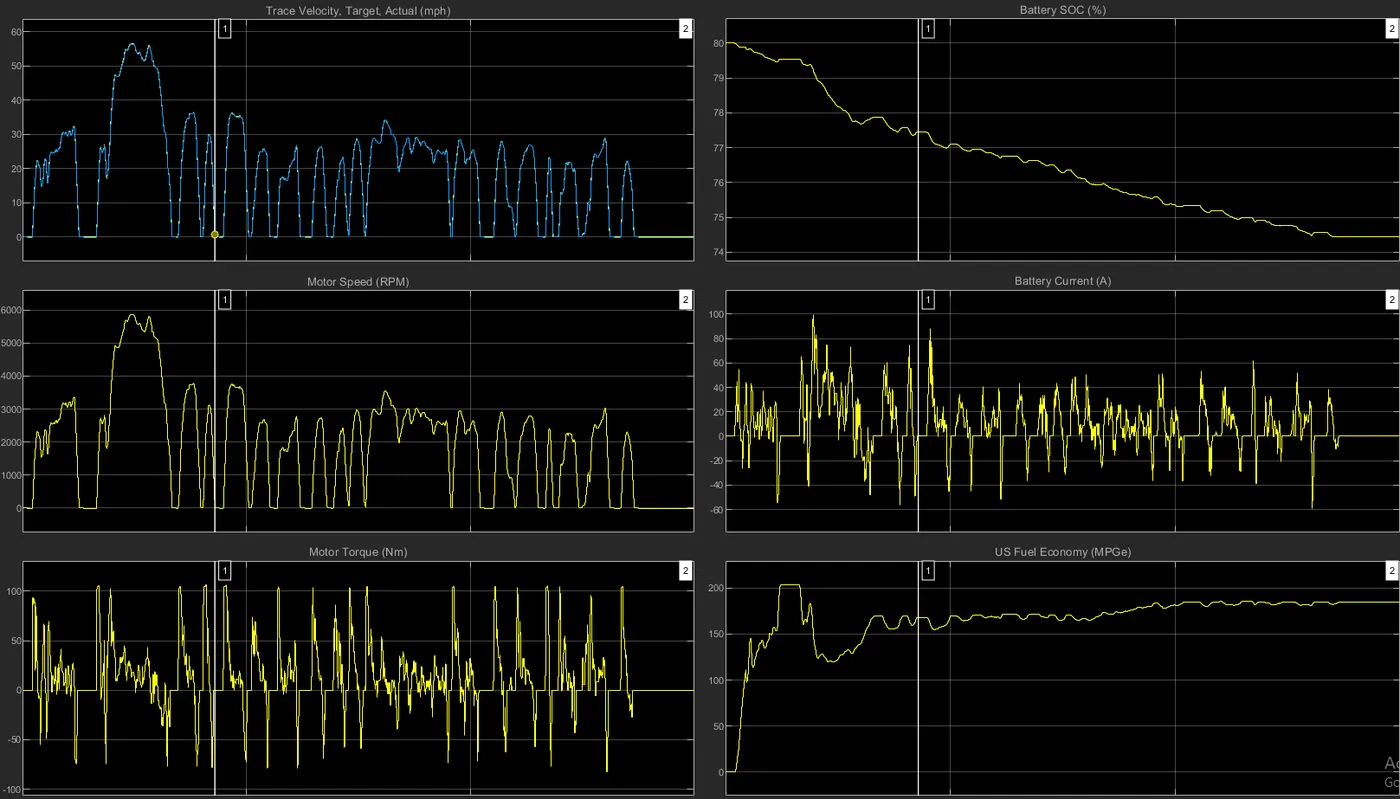
- The first graph shows the FTP75 standard drive cycle which is provided as source for the model.
- In the second graph (Speed), it can be observed that the plot of speed of the motor resembles the drive cycle which indicates that motor speed is varying according to the drive cycle.
- In the third graph (Torque), the torque of the motor is high during the acceleration and low during the deceleration.
- In the fourth graph (SOC), we can see that the SOC of the battery reduces gradually when the vehicle is accelerated and gets charged during the deceleration. For this model, SOC is reduced from 80% to 71.61%.
- In the fifth graph (Battery current), the current utilized by the motors will be more during the acceleration.
- In sixth graph (Fuel economy), it can be observed that the fuel economy is more as entire model is running only on electric motor.
b.HEV
All the parameters are kept same as in EV model.
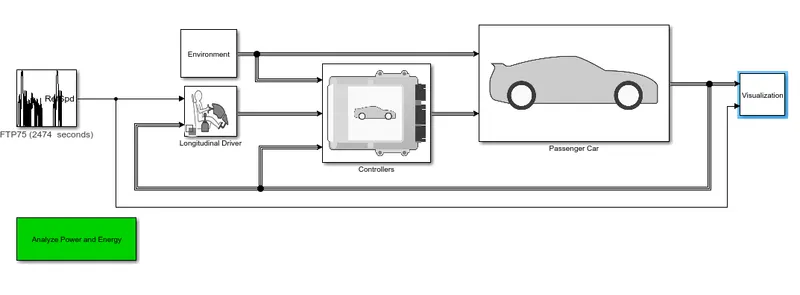
Simulink model:
Output:
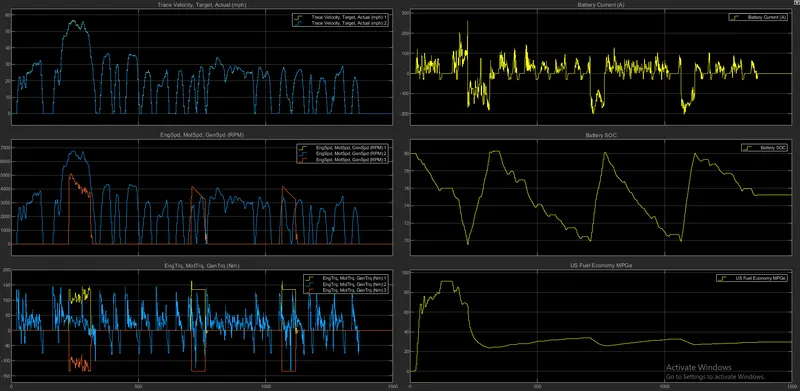
- The first graph shows the FTP75 standard drive cycle and the actual drive cycle, which are quite similar in nature.
- In the second graph (Speed), it can be observed that the plot of speed of the motor resembles the drive cycle which indicates that motor speed is varying according to the drive cycle. Simultaneously, the engine is turned ON (when SOC of battery tends to decrease beyond 70% and this engine in turn runs the generator and battery is charged.
- In the third graph (Torque), the torque of the motor and engine is high during the acceleration and decreases with deceleration.
- In the fourth graph (Battery current), the current utilized by the motors will be more when the motor is at high speed i.e., during the acceleration.
- In the fifth graph (SOC), we can see that the SOC of the battery reduces gradually when the vehicle is accelerated and gets charged during the deceleration due to the regenerative braking. For this model, SOC varies between 80% to 70%. So, if the battery SOC tends to decrease below 70% then the Engine is turned ON and due to the generator, the battery will be charged.
- In sixth graph (Fuel economy), it can be observed that the fuel economy is more when the vehicle runs on motor and fuel economy decreases when it runs on fuel.
Results of HEV and Ev compared:
- EV runs on motor alone so the battery drains quickly but in case of HEV the model run on both motor and engine due to which the distance covered will be more and more power can be obtained.
- In EV model SOC of battery cannoty be utilized within a particular limit but it is possible in HEV, we can set upper limit and lower limit, if the SOC is below the lower limit the the motor stops and engine is turned on and the battery gets charged.
- If the SOC of ballety is equal to upper limt then the engine turns off and the model rums on motor until the SOC decreases below the lower limit.