Project - Data Handling and Interpolation
Aim: Data Handling and Interpolation
Objective:
- Read the excel file.
- Interpolation of the given data.
- Generate relative plot.
- Write to the output text file.
Solution:
Program:
data1=xlsread('VI.xlsx');%to read excel file
V=data1(:,1);%to read voltage values from 1st column of excel file
I=data1(:,2);%to read current values from 2nd column of excel file
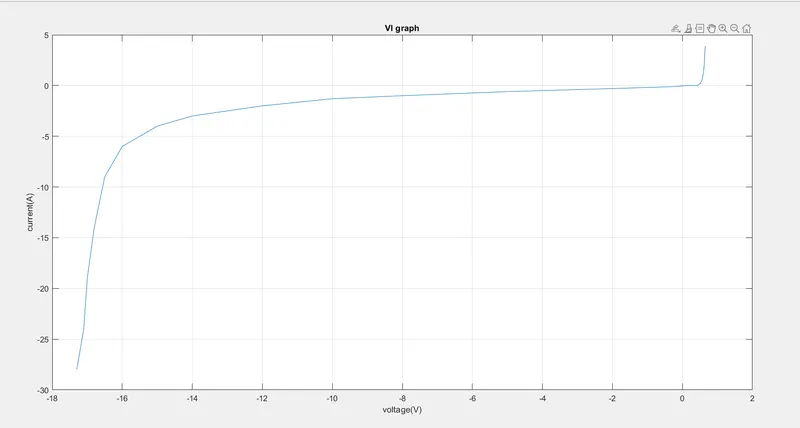
plot(V,I);
grid;
xlabel('voltage(V)');
ylabel('current(A)');
title('VI graph');
Ir=-17.3:0.1:0.9;%Interpolation range
I1=interp1(V,I,Ir);%Linear interpolation
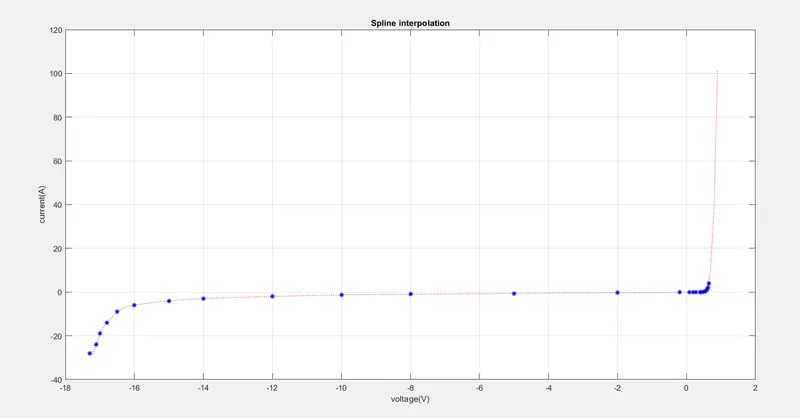
I2=interp1(V,I,Ir,'spline');%Spline interpolation
plot(Ir,I2,'r:',V,I,'b*',LineWidth=1);
grid;
xlabel('voltage(V)');
ylabel('current(A)');
title('Spline interpolation');
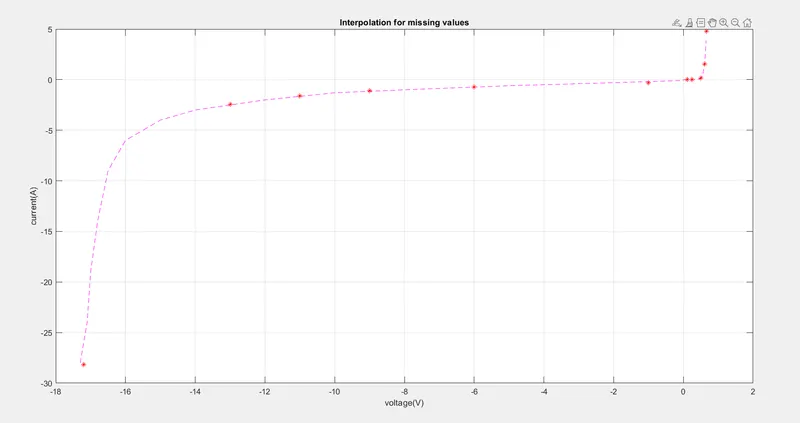
data2=xlsread('VI.xlsx',2);%to read missing voltage values from sheet 2 of excel file
Vnew=data2(:,1);
I3=interp1(V,I,Vnew,'spline');%Interpolation for missing voltage values
plot(V,I,'m--',Vnew,I3,'r*');
grid;
xlabel('voltage(V)');
ylabel('current(A)');
title('Spline interpolation for missing values');
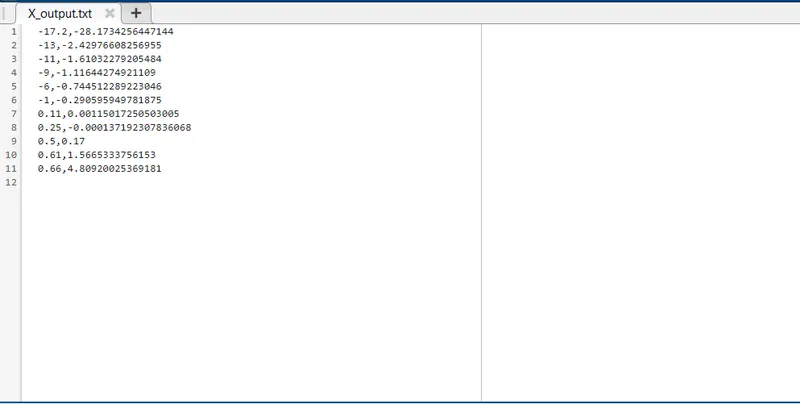
X(:,1)=Vnew(:,1);
X(:,2)=I3(:,1);
writematrix(X,'X_output.txt');%to write the new interpolated values to output .txt file
Plots-