Project 2 - Rankine cycle Simulator
AIM:
Write a code to simulate the Rankine cycle in MATLAB.
INTRODUCTION:
1. THEORY OF RANKINE CYCLE
The Rankine cycle is an idealized thermodynamic cycle that describes how the energy is extracted from working fluid that moves between heat source and sink. It is commonly used in power generation plants that harness thermal energy from fuel sources into electricity. Rankin cycle is a vapor power cycle in which working fluid is alternatively vaporized and condensed.
Heat energy is supplied to the system, in order to convert working fluid typically water into steam to turn the turbine. Thus mechanical energy is generated and after passing through the turbine the steam is cooled down and converted into the liquid state. Then pumped to the boiler completing the cycle.
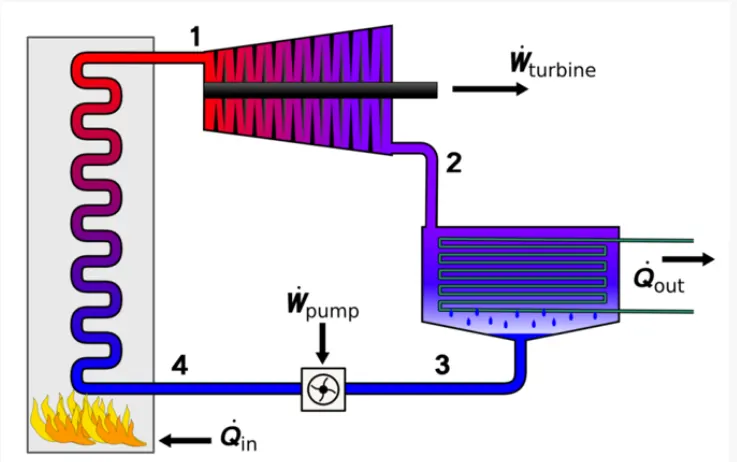
Figure: 1-Turbine 2-Compressor 3-Pump 4-Boiler
PROCESS
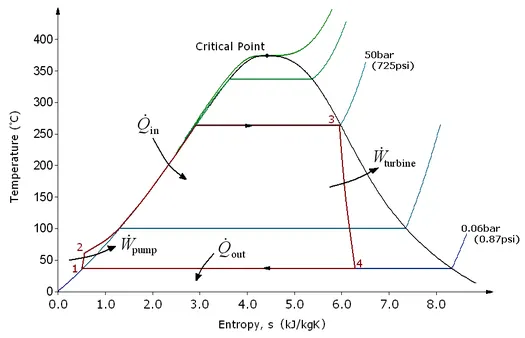
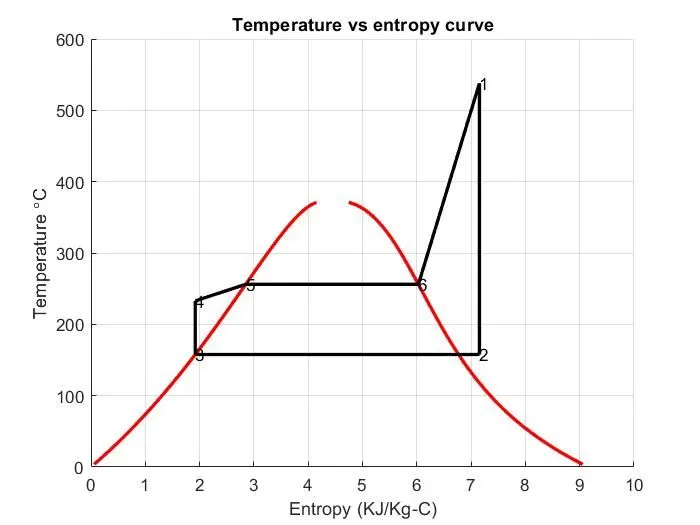
T-s diagram of a typical Rankine cycle operating between pressures of 0.06 bar and 50 bar. Left from the bell-shaped curve is liquid, right from it is gas, and under it is saturated liquid–vapour equilibrium.
process 1-2 water enters the pump at 1 as saturated liquid and is compressed isoentropically, which increases the temperature.
Process 2-3 Waters enters the boiler as compressed liquid and leaves as superheated vapor.
Process 3-4 the superheated vapor enters the turbine at 3, where it expands isoentropically and produce work by rotating the shaft connected to an electric generator. The pressure and temperature drops at stage 4, where steam enters condenser.
1-2 Isoentropic compression in a pump
2-3 Constant-Pressure heat addition in a boiler
3-4 Isoentropic expansion in a turbine
4-1 Constant pressure heat rejection in a condenser
GOVERNING EQUATIONS
Variables
 |
Heat flow rate to or from the system (energy per unit time) |
 |
Mass flow rate(mass per unit time) |
 |
Mechanical work consumed by or provided to the system (energy per unit time) |
 |
Thermodynamic efficiency of the process (net power output per heat input, dimensionless) |
 |
Isentropic efficiency of the compression (feed pump) and expansion (turbine) processes, dimensionless |
 |
The "specific enthalpy" at indicated points on the T-S diagram |
 |
The final "specific enthalpy" of the fluid if the turbine were isoentropic |
 |
The pressures before and after the compression process |
= `(W_(therm)-W)/(Q_(IN))`
Work done on the pump
`W_p = h_2 - h_1 =v_3(p_4-p_3)*100`
Head addition in the boiler
`Q_1 = h_3-h_2`
work delivered by Turbine
`W_t =h_3-h_4`
Heat energy rejected by the condenser
`Q_2 = h_4-h_1`
Net work done is given by `W_(Net) = W_t -W_p`
Thermal efficiency of the rankine cycle is `eta = (Q_1-Q_2)/(Q_1)=((h_3-h_2)-(h_4-h_1))/(h_3-h_3)`
ALso `eta = W_(Net)/Q_1*100`
Back work ratio is `BWR = W_p/W_t`
Specific stem consumption `SSC = 3600/(W_(Net))`
OBJECTIVES
- write a code to simulate rankine cycle in MATLAB.
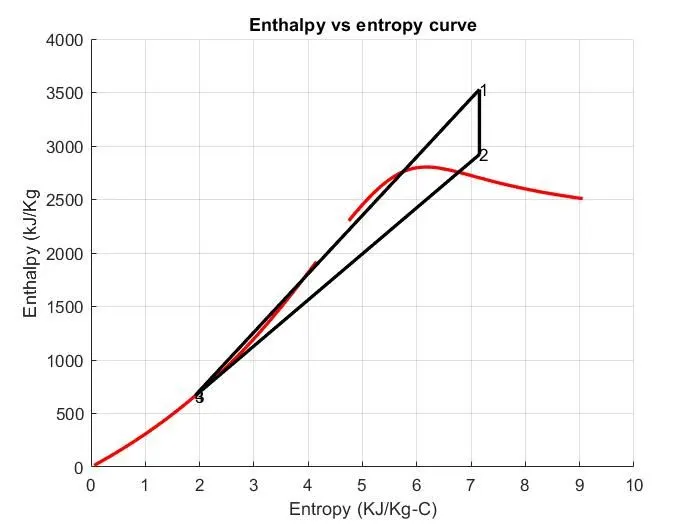
- Plot T-s and h-s diagrams for given inputs.
PROGRAM
clear
close all
clc

%Rankine cycle simulator
fprintf('                     RANKINE CYCLE SIMULATOR\n')
fprintf('\n')
fprintf('1-2 is Isoentopic Expansion in the Turbine\n')
fprintf('2-3 is constant pressure Heat Rejection by the condenser\n')
fprintf('3-4 is Isoentropic Compression in the Pump\n')
fprintf('4-1 is Constant Pressure Heat Addition by the Boiler\n')
%taking inputs from the user
p1 = input('Enter the Turbine intlet pressure in bars = ');
t1 = input('Enter the Turbine intlet temperature in celcius = ');
p2 = input('Enter the Turbine output pressure in bars = ');

%TURBINE inlet conditions
%stage 1
tsat_1 = XSteam('Tsat_p',p1);
if t1 > tsat_1
    h1 = XSteam('h_pt',p1,t1);
    s1 = XSteam('s_pt',p1,t1);
elseif t1 == tsat_1
        h1 = XSteam('h_Vp',p1,t1);
        s1 = XSteam('s_Vp',p1,t1);
    else
        fprintf("Enter a higher value of turbine inler temperature in celcius!! \n")
end

%tubine outlet
%stage 2
s2 = s1; %isoentropic expansion in the turbine
sf2 = XSteam('sL_p',p2);
sg2 = XSteam('sV_p',p2);

hf2 = XSteam('hL_p',p2);
hg2 = XSteam('hV_p',p2);

%dryness fraction of the steam in the cycle
x2 = ((s2-sf2)/(sg2-sf2));
h2 = hf2 + (x2*(hg2-hf2));
t2 = XSteam('Tsat_p',p2);

%at pump inlet
%stage 3
p3 = p2; %constant pressure process
t3 = XSteam('Tsat_p',p3);
s3 = XSteam('sL_p',p3);
h3 = XSteam('hL_p',p3);
v3 = XSteam('vL_p',p3);

%at boiler inlet
%stage 4
p4 = p1;
s4 = s3;
v4 = XSteam('v_ps',p4,s4);
cp4 = XSteam('Cp_ps',p4,s4);
cv4 = XSteam('Cv_ps',p4,s4);
gamma = cp4/cv4;
t4 = t3*(p4/p2)^((gamma-1)/gamma);

%work input at the pump
wp = v3*(p4-p3)*100;
%also wp = h4-h3
h4 = wp + h3;

%intermediate states 5 and 6
t5 = XSteam('Tsat_p',p4);
s5 = XSteam('sL_P',p4);
t6 = t5;
s6 = XSteam('sV_p',p4);

%work at turbine
wt = h1-h2;

%net work done
wnet = wt - wp;

%heat input
qin = h1-h4;

%heat output
qout = h2- h3;

%thermal efficiency
ntherm = (wnet/qin)*100;

%back work ratio
BWR = wp/wt;
%ssc
SSC = 3600/wnet;

fprintf('                     RESULTS\n')
fprintf('At State point 1:\n')
fprintf('P1 is : %.2f bar\nT1 is : %.2f deg celcius\nH1 is : %.2f kJ/Kg\nS1 is : %.2fkJ/KgK\n',p1,t1,h1,s1)
fprintf('\nAt State point 2:\n')
fprintf('P2 is : %.2f bar\nT2 is : %.2f deg celcius\nH2 is : %.2f kJ/Kg\nS2 is : %.2fkJ/KgK\n',p2,t2,h2,s2)
fprintf('\nAt State point 3:\n')
fprintf('P3 is : %.2f bar\nT3 is : %.2f deg celcius\nH3 is : %.2f kJ/Kg\nS3 is : %.2fkJ/KgK\n',p3,t3,h3,s3)
fprintf('\nAt State point 4:\n')
fprintf('P4 is : %.2f bar\nT4 is : %.2f deg celcius\nH4 is : %.2f kJ/Kg\nS4 is : %.2fkJ/KgK\n',p4,t4,h4,s4)

fprintf('\nwt is : %.2f kJ/Kg\n',wt)
fprintf('wp is : %.2f KJ/Kg\n',wp)
fprintf('wnet is : %.2f KJ/Kg\n',wnet)
fprintf('Ntherm is : %.2f Percent\n',ntherm)
fprintf('SSC is : %.2f Kg/Kwh\n',SSC)


%plotting the rankine cycle diagram
T = linspace(0,375,100);
figure(1)
hold on
for i = 1:length(T)
    sl(i) = XSteam('sL_T',T(i));
    sg(i) = XSteam('sV_T',T(i));
    hl(i) = XSteam('hL_T',T(i));
    hg(i) = XSteam('hV_T',T(i));
end

plot(sl,T,'linewidth',2,'color','r')
plot(sg,T,'linewidth',2,'color','r')
plot([s1,s2],[t1,t2],'linewidth',2,'color','k')
text(s1,t1,'1')
plot([s2,s3],[t2,t3],'linewidth',2,'color','k')
text(s2,t2,'2')
plot([s3,s4],[t3,t4],'linewidth',2,'color','k')
text(s3,t3,'3')
plot([s4,s5],[t4,t5],'linewidth',2,'color','k')
text(s4,t4,'4')
plot([s5,s6],[t5,t6],'linewidth',2,'color','k')
text(s5,t5,'5')
plot([s6,s1],[t6,t1],'linewidth',2,'color','k')
text(s6,t6,'6')

xlabel('Entropy (KJ/Kg-C)');
ylabel('Temperature \circC');
title('Temperature vs entropy curve')
grid on
hold off

%plotting h-s diagram
figure(2)
hold on
plot(sl,hl,'linewidth',2,'color','r')
plot(sg,hg,'linewidth',2,'color','r')
plot([s1,s2],[h1,h2],'linewidth',2,'color','k')
text(s1,h1,'1')
plot([s2,s3],[h2,h3],'linewidth',2,'color','k')
text(s2,h2,'2')
plot([s3,s4],[h3,h4],'linewidth',2,'color','k')
text(s3,h3,'3')
plot([s4,s1],[h4,h1],'linewidth',2,'color','k')
text(s4,h4,'4')

xlabel('Entropy (KJ/Kg-C)');
ylabel('Enthalpy (kJ/Kg');
title('Enthalpy vs entropy curve')
grid on
hold off
EXPLANATION
- First we are printing the process information of the rankine cycle.
- then the user is asked to enter the input values for p1, t1 and p2, which are turbine inlet pressure, temperature and outlet pressure.
- from the input pressure we are calculating the saturation temperature and comparing it with t1 to see if it is feasible for the turbine inlet temperature.
- at the turbine outlet saturated liquid and vapor entropy and enthalpy values are calculated. Using these values dryness fraction of the particular process is found. with this we can estimate the output values at turbine.
- using the particular process the required parameter are evaluated using Xsteam library.
- After finding all the parameters the requires variables like work done efficiency etc are calculate.
- The output variables are printed on the window.
- the plots are made for T-s and h-s diagram by using the plot commands.
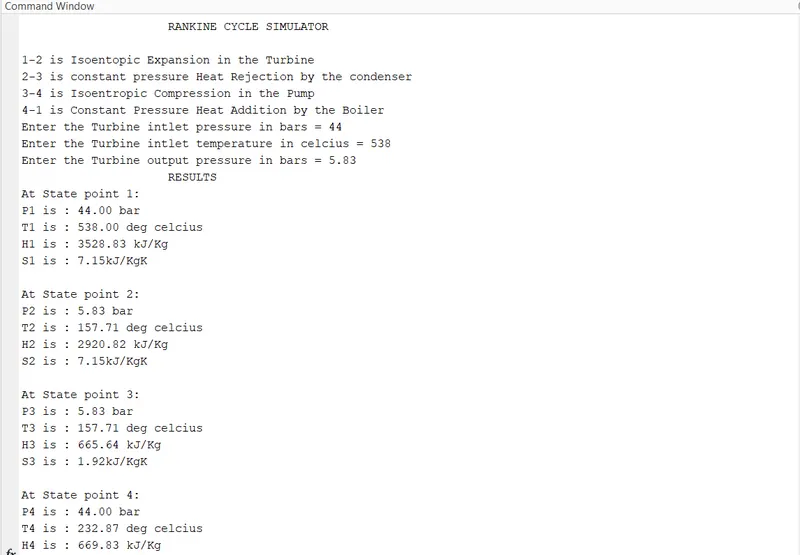
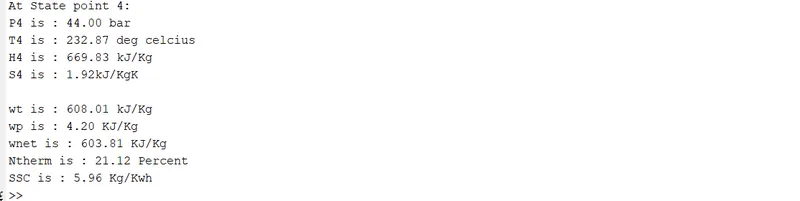
OUTPUT
GRAPHS
CONCLUISON
By changing the input variable in the code we can plot T-s and h-s diagrams and also calculate the performance variables.