Project 2
Project 2:
Assume you are appointed as a Data scientist in any international humanitarian NGO, after the recent funding programmes, have been able to raise around $ 120 million. Now the CEO of the NGO call you to choose how to use this money strategically and effectively. The significant issues that comes while making this conclusion are mostly related to choosing the countries that are in the direst need of aid. Your job is to classify the countries using some socio-economic and health factors that determine the overall development of the country. Then you need to suggest the countries which the CEO needs to focus on the most. Apply Principal component analysis, K-Means Clustering & Hierarchical Clustering.
Solution:
# -*- coding: utf-8 -*-
"""
Created on Mon Aug 15 20:54:41 2022

@author: TUF
"""

### **Hierarchial (Agglomerative) Clustring**
### Loading required modules

import pandas as pd
import numpy as np
import matplotlib.pyplot as plt
from sklearn.cluster import AgglomerativeClustering
from sklearn.preprocessing import StandardScaler
from scipy.cluster.hierarchy import dendrogram, linkage, fcluster

# Let us first explore the given data before using the clustering algorithms

data = pd.read_csv('Country_data.csv', index_col=False, na_values=["?"])
df1 = pd.read_csv('Country_data.csv', index_col=False, na_values=["?"])
df = df1.copy()

# Collecting features
features = list(df.columns)
print(features)

X1 = df[features]

# Data Preprocessing
X = pd.get_dummies(X1)
X = StandardScaler().fit_transform(X)

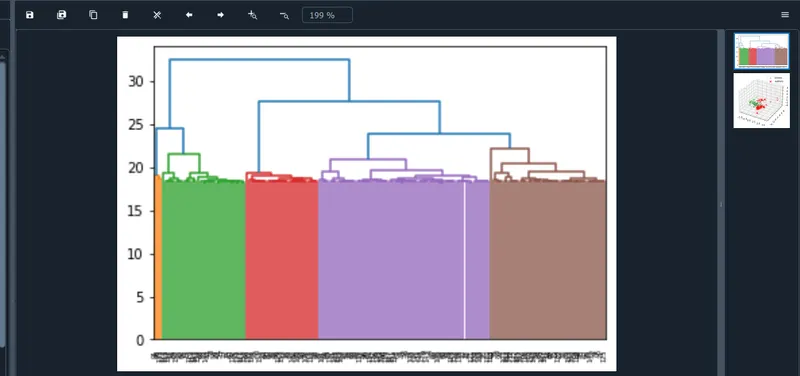
dendrogram = dendrogram(linkage(X,method='ward'))
clf = AgglomerativeClustering(n_clusters=2, affinity='euclidean', linkage='ward')
clf.fit(X)
labels = clf.labels_

data['anomaly'] = labels
outliers = data.loc[data['anomaly']==1]
outliers_index = list(outliers.index)
print(outliers_index)

# Find the number of anomalies and normal points here points calssified -1 are
#  anomalous

print(data['anomaly'].value_counts())

#import matplitlib.pyplot as plt

from sklearn.decomposition import PCA
from sklearn.preprocessing import StandardScaler
from mpl_toolkits.mplot3d import Axes3D
pca = PCA(n_components=3)  # Reduce to K=3 dimensions
scaler = StandardScaler()

# Normalize the matrix

X = scaler.fit_transform(X)
X_reduce = pca.fit_transform(X)

fig = plt.figure()
ax = fig.add_subplot(111, projection = '3d')

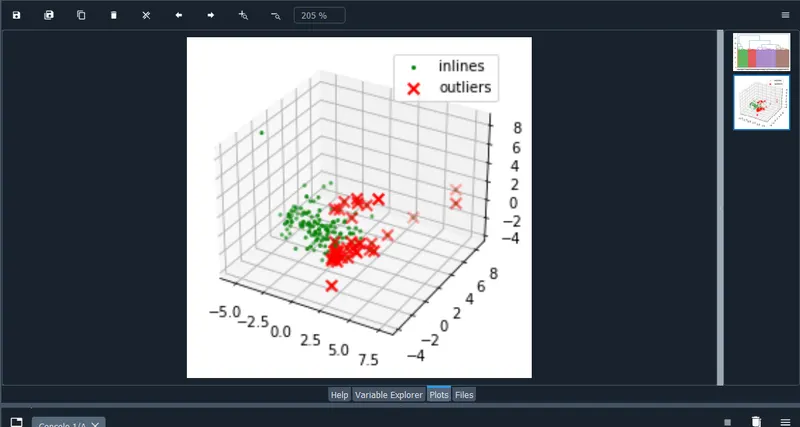
ax.scatter(X_reduce[:,0], X_reduce[:,1], zs = X_reduce[:,2], s=4, lw=1,
           label="inlines", c="green")
ax.scatter(X_reduce[outliers_index,0], X_reduce[outliers_index,1],X_reduce[outliers_index,2],
           lw=2, s=60, marker="x", c="red", label="outliers")
ax.legend()
plt.show()
Output:
runfile('D:/3. skill lync/Challanges/7.ML/project2/project2.py', wdir='D:/3. skill lync/Challanges/7.ML/project2')
['country', 'child_mort', 'exports', 'health', 'imports', 'income', 'inflation', 'life_expec', 'total_fer', 'gdpp']
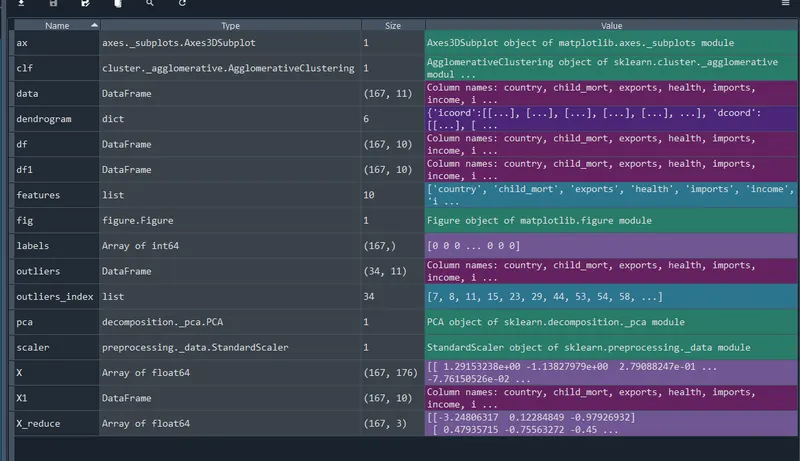
[7, 8, 11, 15, 23, 29, 44, 53, 54, 58, 60, 68, 73, 74, 75, 77, 82, 89, 91, 98, 110, 111, 114, 115, 122, 123, 128, 133, 139, 144, 145, 157, 158, 159]
0    133
1     34
Name: anomaly, dtype: int64