Project-1: Modelling an electric Car with Li-ion battery
Aim: To simulate the Simulink model to check the EV behaviour using basic blocks and to simulate the power train and Battery using a primary PI controller to check both accelerator and brake comments on the result.
Objective
- To simulate a report which will have a motor and its controller, we should not use any of the ready-made blocks and we need to build the entire system motor controller need to be done from the PI controller and from that we need to get the accelerator and brake commends.
- the battery we are using li-ion table-based battery.
- motor and controller we are using an Induction motor and controller with that.
- We are building the vehicle with a the parameters using the wheel and vehicle body
- And we take feedback from it to check results.
The model which we had modelled as per given question is
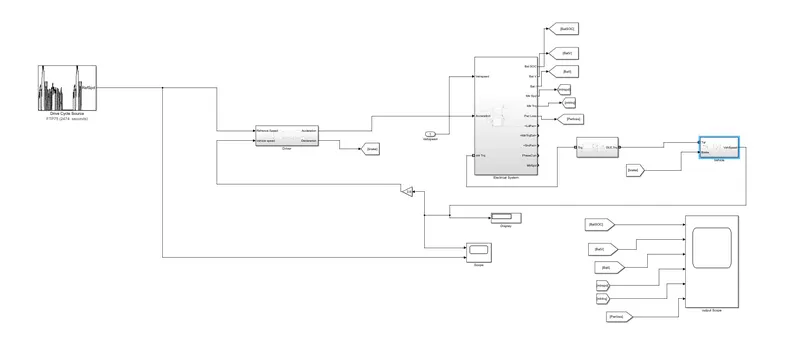
Fig1:Model which I had designed
It will have these components
- Drive cycle selector
- Driver
- The electrical block will have a battery and motor with its controller
- Torque with its units
- vehicle in that we have wheels and vehicle
- some scope to analyse the result
Let's see the Drive cycle in detail
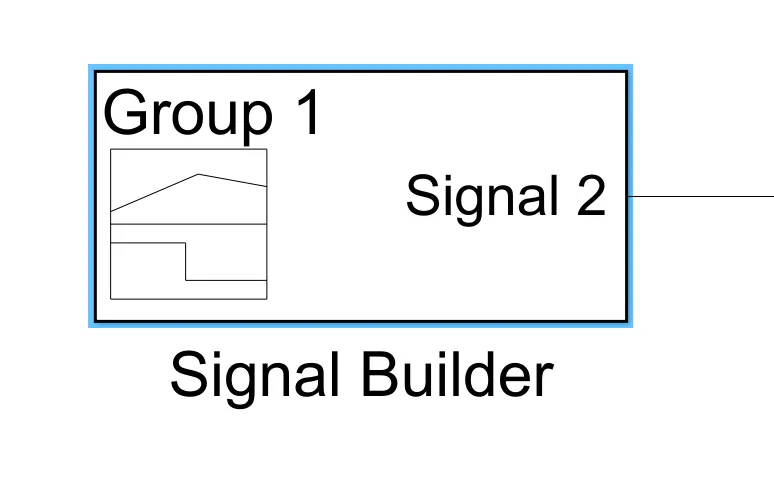
Fig2:Drive cycle configuration
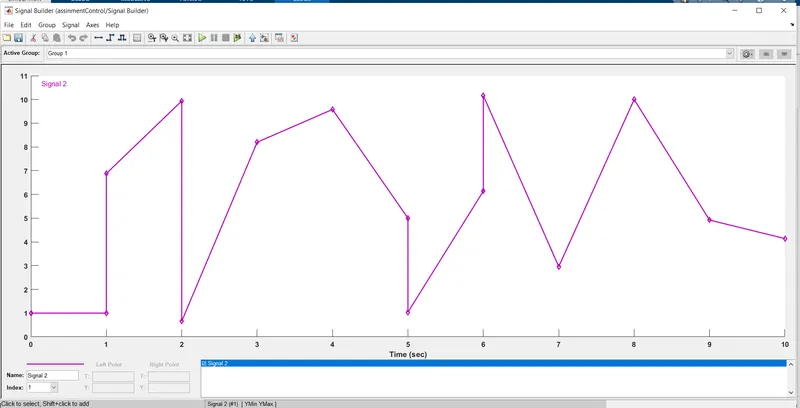
Fig3:FTP75 Drive Cycle
here FTP 75 is a drive cycle which is given by the American drive cycle
it is a standard set of velocity v/s time and this will be giving us an output which could be easily calibrated and analysed.
Driver
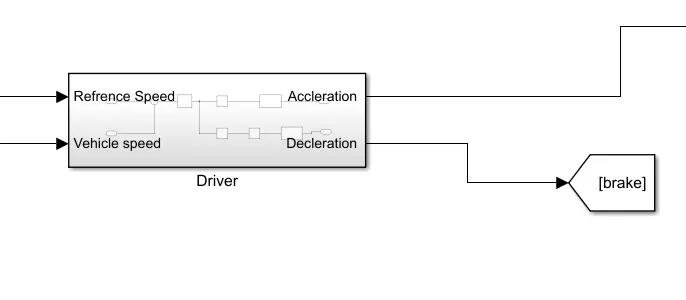
Fig4:-Driver output
here in the driver, we are going to provide Reference speed and we are going to get speed at the vehicle
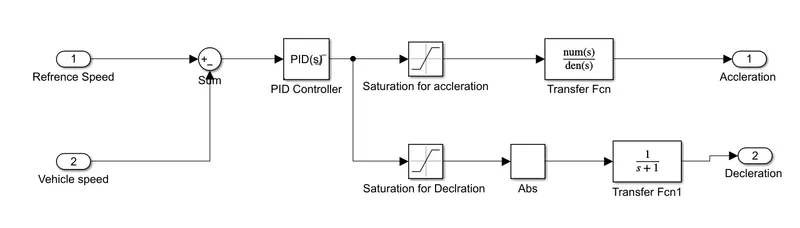
Fig5:-PI controller
Both speed and Vehicle speed can be subtracted from the reference speed
PID controller in which we had modelled the P=75 I=60
Then we had taken two Acceleration And declaration
Transfer function will be done as we are going to select the value by train and error
and acceleration we will be going to obtain
In declaration, we are going to use Absolut its comes in negative so we will be using Abs value
Then TF were selected.
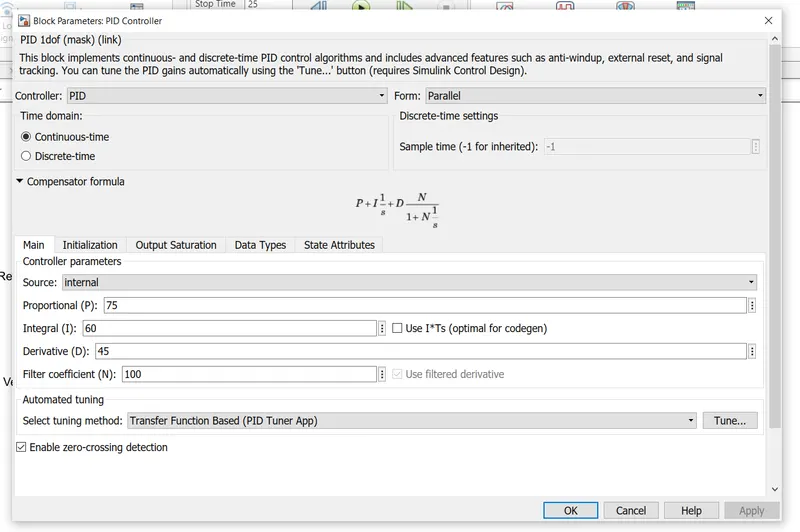
Fig6:-Pi controller
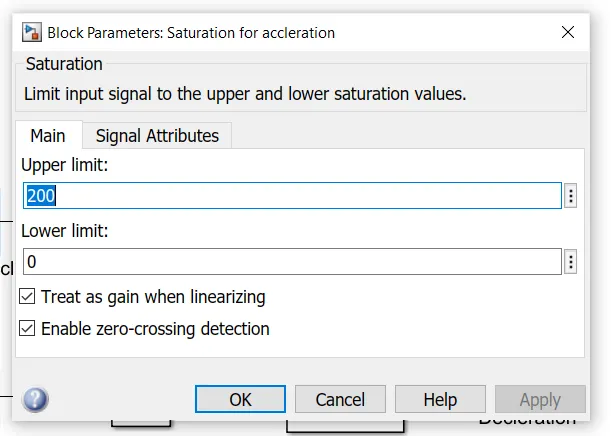
Fig7:-Acceleration block
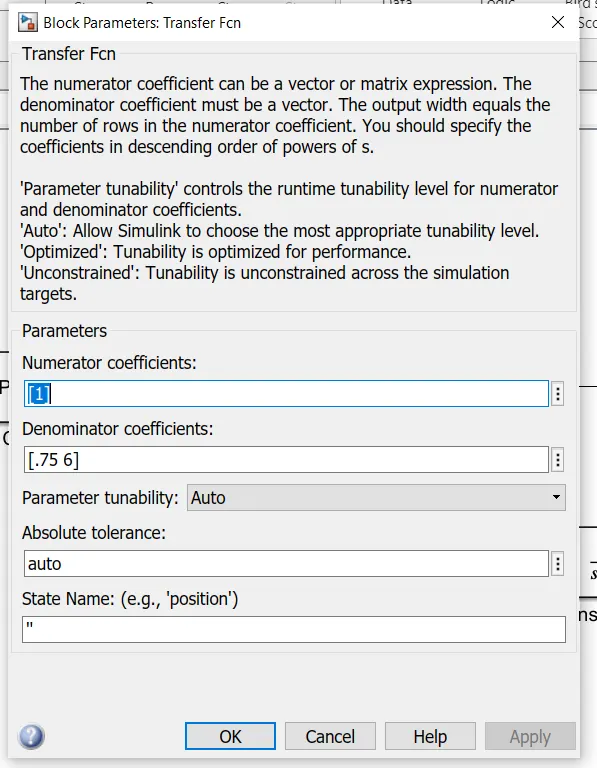
Fig8:-Aecccelration block
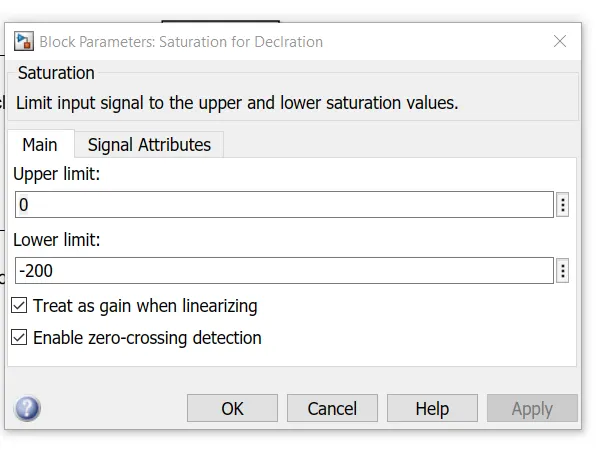
Fig9:-Deecccelration block
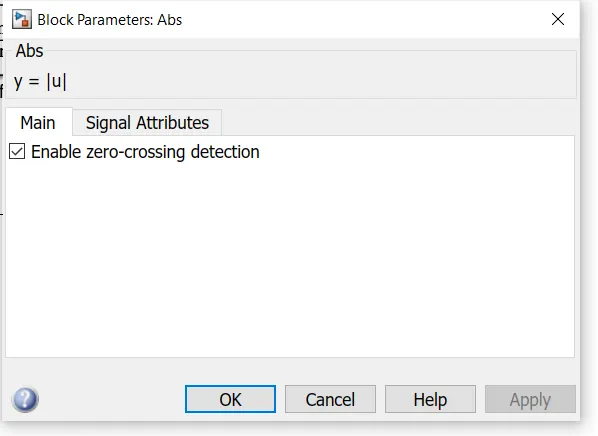
Fig10:-Absolute block
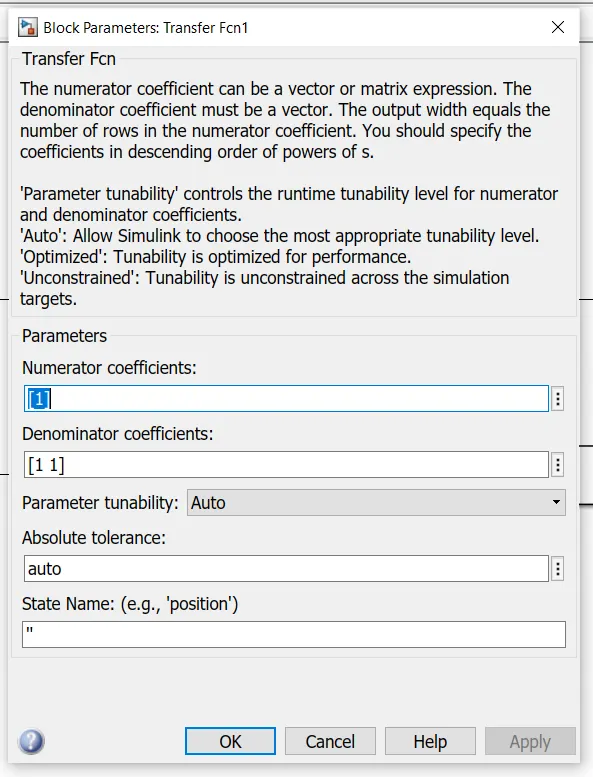
Fig11:-TF for Deaceleation
Electrical system
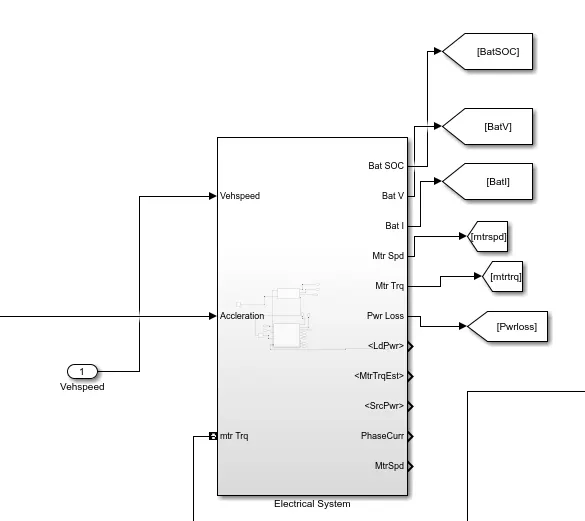
Fig 12:-Electrical system block
Here we can see the subblock by name of Electrical System and it will have 2 sub systems namely Battery and Motor and controller
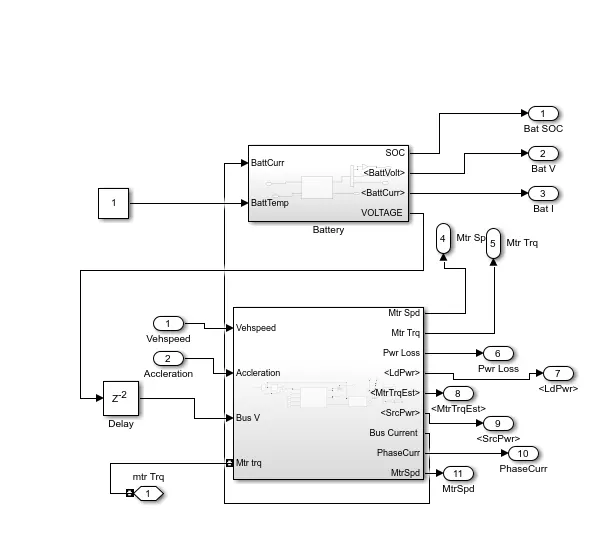
Fig13:-internal view Electrical block
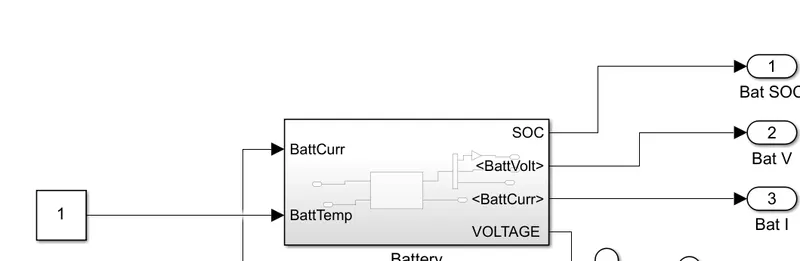
Fig14:-Battery block
Here this will show the battery sub block
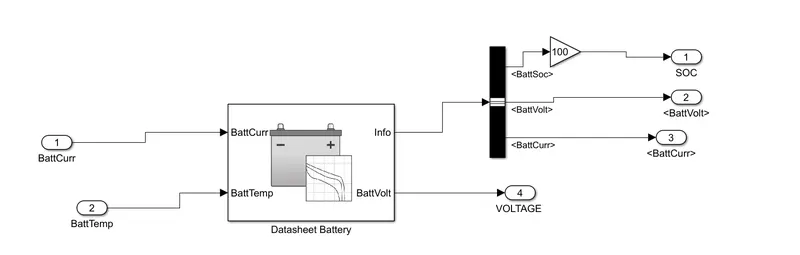
Fig15:-Battery component View
here we had took the Battery which is data sheet based and the data which we had entered will be given below
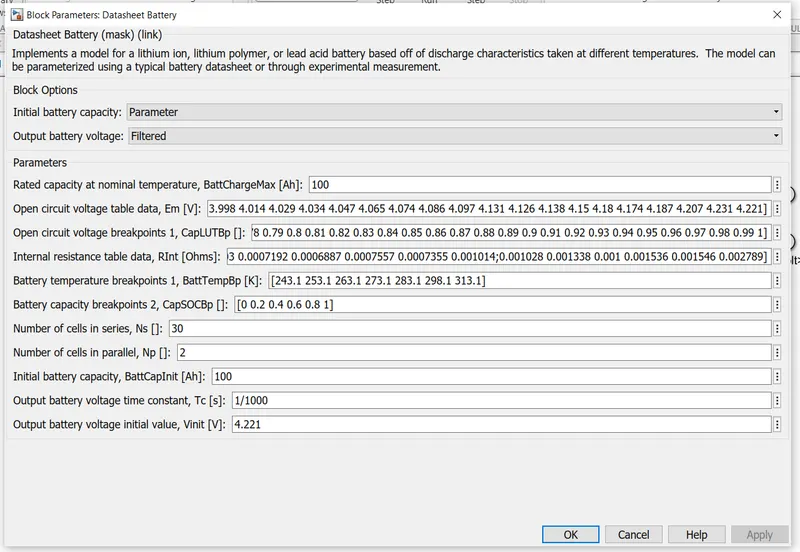
Fig 16:-Battery configuration
Ah-100Ah
V-12 V
Kwh-12Kwh
Np-2
Ns-30
here we wanted a 12V and 100 Ah
Charging is done at a 10 C rating which is 10 A per hour
When it comes to Discharge we don't know it depends upon the these condition
- Motor Voltage
- Load
- Up angle and Downangle
And another parameter
For discharge we had considered
but we know that maximum cell Capacity is 100AH
So for the design
Cells type:-Prismatic cells
Number of cells:-60
Np=2
Ns=30
cell V:-6V
Cell Ah Capacity:-100Ah
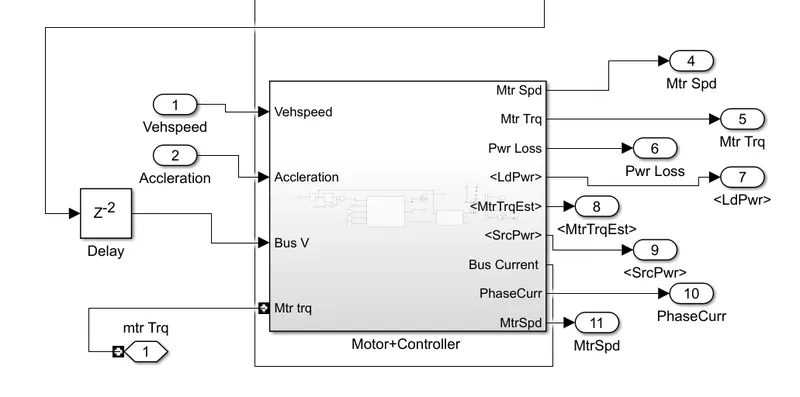
Fig17:-Motor +Controller Block
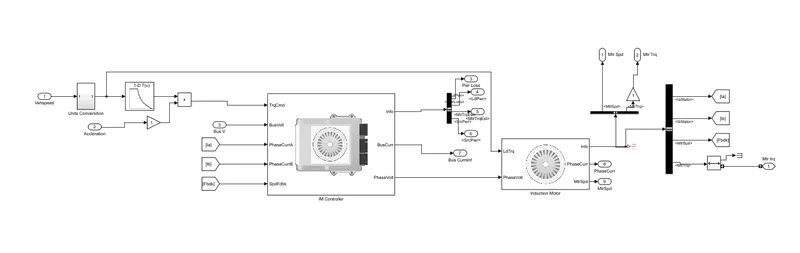
Fig 18:-inside view of motor +controller
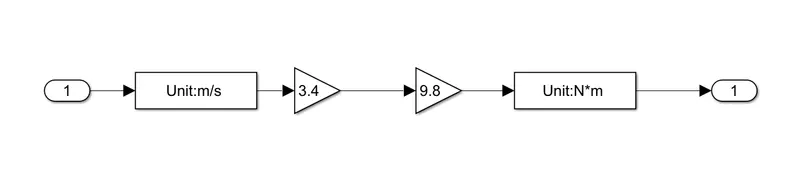
Fig19:-inside view of units conversation
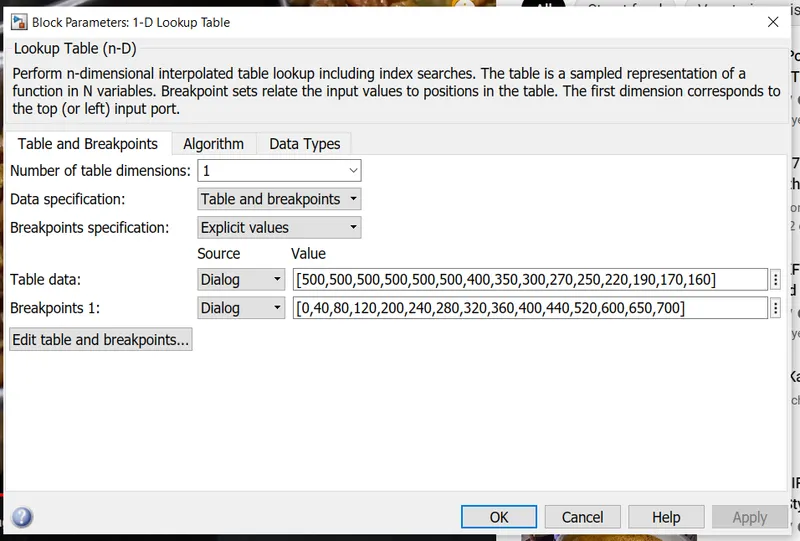
Fig20:-look up table view
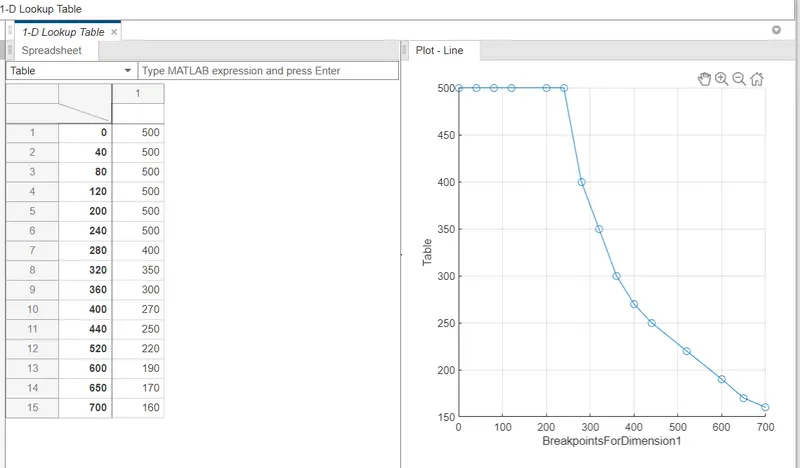
Fig 21:-Lookup Table data
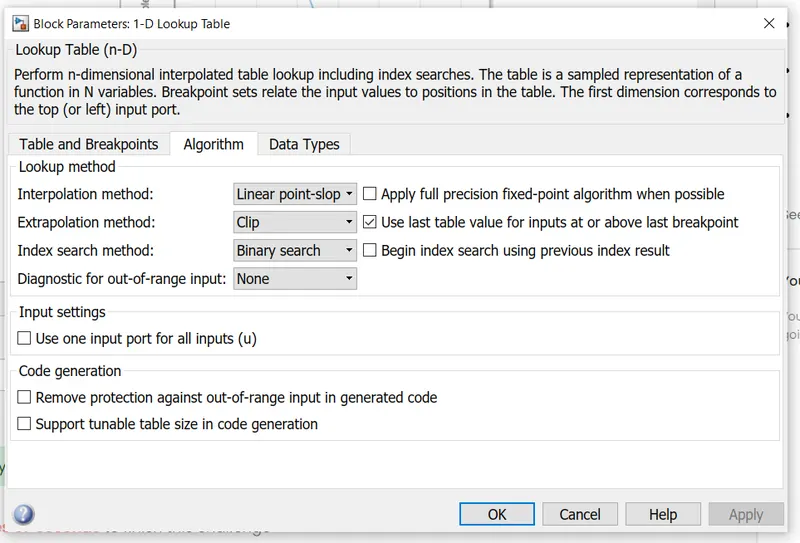
Fig 22:-look up the table
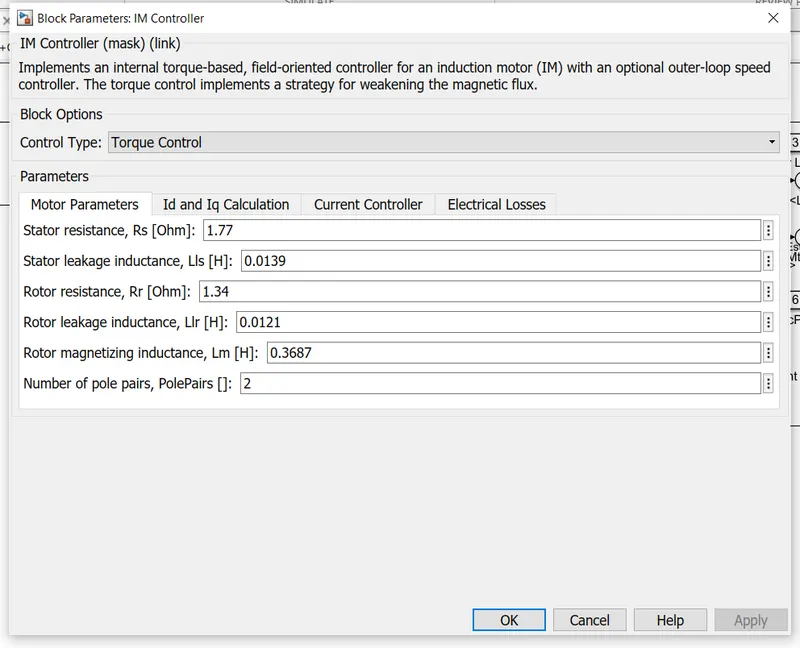
Fig23:-IM controller
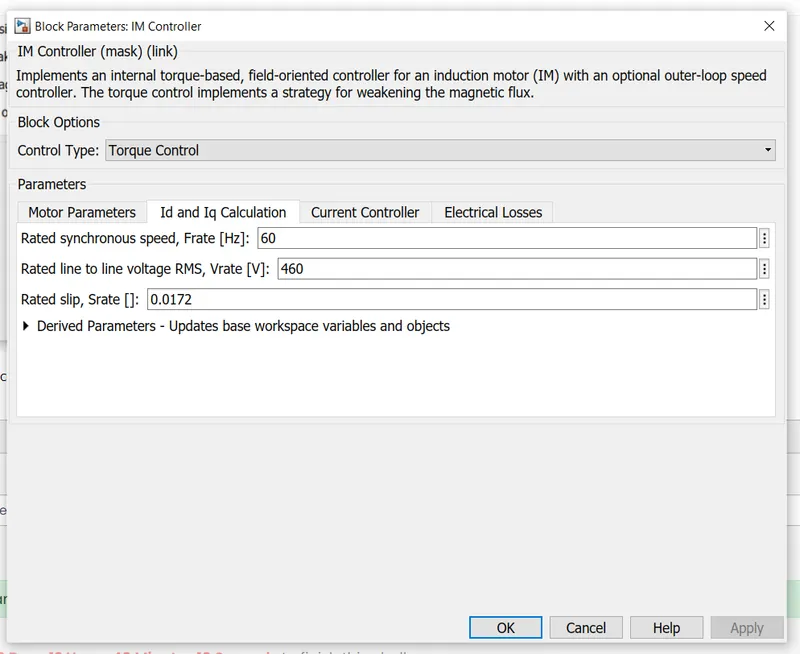
Fig 24:-Ip and Iq data
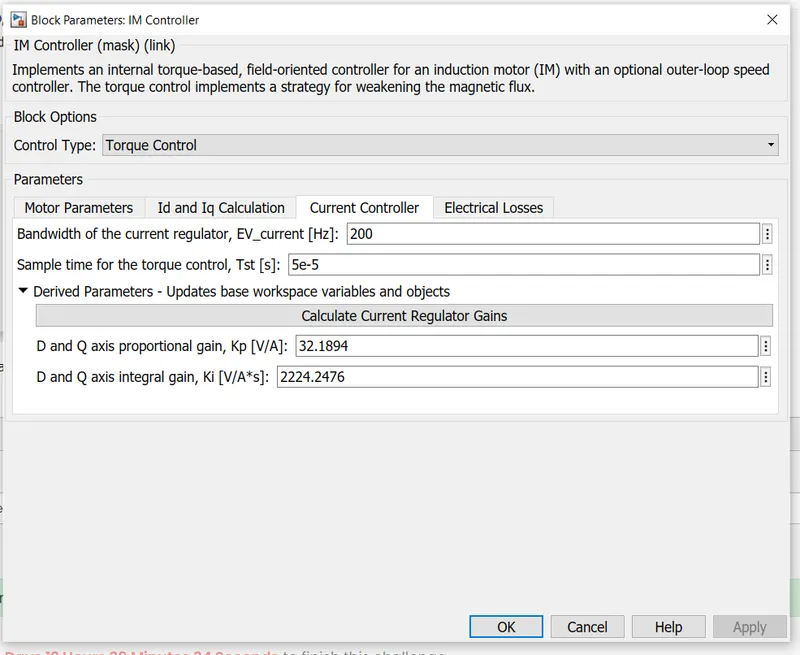
Fig25:-Current controller
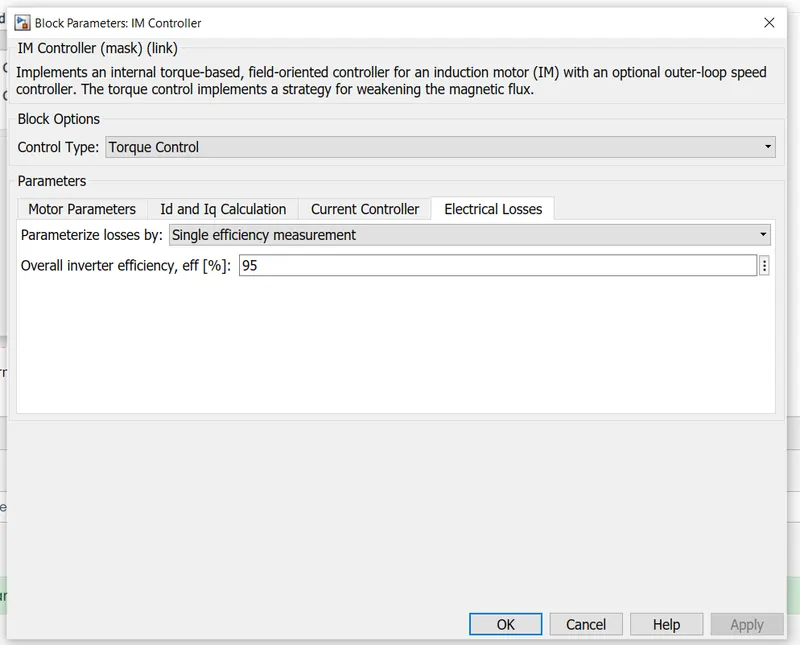
Fig26:-Electrical losses
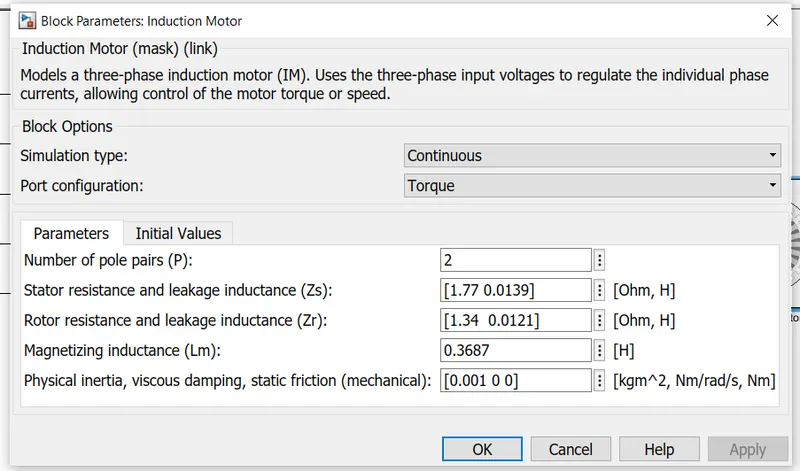
Fig27:-Motor parameter
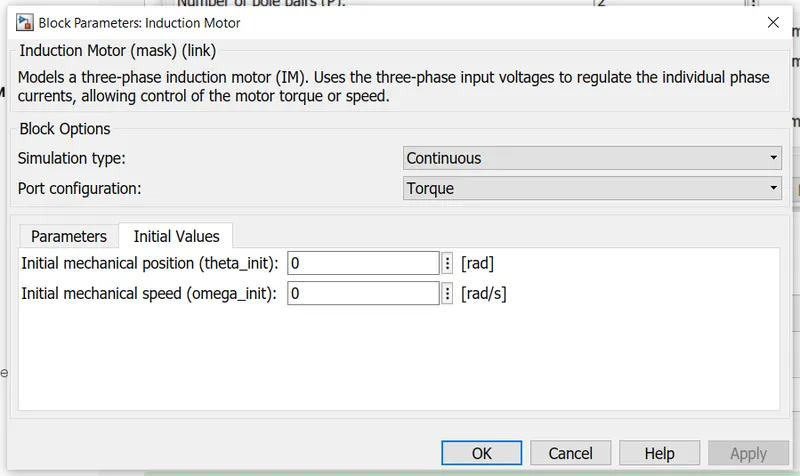
Fig28:-Initial Values we need to model both the motor and controller but first, we need to model the controller and then we can model the
controller, we need to model the units conversation because we are getting input in terms of k/s we need to convert it into N*m and we are done that as well
then we wanted to convert the torque and we used a block of the gain multiplier so we get that in our required data.
next is the 1-D dimensional Breapup Table here we need to take a lot of samples and we need to Break them into data and we had given the data which I had showed that in Fig 24
Before this, we had given input to the motor
Then we had modelled the motor With the above parameter
we had taken the motor controller Directly without changing any data in it.
https://in.mathworks.com/help/autoblks/ref/inductionmotor.html
and we had configurated as
Trq:-Torque
Bus voltage:-voltage input
Phase Current A:-Current in phase A
Phase Current B:-Current in phase B
Fedback:-Feedback voltage
Info: info like losses and output torque and all
Bus Current: Current at Bus
Phase Current:-Vector sum of all Current
So the output we are taking at phase current and torque
Motor
Torque:-This is torque by the controller
Phase Voltage:-Voltage input
Info:-lot of motor parameters like current, voltage speed and losses and all
Phase Current:-Current at phase
Mar Speed:-speed of motor
here we can write the equation as
`Ns=120*Pdiv F`
N=speed
p=ploes
F=Frequency
in the info, we had taken a bus multiplier and output was connected to various parameter
this will be input to the Motor and the motor will current and voltage
So here real conversation will happen and mechanical parameters will be converted into electrical parameters and
a lot of other we can get in motor loos and all were shown
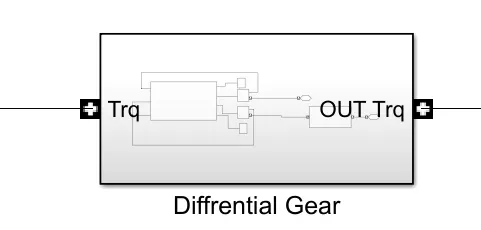
Fig29:Diffrential Gear
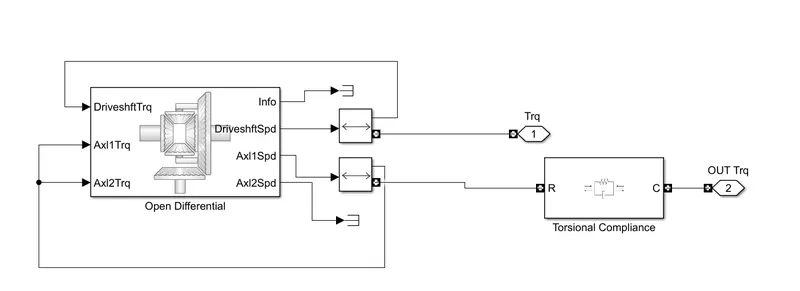
Fig30:differential
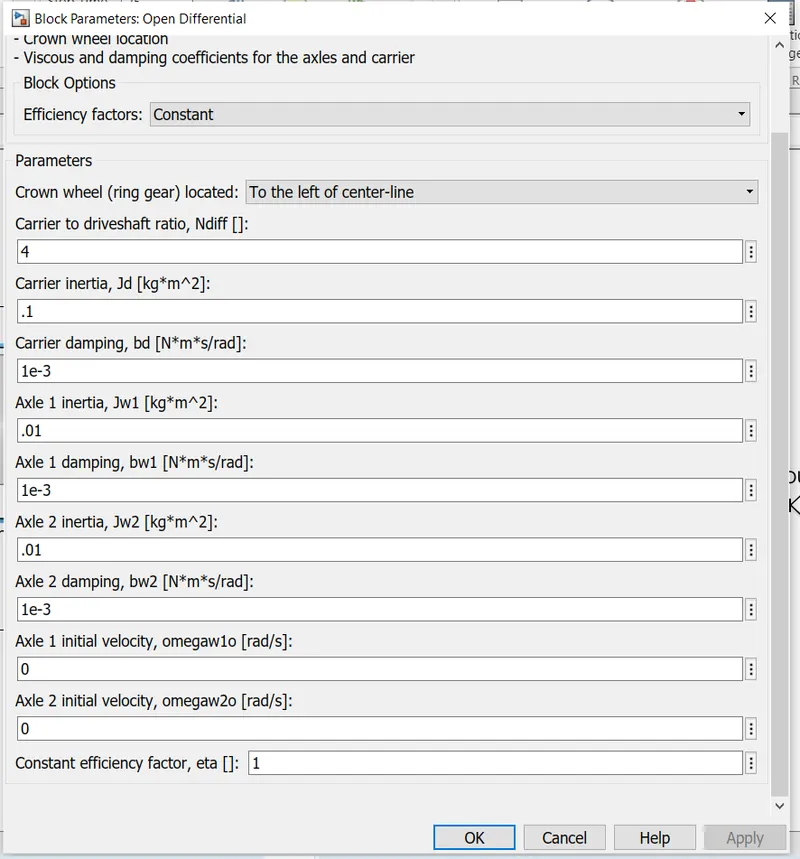
Fig31:-differential gear
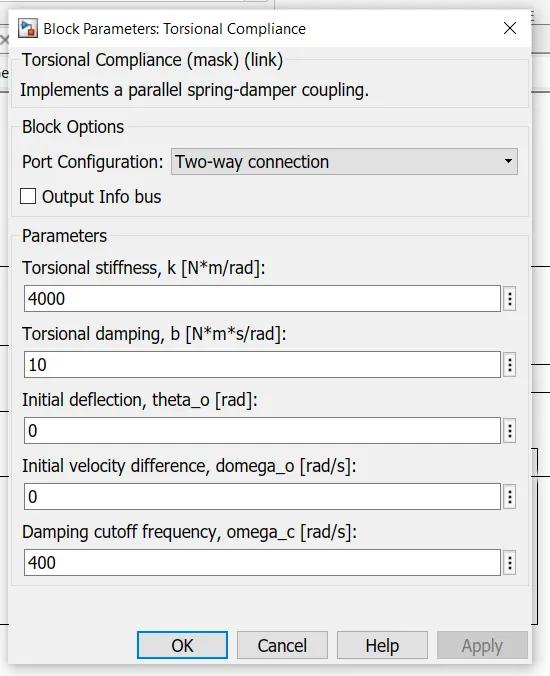
Fig32:-Torsional Complence
Here the block will have this parameter are
Drive shaft Trq:-this will show us the speed of the torque
Axl 1 Trq:-here we are going to connect the axel 1 torque
Axl2 Trq:-here we are going to connect the axel 2 torque
Axl 1 Spd:-here we are going to connect the axel 1 Speed
Axl 2 Spd:-here we are going to connect the axel 2 Speed
Info:-this will give information regarding speed and toqrue
Speed:-This will give us relative speed
here we had connected short between speed and torque
and the same thing we had done with axel as well
but from this block, we had taken output as torque
and this we had given input to the tortilla compliance as well.
output of this we had taken from go to block
here the all of these values will be default only we had not made configuration
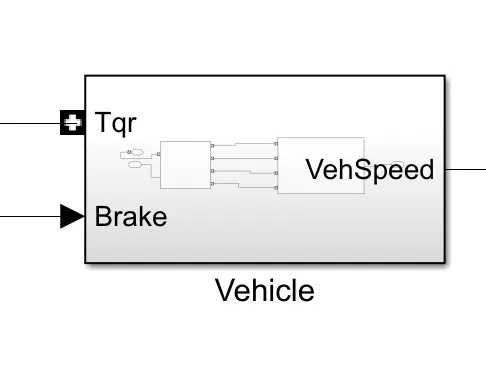
Fig33:-Vehicle
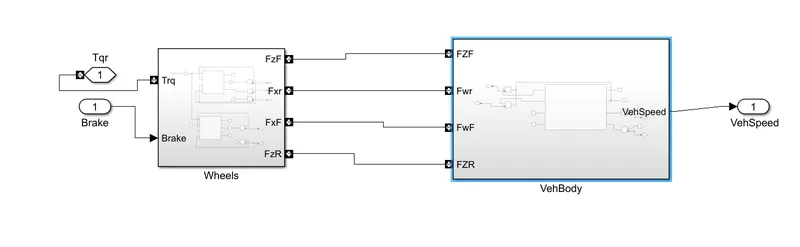
Fig34:-vehicle block
here this will have 2 block namely Wheels and Body of vehicle
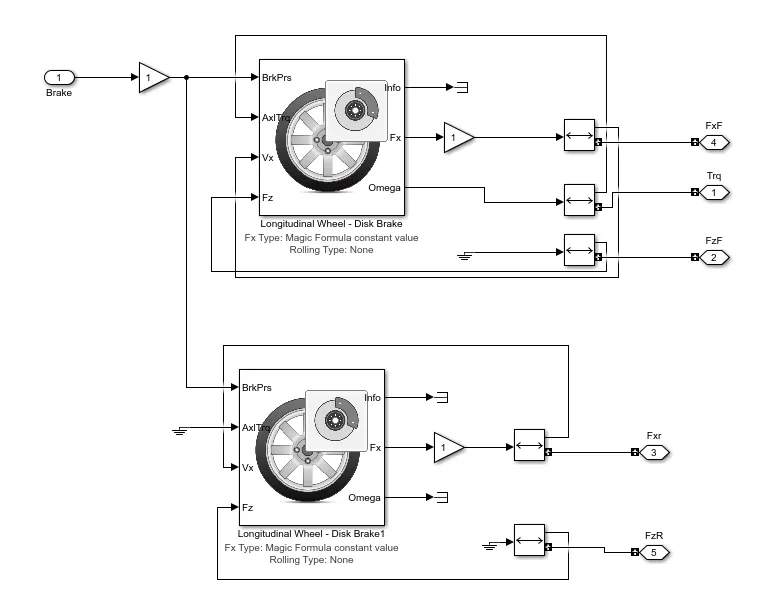
Fig35:wheel
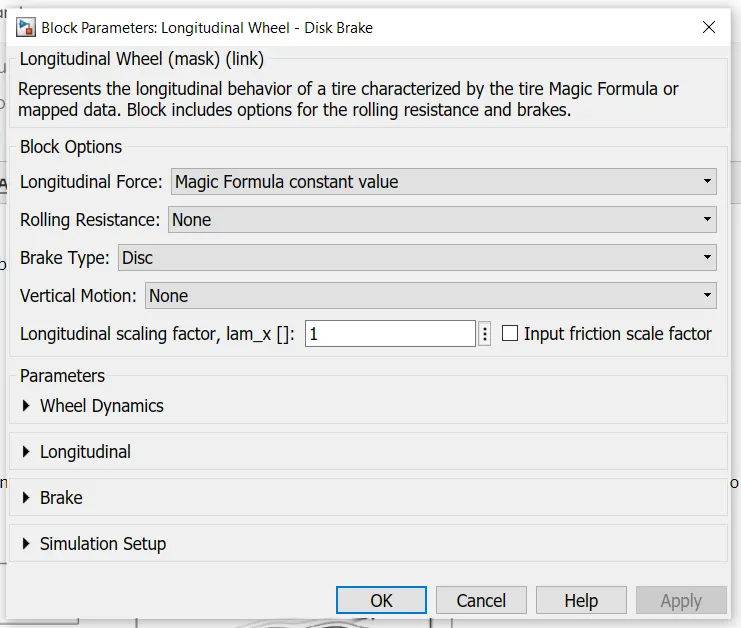
Fig36:wheel model
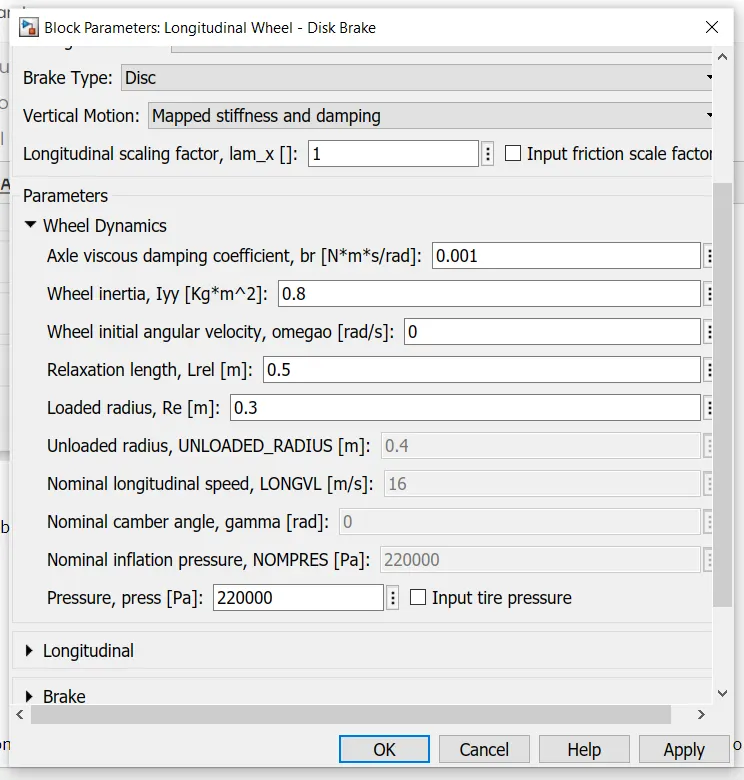
Fig37:wheel model
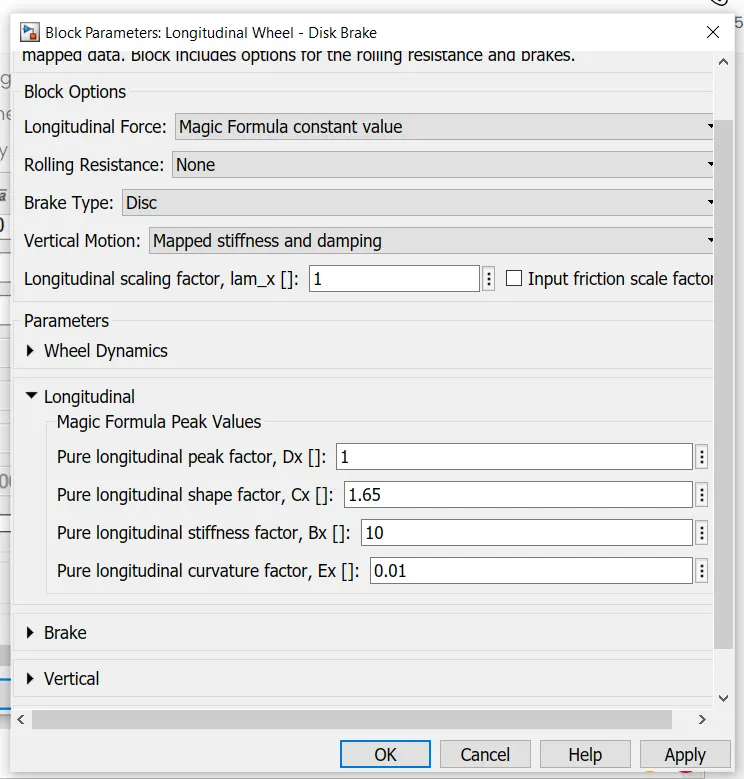
Fig38:wheel model
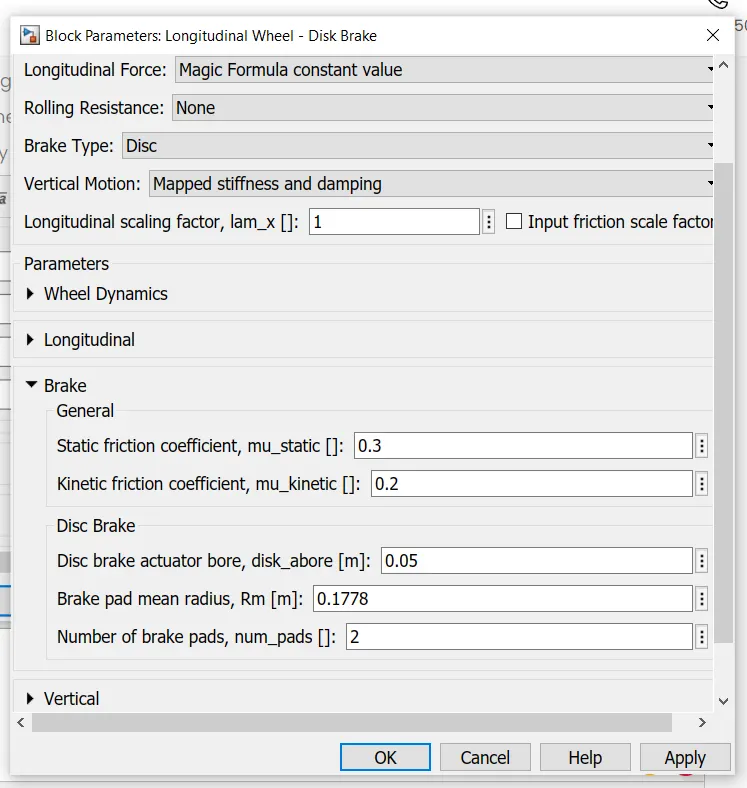
Fig39:wheel model
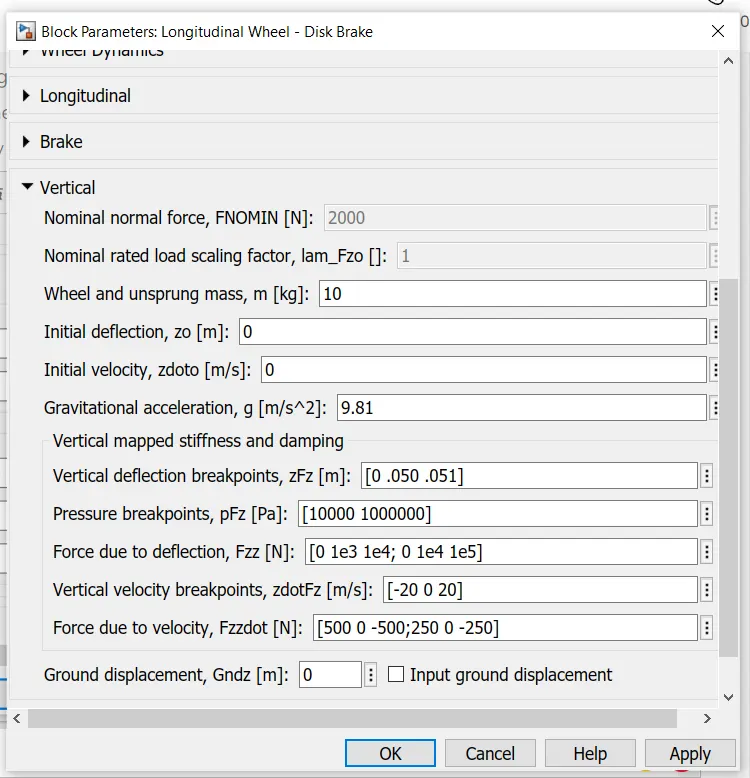
Fig40:wheel model
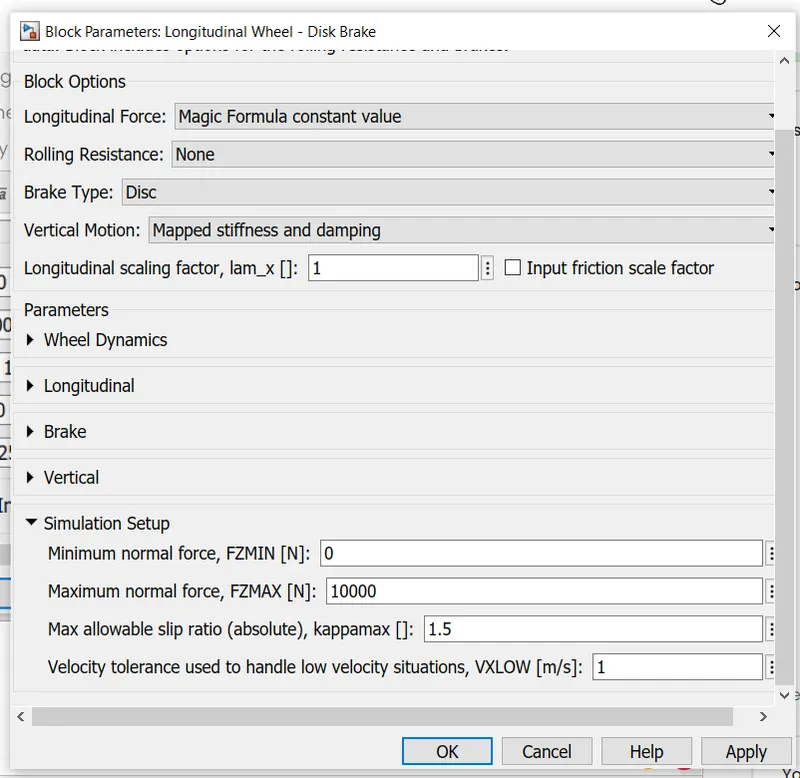
Fig41:wheel model
We have Brk Prs:-these are brake pad
Axl Trq:-Axle torque
Vx:-velocity of wheels
Fz:-Reverse of wheels
inf:-information
Fx:-forward velocity
now here we are going to connect 3 terminals except brk pad to the two terminal end pads and we are going to get go to block from there we had taken the output
here these all values are default values and we won't change any values
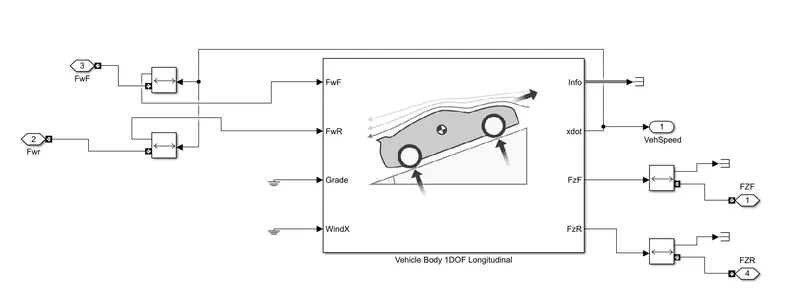
Fig42:Vehicle body
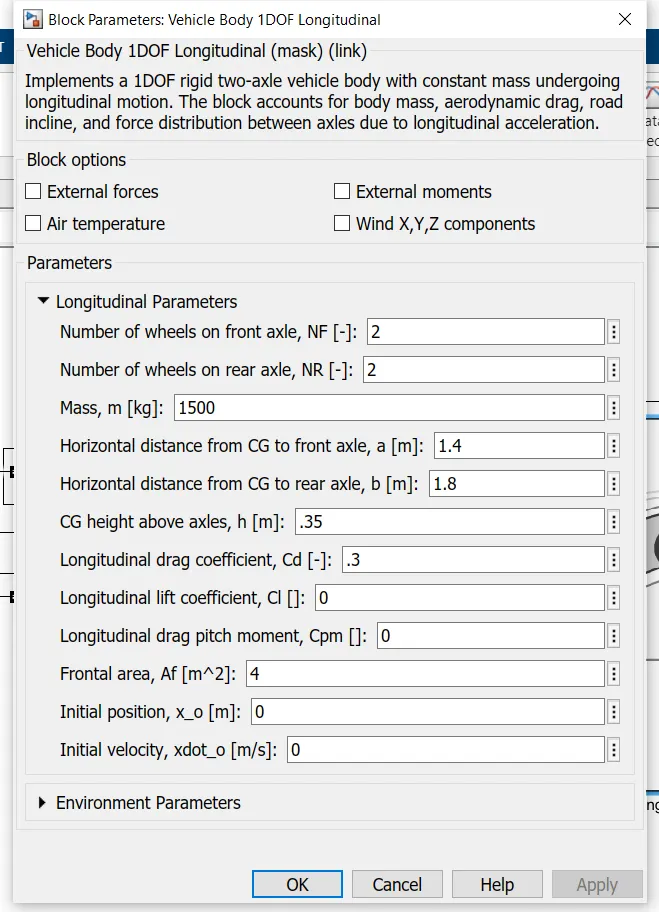
Fig43:Vehicle body configuration
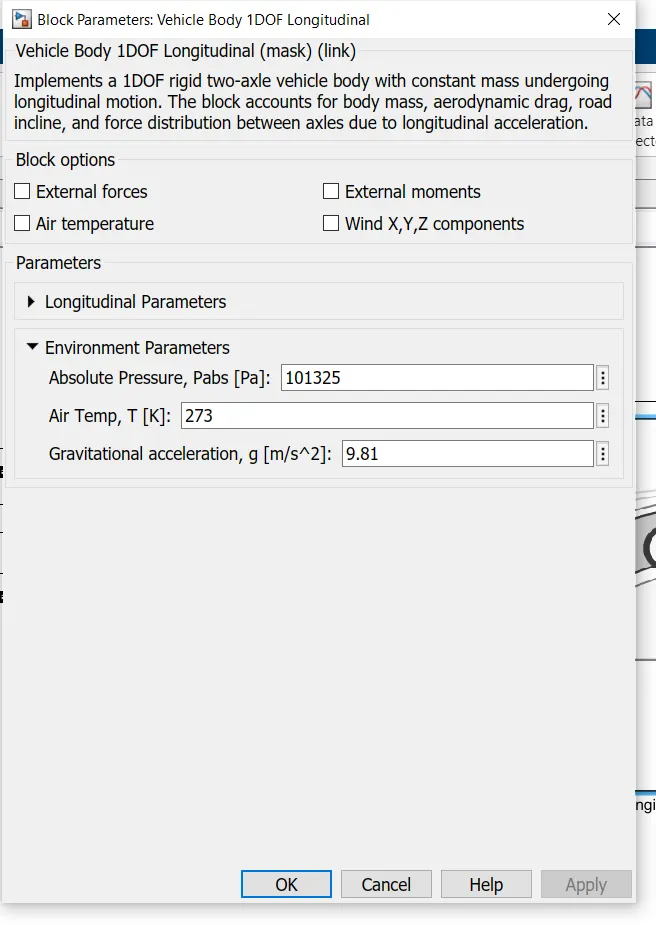
Fig44:Vehicle body configuration
Here is the previous output we had given input to this bock and the major thing here is we just want to know the vehicle speed and we wanted to feed back the same thing to the 1 scope.
Result
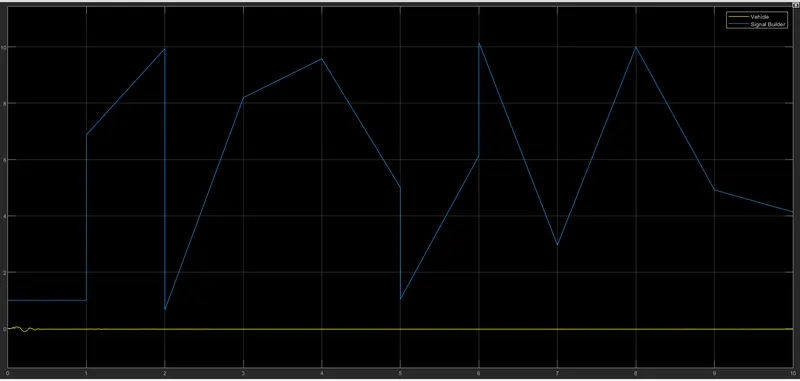
Fig45:input and feedback from Result
now here we can see that the first one is in blue colour that is the input signal which we had provided and we can see that it will match with the input waveform. And in the yellow colour is feedback wave from and we can see that very few variation and the vehicle won't respond because of various reason. it a good sign.
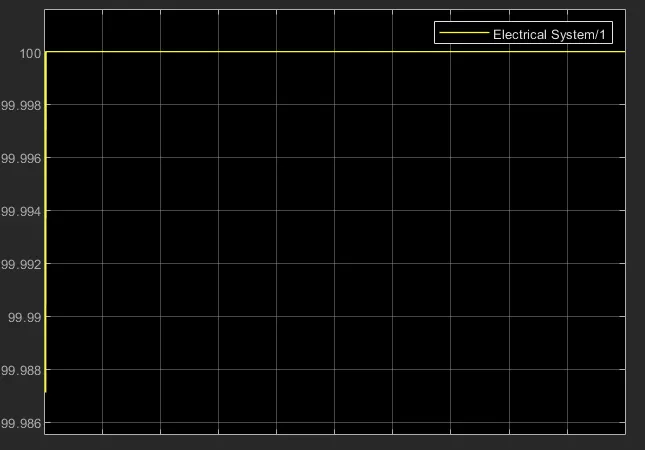
Fig46:Scope output from SOC
The above graph will show us the variation of SOC with respect to time. And we had done the simulation for 10 seconds so that we may not see the much vacation in the graph and all. The initial dip will be transient from stop to movement but after a certain amount of time that will be zero itself.
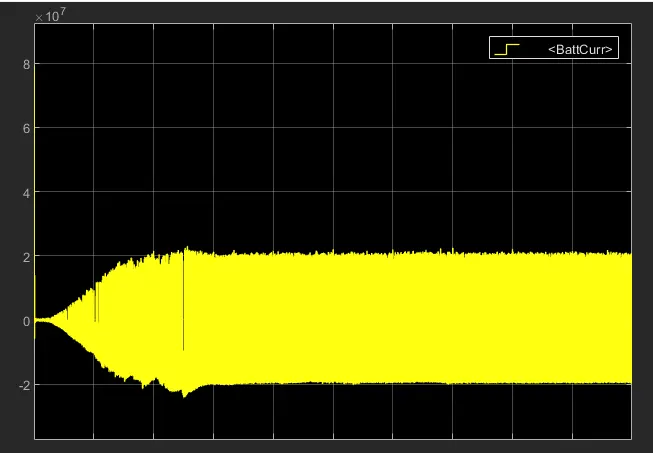
Fig47:Scope output from battery output
Here we can see that the Battery current versus time here we can see a lot of spikes will be having and we can accept the variation as if the vehicle will be able to move and it won't be a constant graph. And the variation will be from +2 to -2 V.And when the vehicle will be able to move then it will rise to the maximum value.
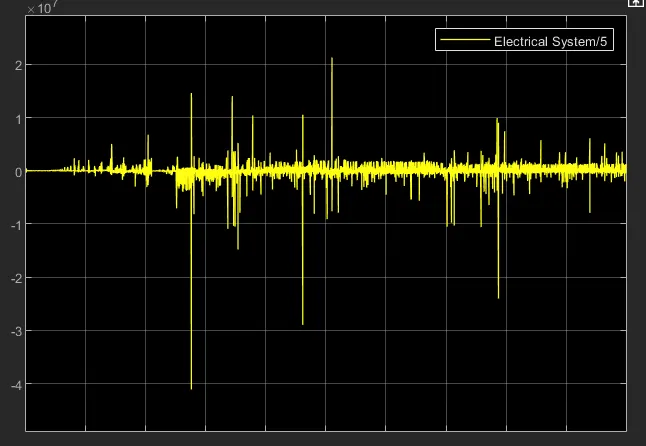
Fig47:Scope output from battery output
Here we can see that the current versus time here we can see a lot of spikes will be having and we can accept the variation as if the vehicle will be able to move and it won't be a constant graph. And the variation will be from +2 to -4 V.reason is this one of the currents and this will give the behaviour of the battery.
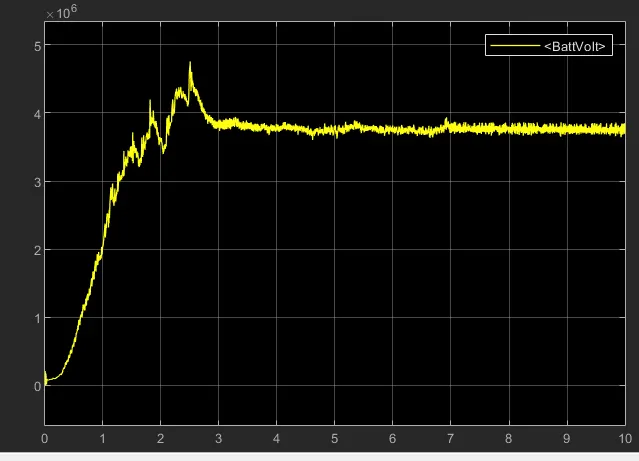
Fig48:Scope output from battery voltage
The above graph will show us the Voltage drawn by the battery and it will start from zero and then it will reach the maximum value and it will retain its value
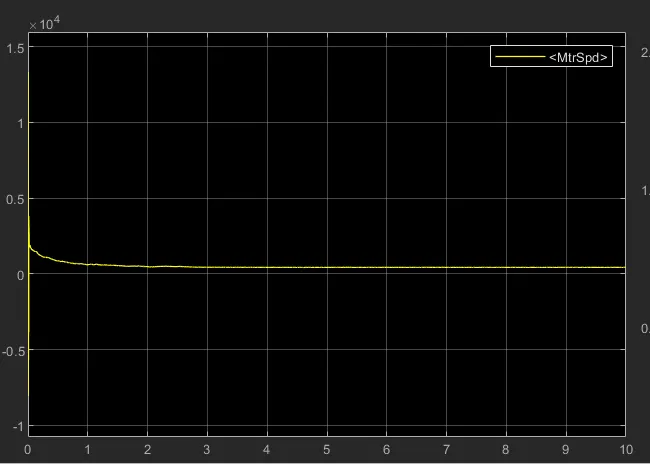
Fig49:Scope output from motor Speed
motor Speed v/s time is shown in the above graph .Here we can see the variation is maximum when we are going to stat the motor so after wards it will constant speed which is equal to in between 0 to 1.
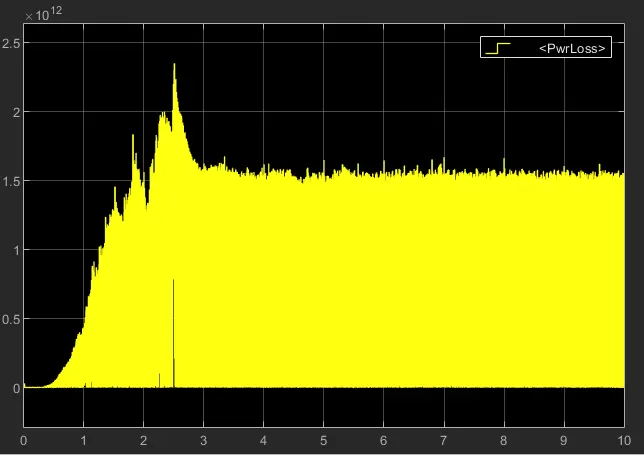
Fig50:Scope output from power loss
losses will be shown and here we don't have any other parameter and all like this and here it will losses will be there once the motor will start to rotate. So we can conclude that losses will be more in any motor.