Project
Aim:-prepare the report on BAJAJ all-terrain vehicle and to
- Explain the various components present in it.
- Explaining all components and their subsection present in it.
- looking into performance parameter and analysing the result.
- Looking at performance and commenting on results.
Description:-
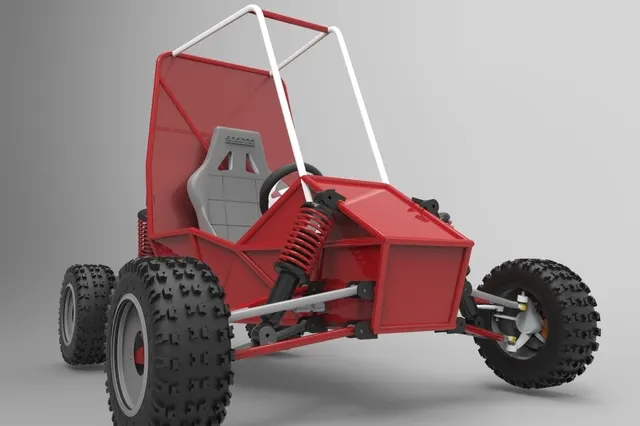
Fig 1:Bajaj all-terrain vehicle[Credits: Skill Lync]
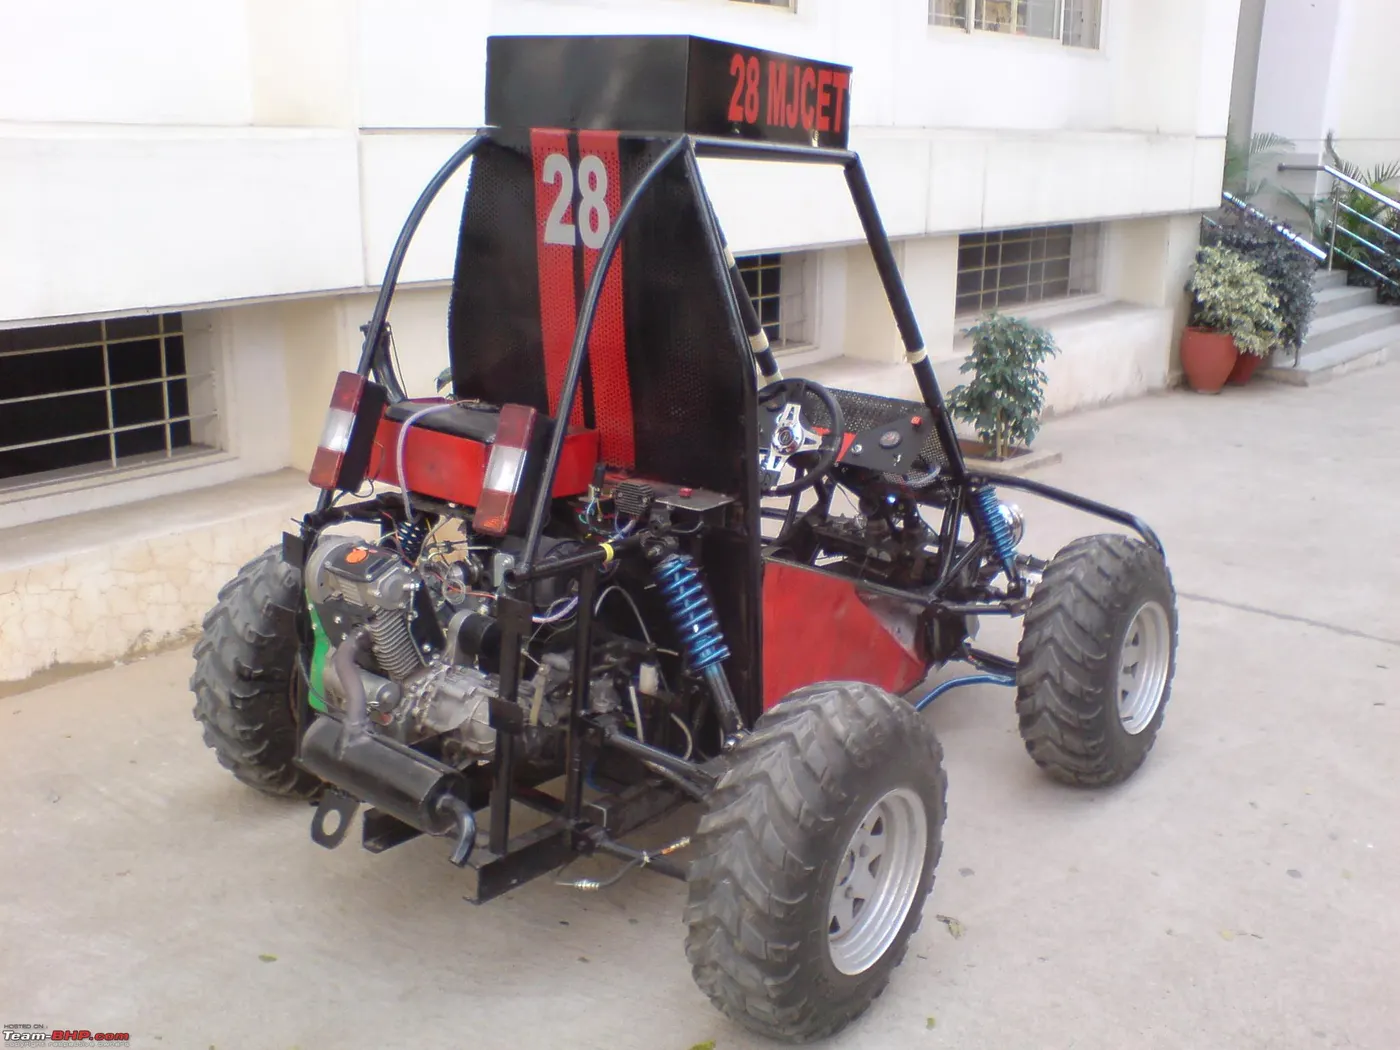
Fig 2:Bajaj all-terrain vehicle [Credits: Team BHP.com]
by name only it's an all-terrain vehicle and we can drive this vehicle in all trains and this will sustain all types of terrain like up climbing down climbing, off-roading mounting.
And it has for CVT(Convtisly variable transmission)and how does it has varied is explained below.
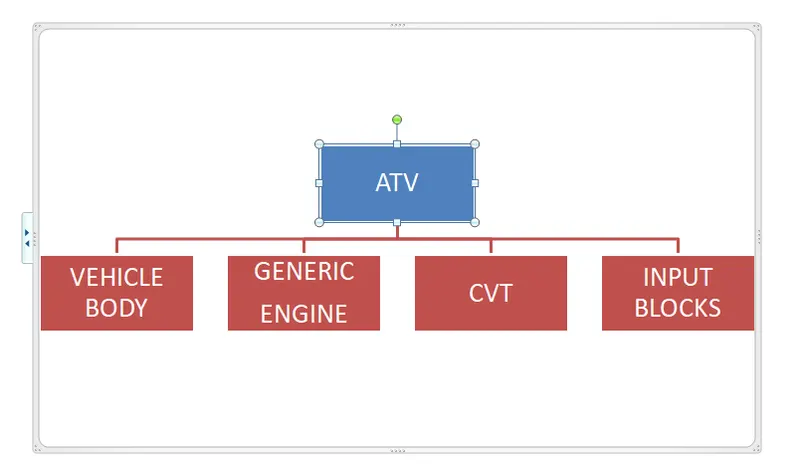
Fig 3:Flow chart of components on AVT
- Vehicle body:-In the real body it's made up of steel structure and its a lightweight and it can be very easy to handle.
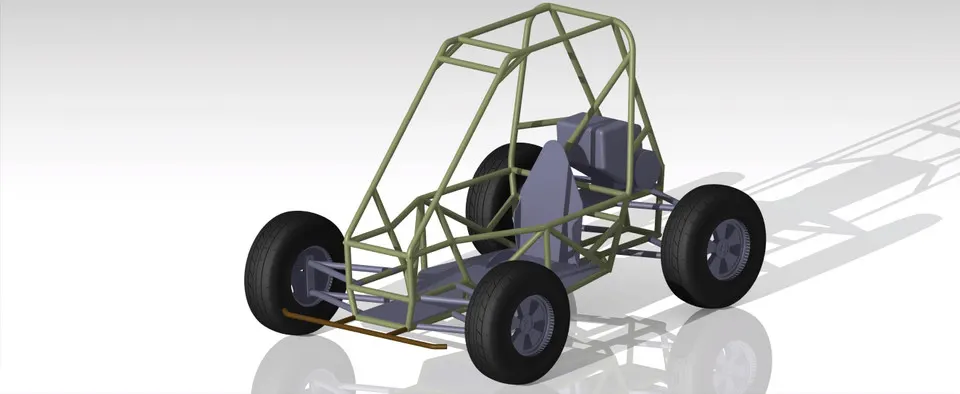
Fig4:Steel structure od ATV[credits:-Gradcad]
in the Above figure, the green colour will show the steel structure.
- Generic engine:-Its an engine which will be made up of either petrol or diesel engine.it's usually a 4 stroke engine
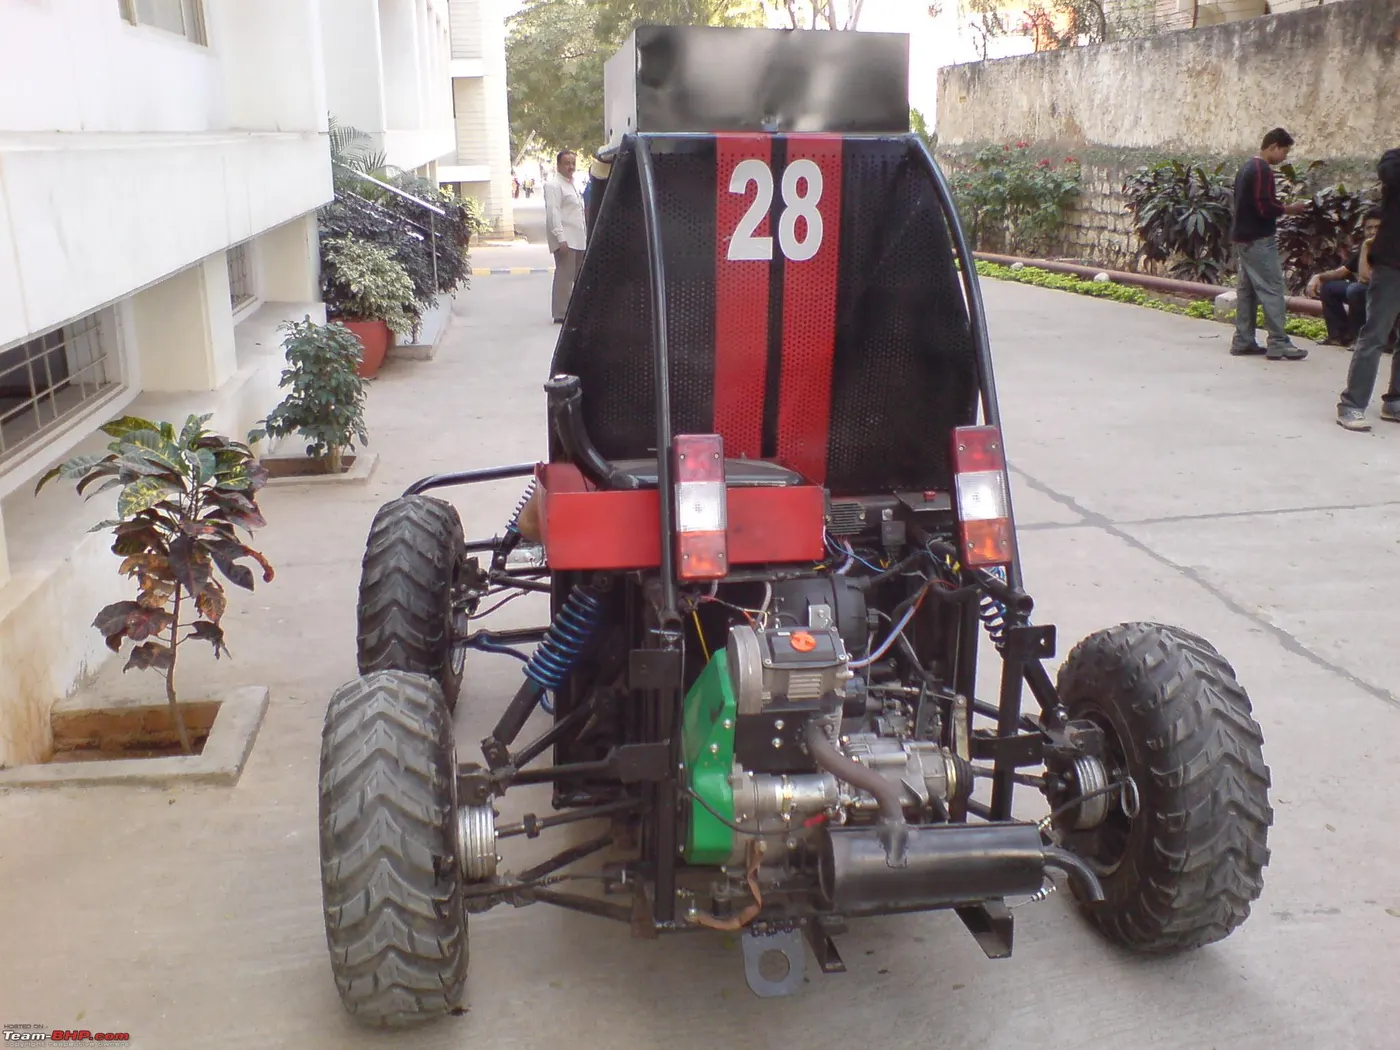
Fig5:-Engine of ATV [credits: team BHP.com]
CVT:-Its a type of gear by which output speed will remain the same by chaining gear of both systems.
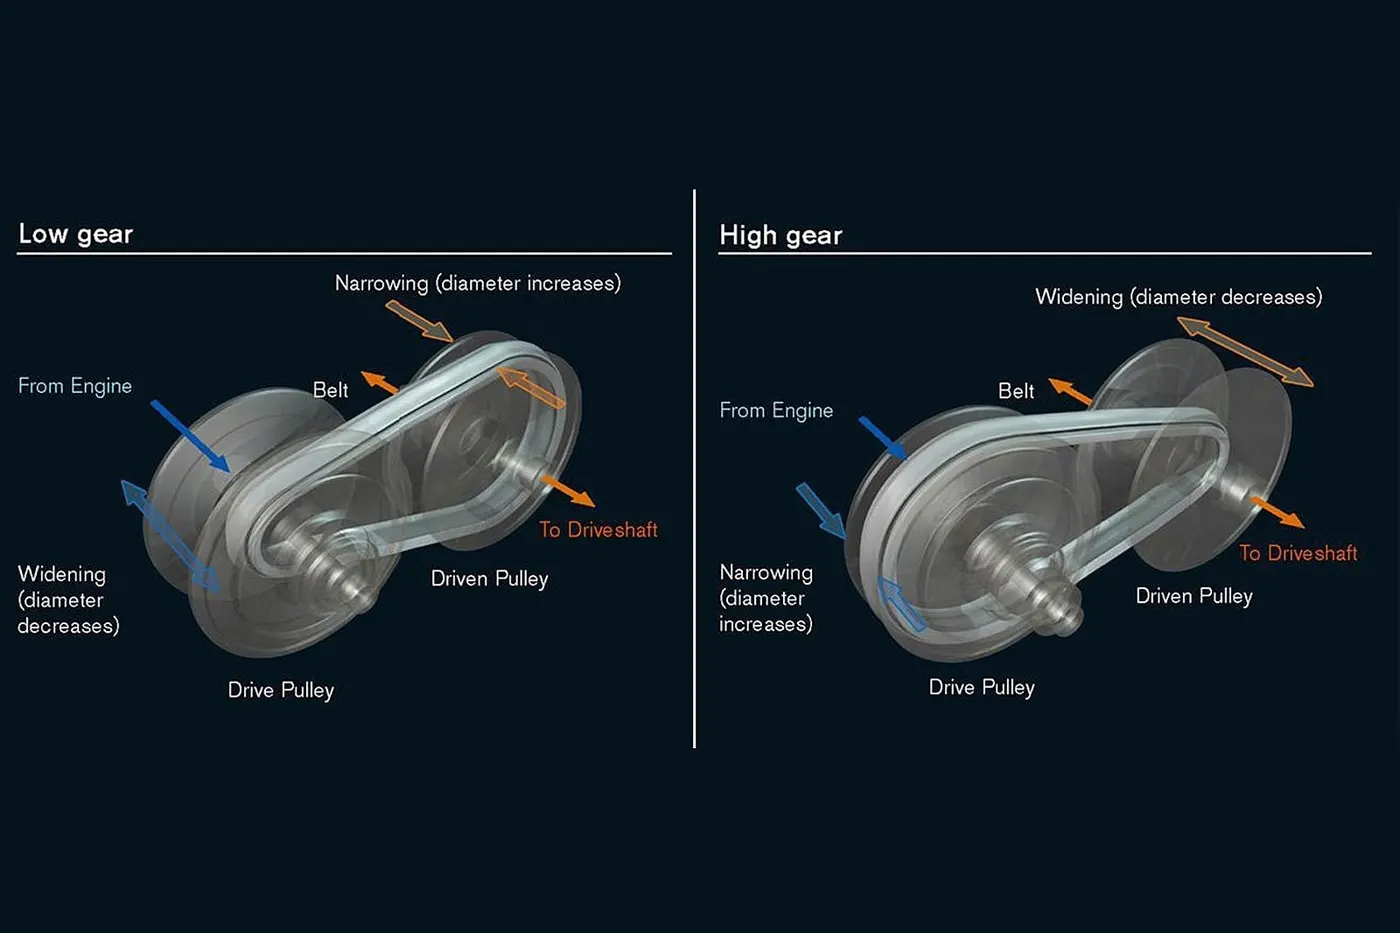
Fig6:-AVT Gear Box [credits:-Edmunds]
- Input blocks:-Here input can be given by 2 parameters like throttle and brake
Throttle is main part of engine.And its only way of getting acceleration and is shown below.
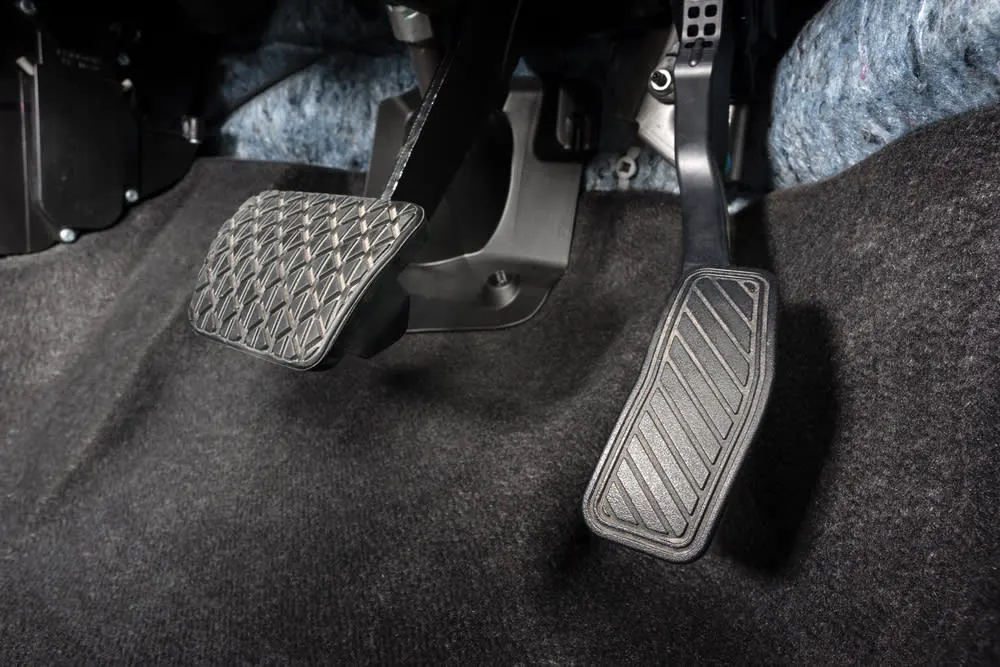
Fig7:-Throttle and brake value[Cerdits: How does it work]
And braking is another unit and can be applied to stop the engine.
it has some other parts like tyre and suspension and all.
This is all that is a real ATV. But here we are going to simulate all of these things in Simulink.It is a ready model movable in Simulink and is shown below
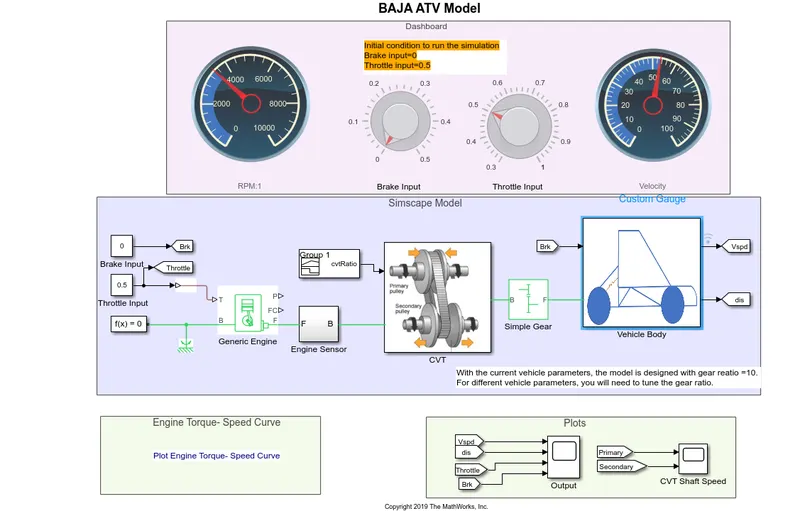
Fig 8:-Entire model of bajaj ATV vehicle
It can be seen that the entire mathematical model and can be separated into various phases.
first, it has an engine and it has some pats ad can be shown in the below figure
it has 2 inputs and T is throttle and B and P rotational parts and FC and P are two physical output terminals.
output F is converted to engine sensor and is shown below inside of subsystem of Engine Sensor
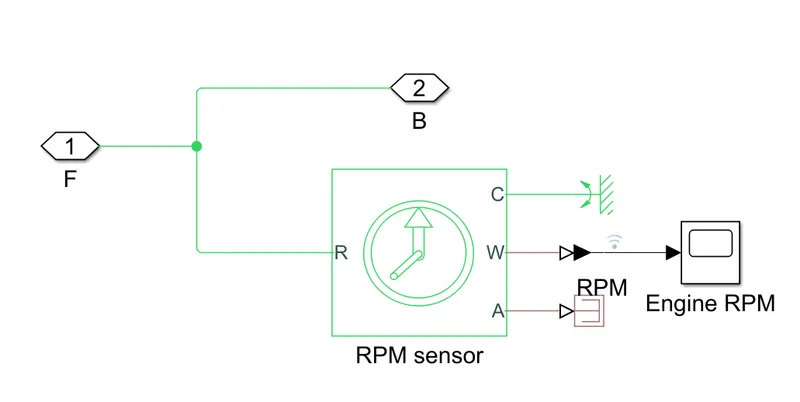
Fig 9:Speed sensor subsystem block view.
it has 2 systems and these two systems one is engine RPM sensor and output has been given to the w is angular velocity is given to the scope and A is angle is terminated from here.
C is grounded to get more velocity.
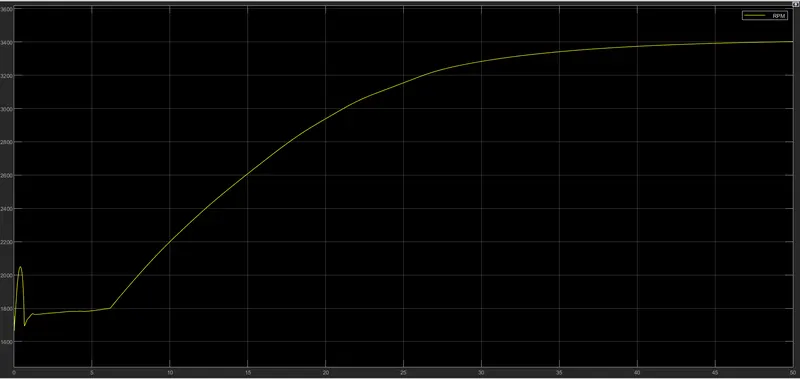
Fig 10:RPM graph with throttle 1 and brake 0
Output is connected to CVT and this is block by which will change the gear and output will remain constant means speed will remain same.is explained below in figure
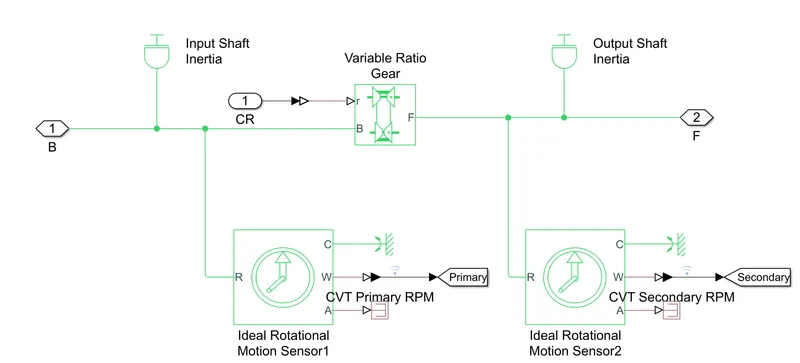
Fig 11:CVT submodel with all parameters in detail
It has for throttle and output has been given for and in the input hs been given from block and this is throttle and some inertia has been given for a gear to run. Then output has been given for ideal Rotational motion sensor input has been for R which is rotational energy.
But the input is been given for B which base and output are taken at the follower and to rotate some inertia is given and value has been taken from f which is output .same all of the things are given for secondary everything remains same. For logging, we need to take both the primary side and secondary side.
Then a simple gearbox has been provided to improve speed and torque.
This output has been given input given as input for the body.
Engine Block
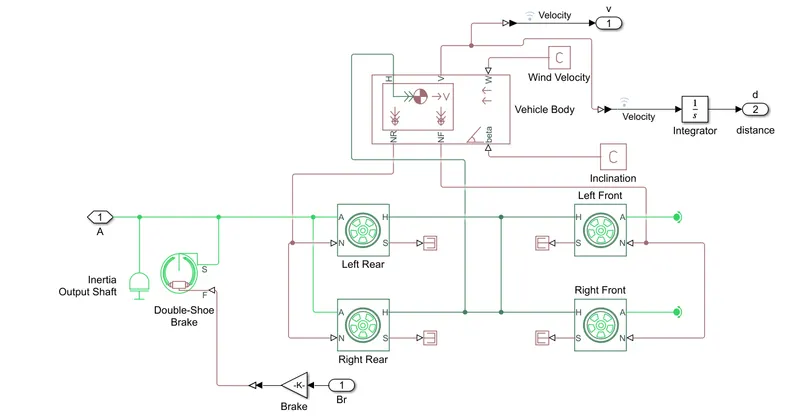
Fig 12:Engine part enlarged
Input has been given from throttle and inertia is been given and double Shoe Brake and another in our is given from brake.
From A output has been given for rear wheels for block A.for N input has been given from engine output. H input of both rear and front wheel are coupled together. And s is Terminated to PS terminator.NF is a port which in output needs to be connected with N.H is H is the common ground point. V is velocity point and W is the point where wind velocity is connected.
other inputs were brake.
outputs are V and Display were output.
But we need to take some data so data is taken by Torque speed characters.
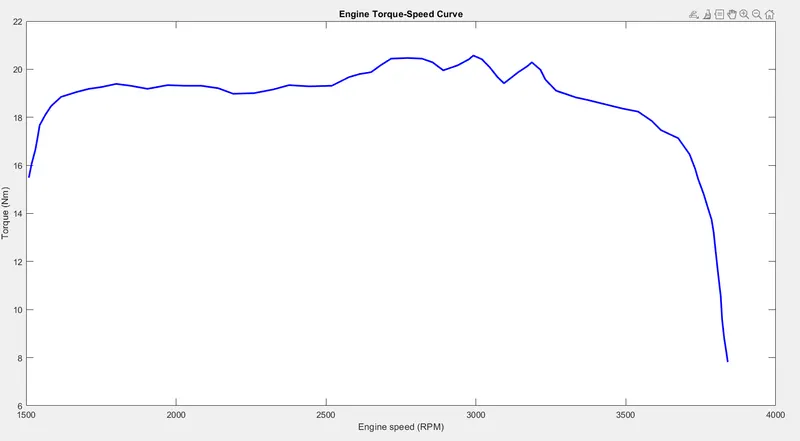
Fig 13:Speed torque curve for an ATV
And data we need to extract from this to give input to our model.
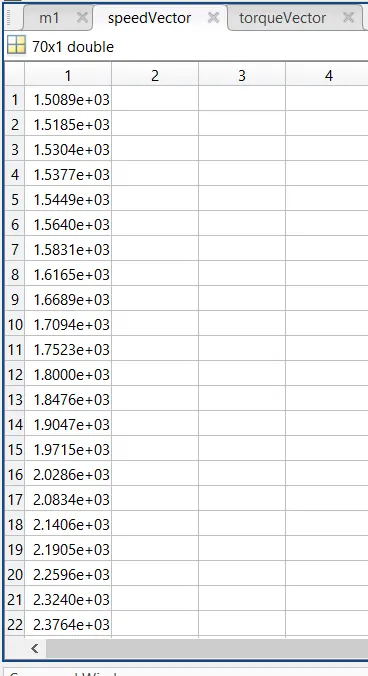
Fig 14:Speed value data which was extracted from the graph.
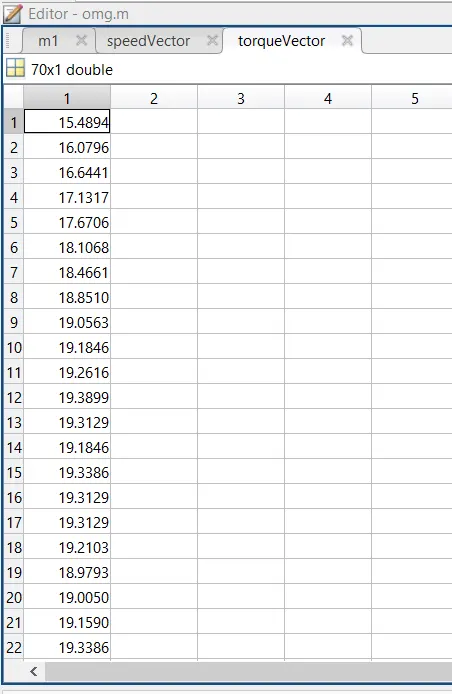
Fig 15: Torque value which needs to be extracted from gragh.
Let's look at the output which we are getting for inputs.
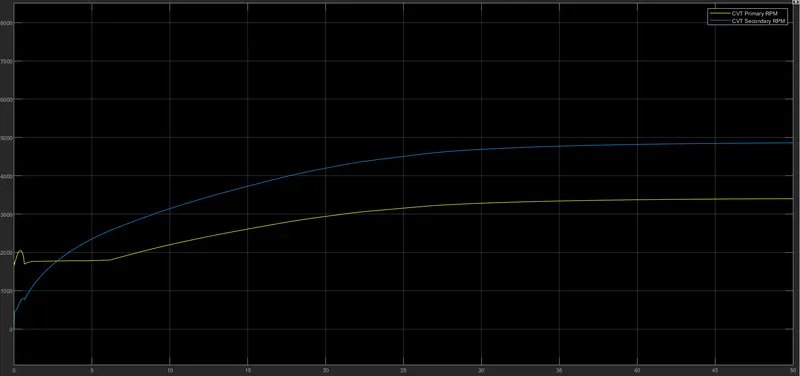
Fig16:Output of CVT with both primary and secondary gear.
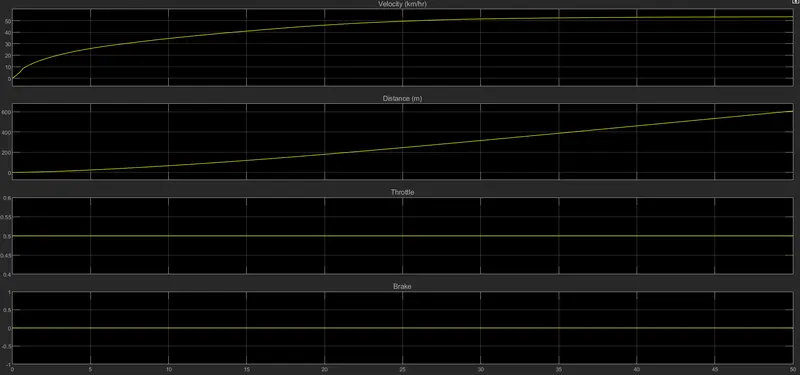
Fig 17:Output of the entire system
Various output for difference inputs
Case 1:-Throttle value 0.1 ,brake =0;
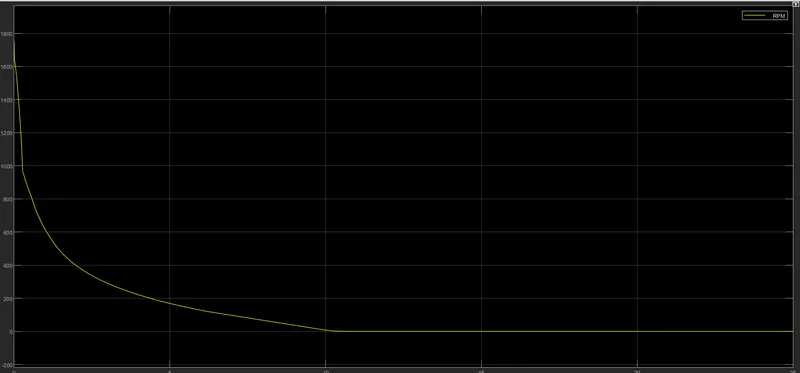
Fig 18:Engine RPM
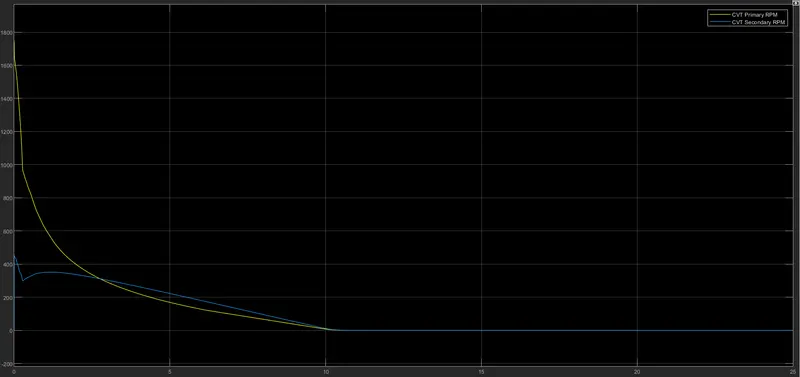
Fig 19:cvt shaft graph
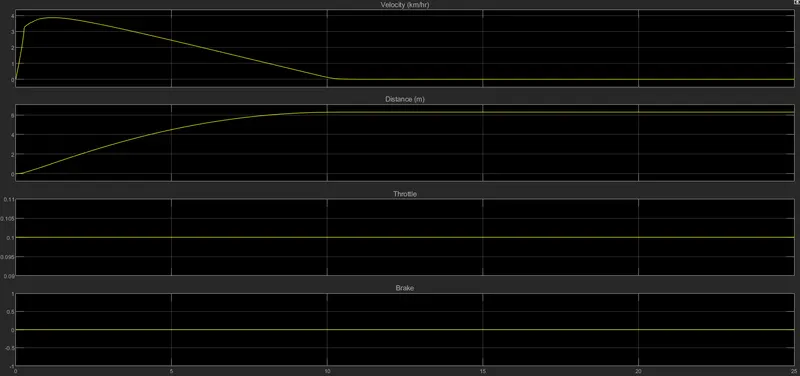
Fig20:Enitre output
Case 2:-Throttle value 0.4 ,brake =0;
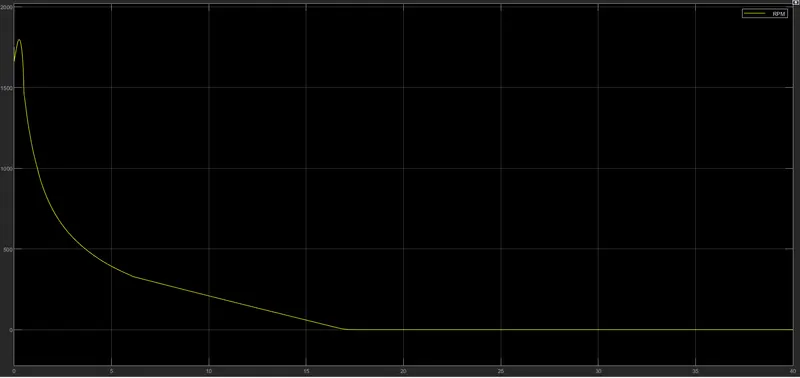
Fig 21:Engine rpm
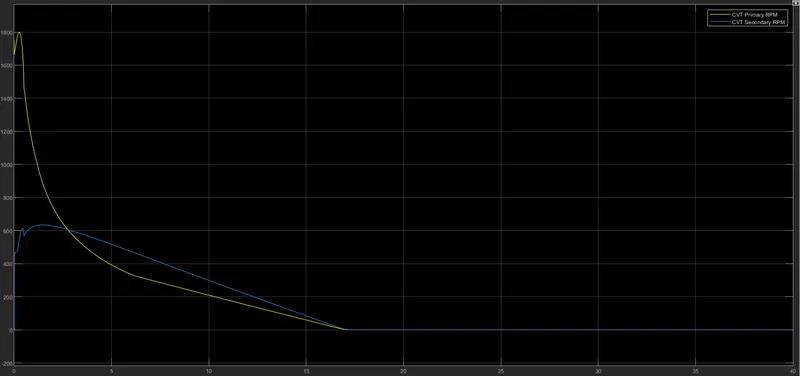
Fig 22:CVT shaft graph
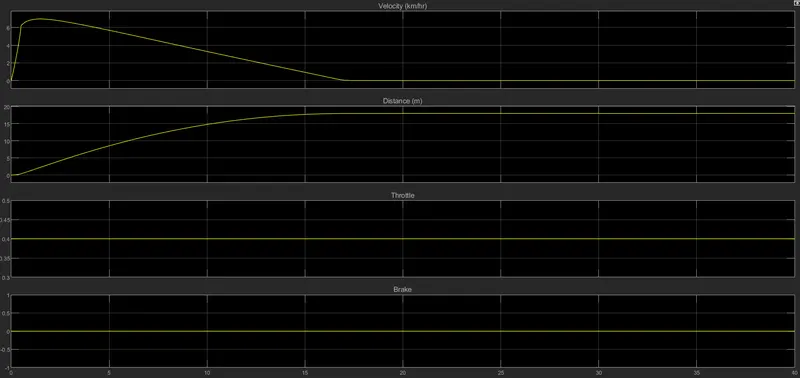
Fig 23:Output of system
Case 3:-Throttle value 0.8 ,brake =0;
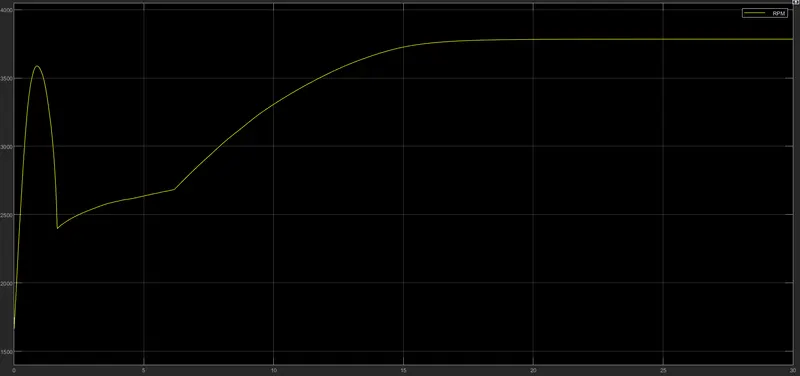
Fig 24:-Engine rpm
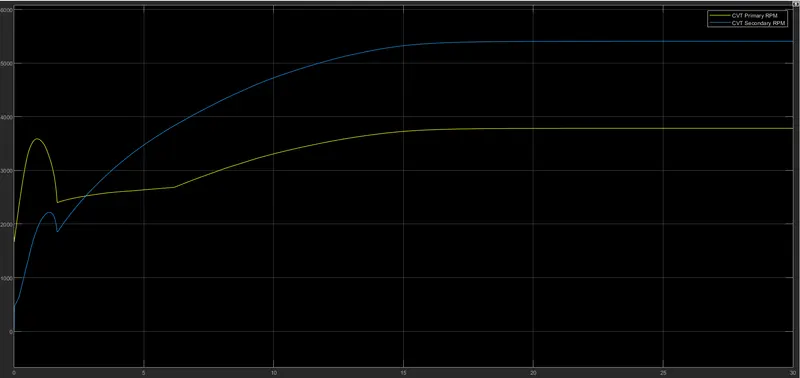
Fig 25:-CVT graph
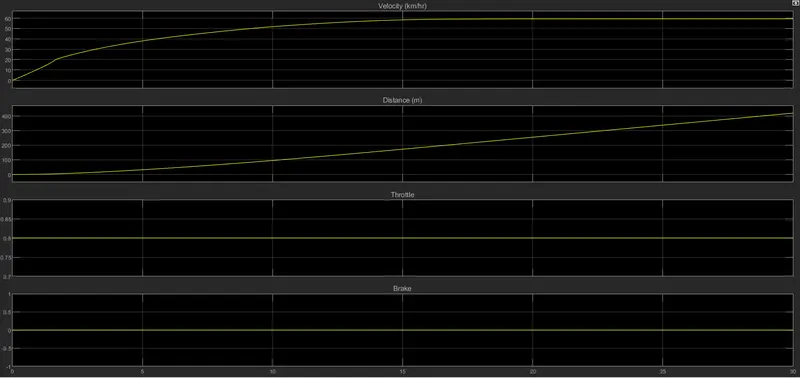
Fig 26:-Entire output
Case 4:-Throttle value =1 ,brake =0;
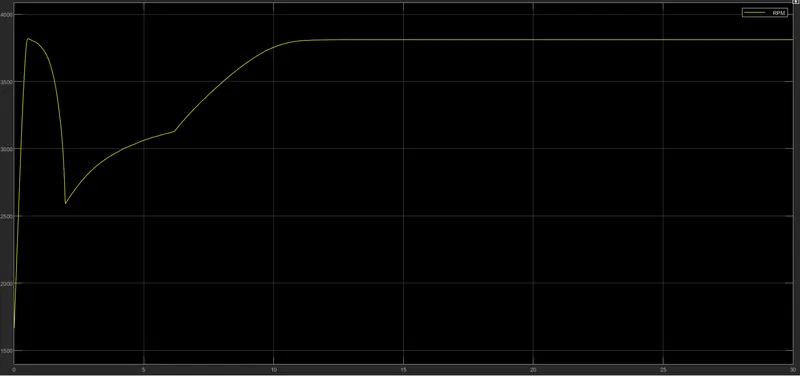
Fig27:-Engine RPM
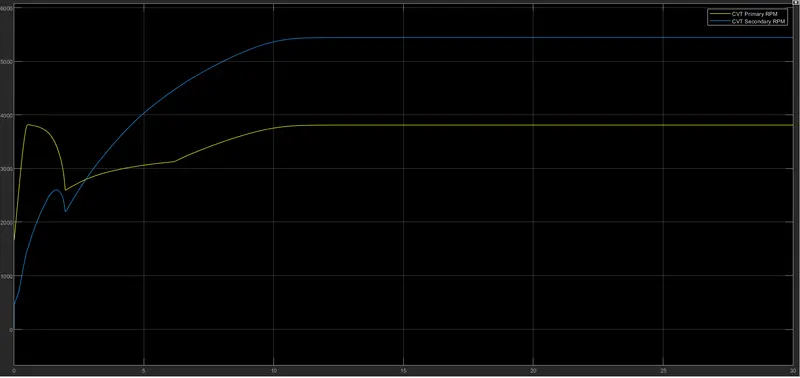
Fig28:-Cvt Graph
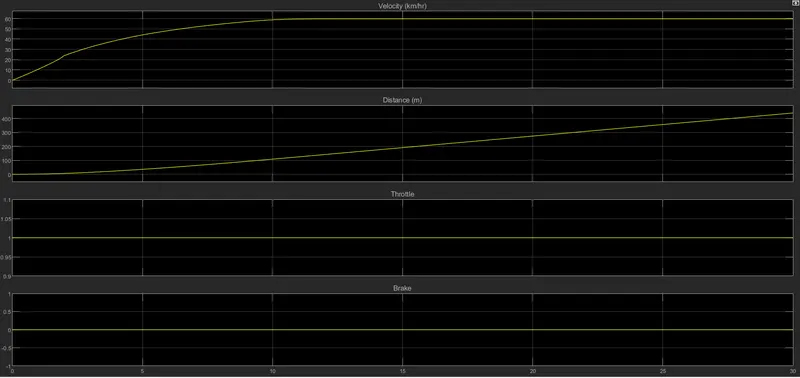
Fig29:Output of system
Case 5:-throttle value =1 ,brake =0.4;
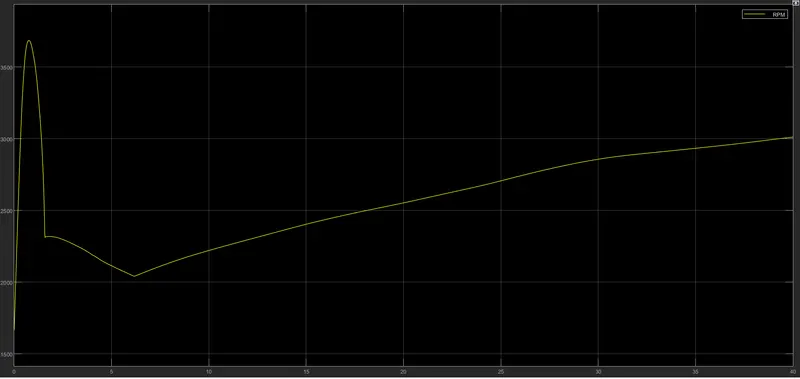
Fig30:Engine Rpm
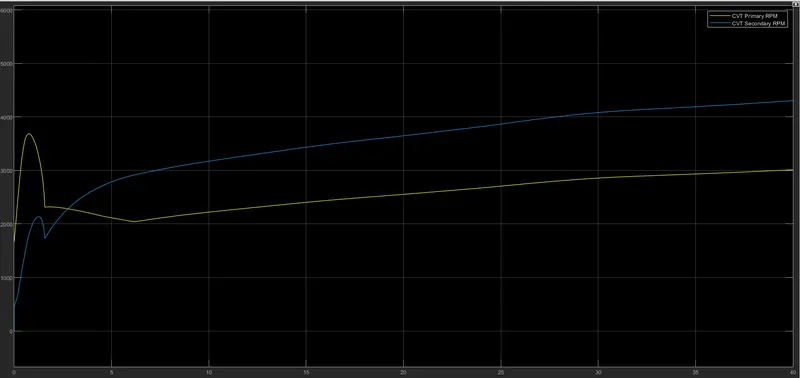
Fig31:CVT graph
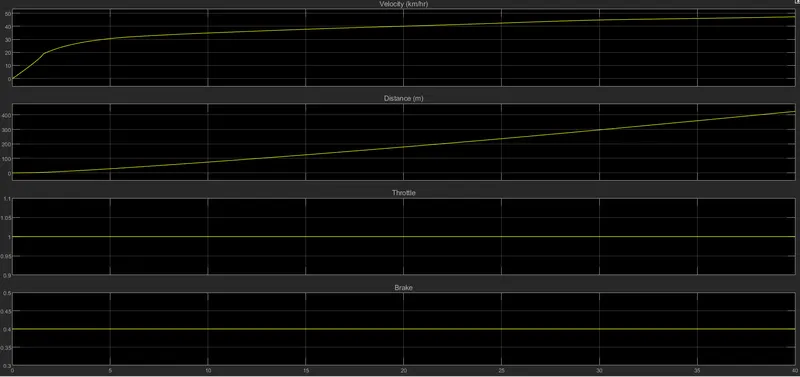
Fig 32:Entire output
Case 6:-Throttle value =1 ,brake =0.8;
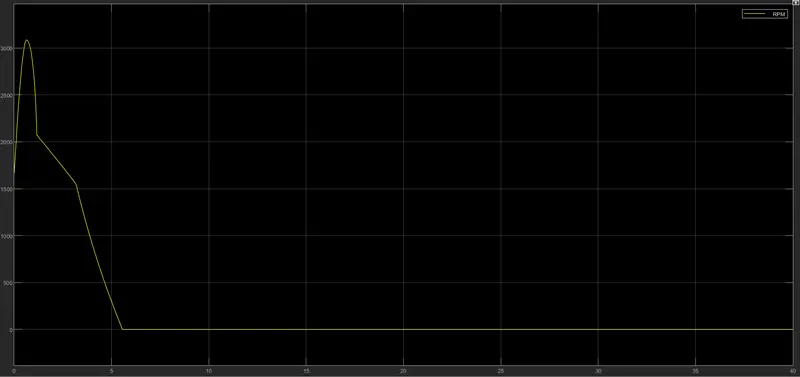
Fig33:Engine rpm
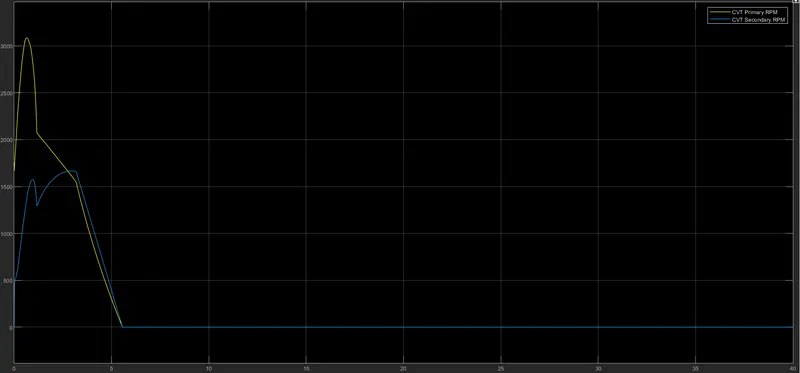
Fig 34:-Cvt Graph
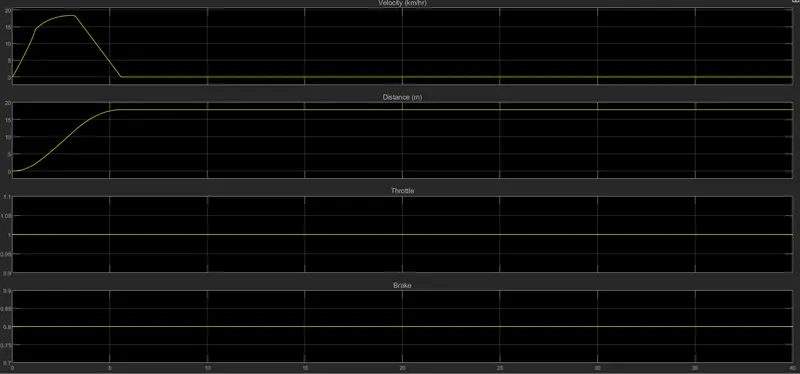
Fig 35:-Output graph
Case 7:-Throttle is 1 and braking is 1
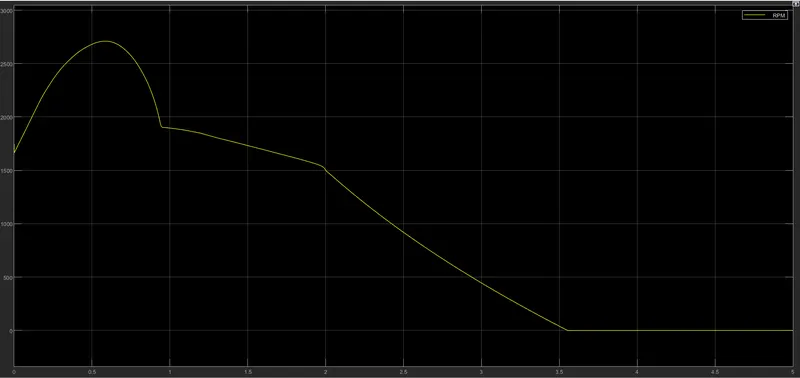
Fig36:engine rpm
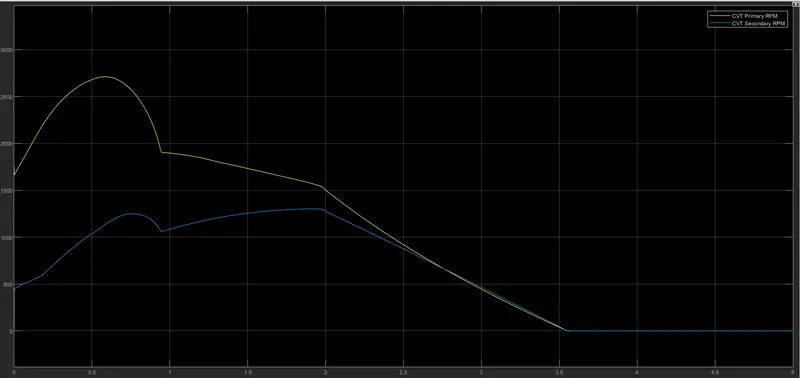
Fig37:Cvt graph
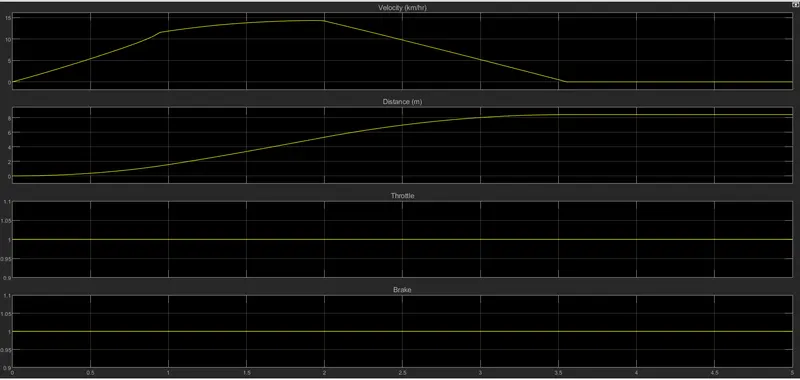
Fig 38:Output the entire system.
Conclusion
- The entire system and subsystem is analysed thoroughly
- Each function and model was expressed in detail used in the above example
- if you were giving throttle from 0 to 1 below observations are made:- That variation of rpm can be sen only for 10 seconds and that it is called as a transient state in electrical and after that state, it will reach constant term: and in CVT ration will rise for some extent that it will come to ad constant value, And it will show as a both were co-inside value: Velocity will vary only for 0 to 5 or 10 per cent will vary and it will reach a constant value; Usually distance will remain as your time will remain; Throttle is the same value as we give input and Brake will remain same.
- If you were giving both throttle and brake then this behaviour we can seen:-rpm will rise bt after 2 or 3 sec it will fall: And the same thing with CVT platform: Not much change but it will rise both in velocity and it will start to decreases .distance will same it will travel(Hyptocelliy).
- Entire AVT behaviour can be seen by looking at performance and all.