Project 2 Thermal modeling of battery pack
Aim:- it to evaluate the thermal behaviour of 10s 1 p cells pack used in the battery
Working model
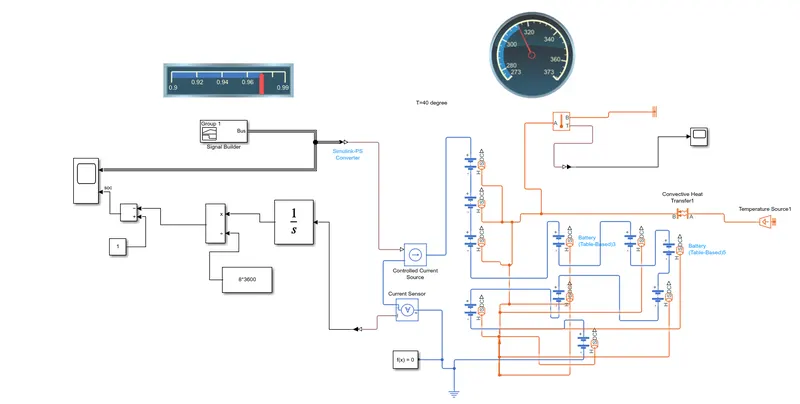
Fig1:-
now it had below sub-blocks and we are having these blocks
- Singal Builder
- Current controlled sources
- current sensor
- 10 number of cells
- a lot of go and to blocks
- A solver configuration
- integrator block
- Scope
Signal Builder
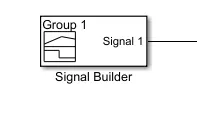
Fig2:-
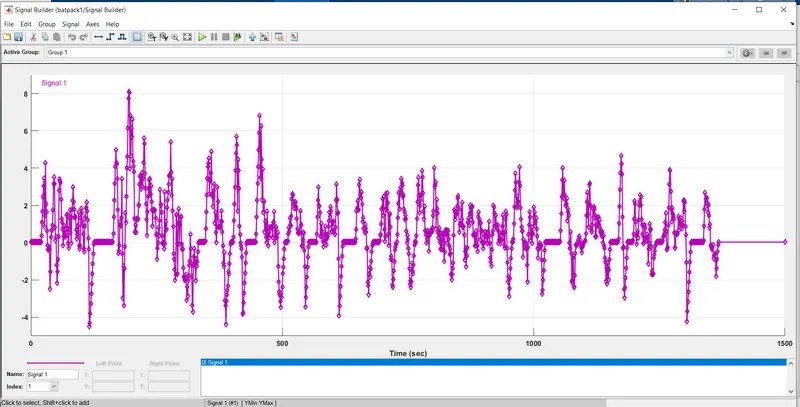
Fig3:-input graph
here we can able to give the input signal whichever we wanted and it could be shown as above here we can see the variation with respect to time
Controlled current sources
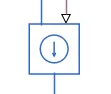
Fig4:-controlled Current sources
here we can get the output as we are giving input and it is completely dependent on the reference voltage which we are
Current sensor
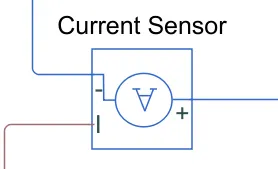
Fig4:-Current Sensor
here it will sense the current which is required to estimate the SOC
Cells

Fig5:-Cells in series
here it will play an important role and the cells will need to have an important role in any battery. And various parameter are shown below
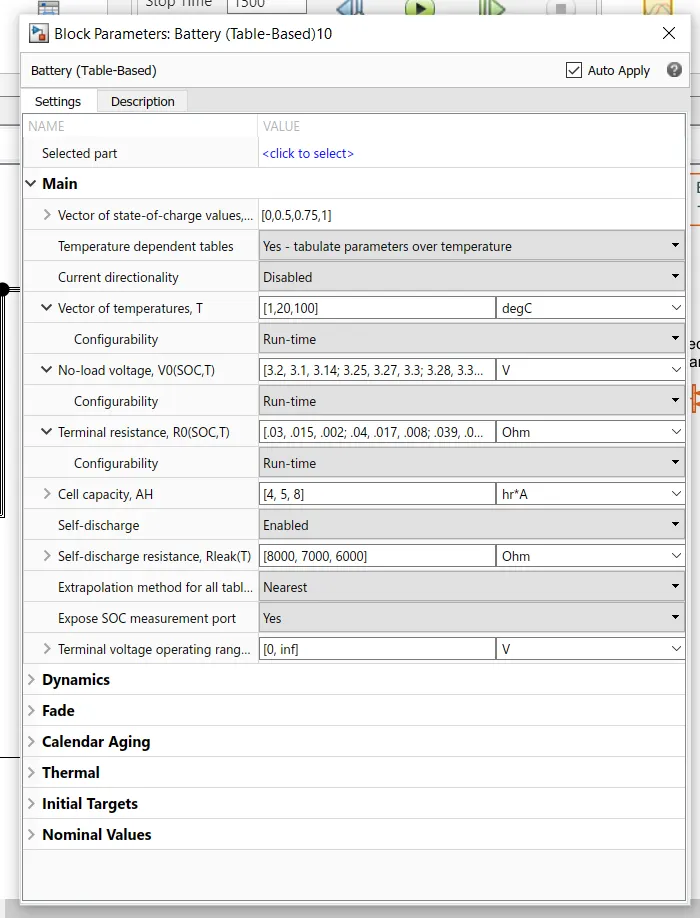
Fig6:-Cells configuration
here we can select the SOC OCV and Closed-cell voltage and all. Even we can give the Thermal ports as well
Temperature Sensor
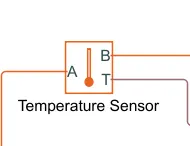
Fig7:-Temperature Sensor
this will sense the temperature and output will be given to other scope and all.
Heat transfer
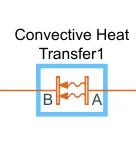
Fig8:-Heat Transfer
this will work on the principle of thermodynamics and we need to give the input as area and heat transfer coefficient
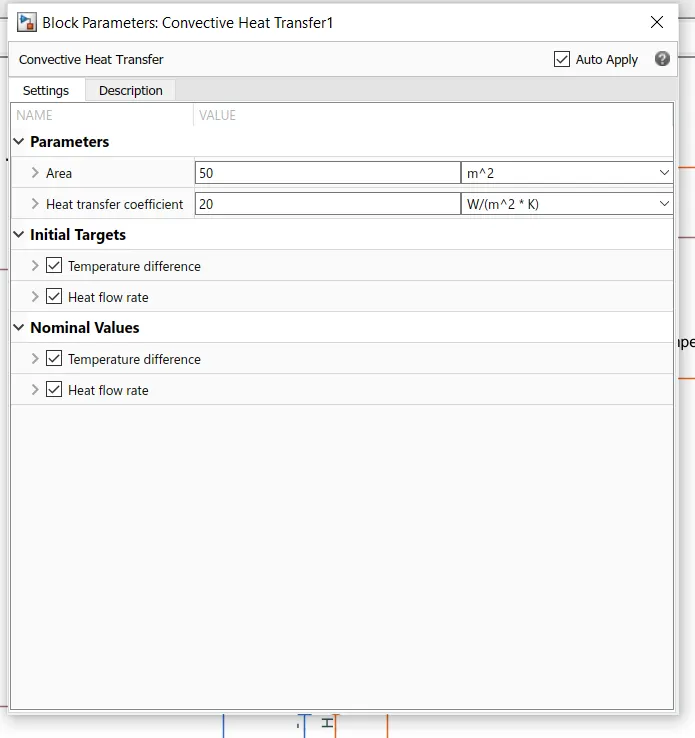
Fig9:-Heat Transfer coefficient
Temperature sources
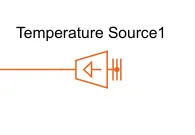
Fig10:-Temperature source
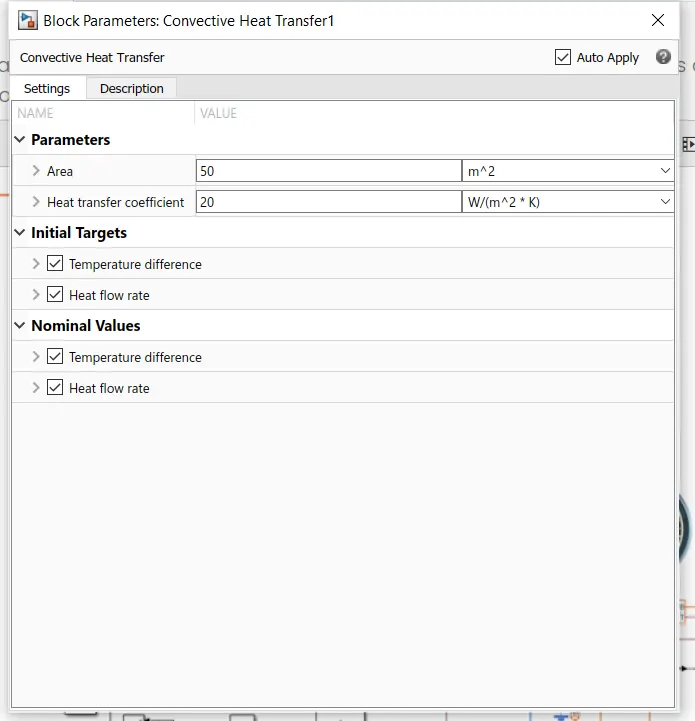
Fig11:-Temperature source configuration
Conductive Heat Transfer
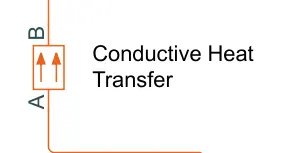
Fig11:-Conductive heat transfer
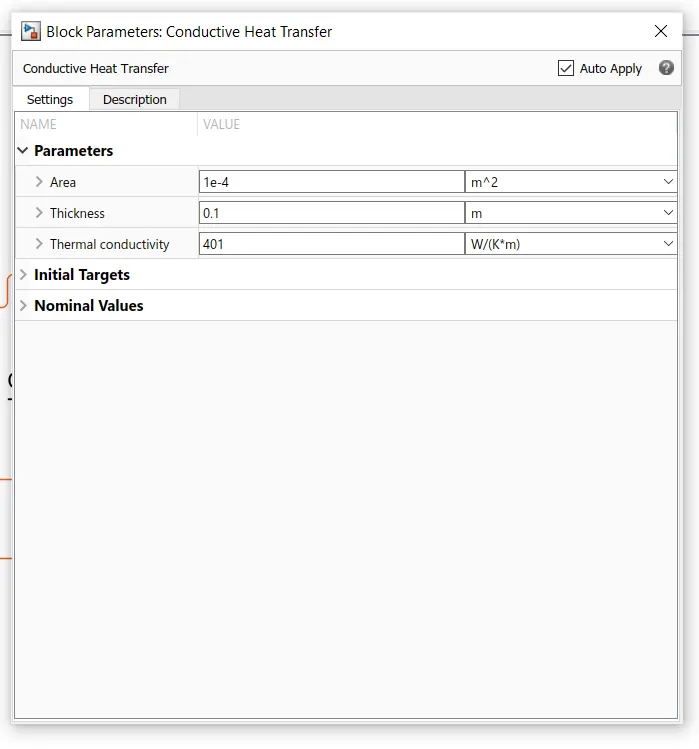
Fig12:-Conductive heat transfer configuration
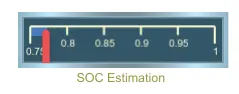
Fig13:-SOC Estimation meter
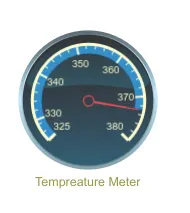
The fig14:-Temperature meter of the battery pack
Result Analysis
Fig15:-model of the battery pack
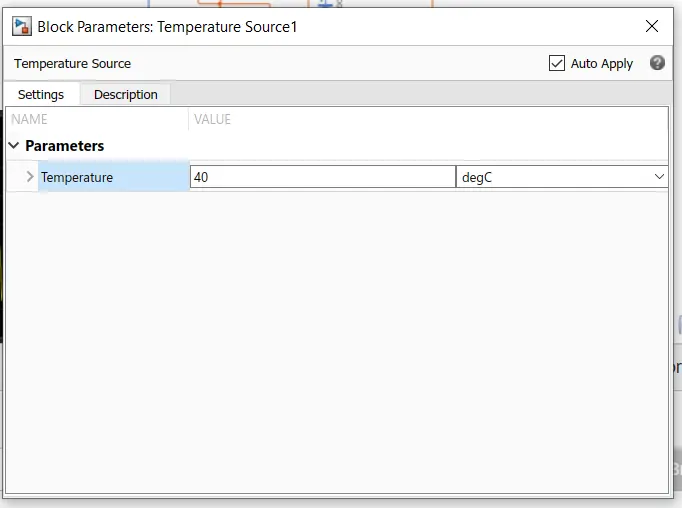
Fig16:-Temperature of heat Sources
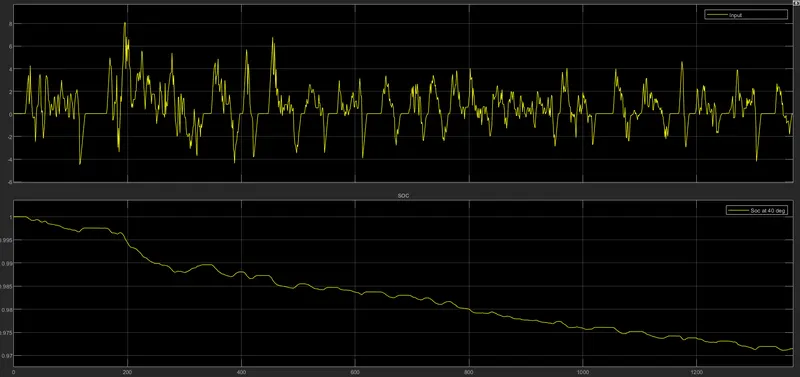
Fig17:-input waveform and soc
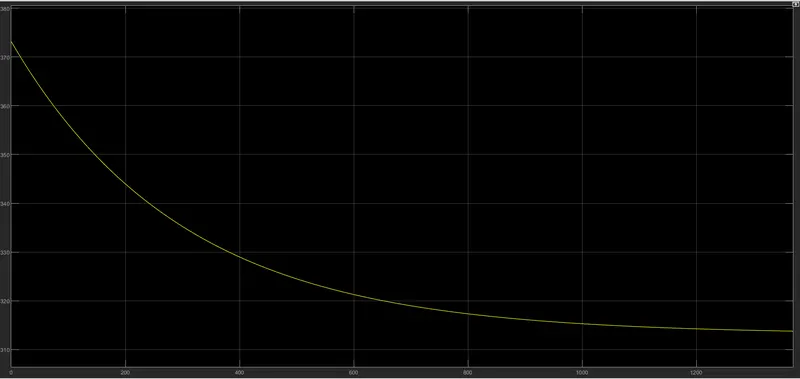
Fig18:-Temperature of the battery pack
| Sl no | Name of parameter | quantity |
| 1 | simulation time | 1500 second |
| 2 | temperature | 40 `circ` |
| 3 | Maximum temperature | 375 kelvin |
| 4 | soc end | 0.97 |
we can see that the team will decrease as per parabolic and the soc will be decreasing in the form of a straight line.
we can confirm that the variation will be clear and is as explained above.
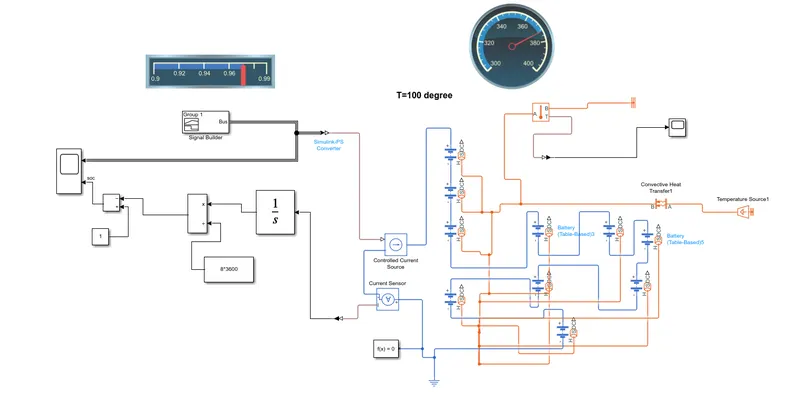
Fig19:-model of the battery pack
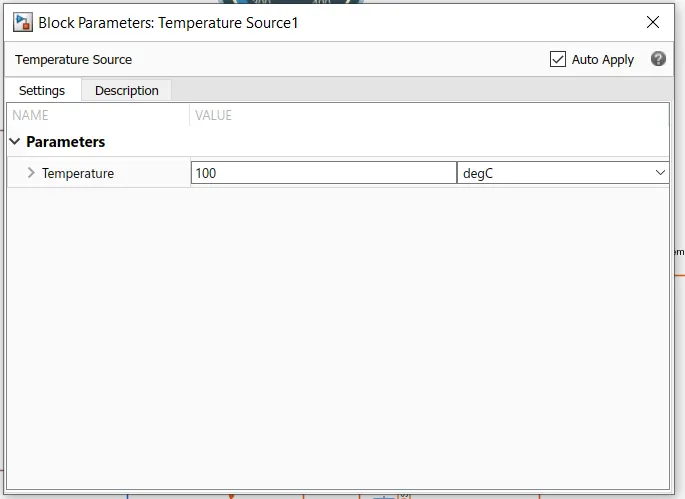
Fig20:-Temperature of heat Sources
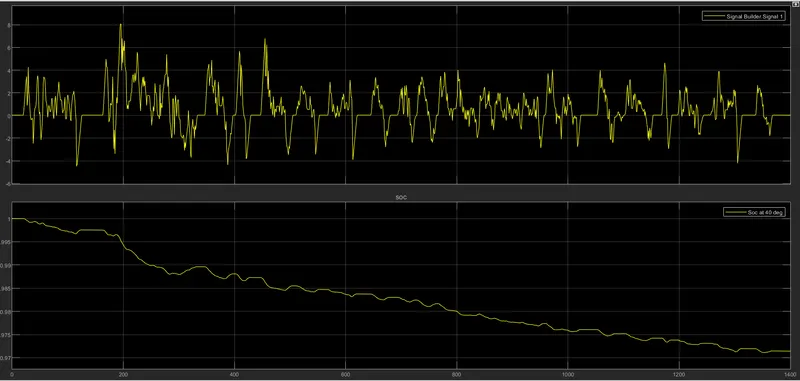
Fig21:-input waveform and soc
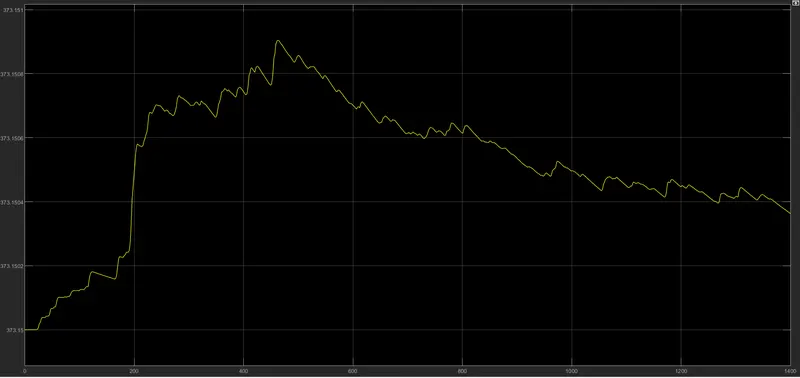
Fig22:-Temperature of the battery pack
| Sl no | Name of parameter | quantity |
| 1 | simulation time | 1500 second |
| 2 | temperature | 100 `circ` |
| 3 | Maximum temperature | 373 kelvin |
| 4 | soc end | 0.95 |
we can see that the team will increase and decrease as per parabolic and the soc will be decreasing in the form of a straight line.
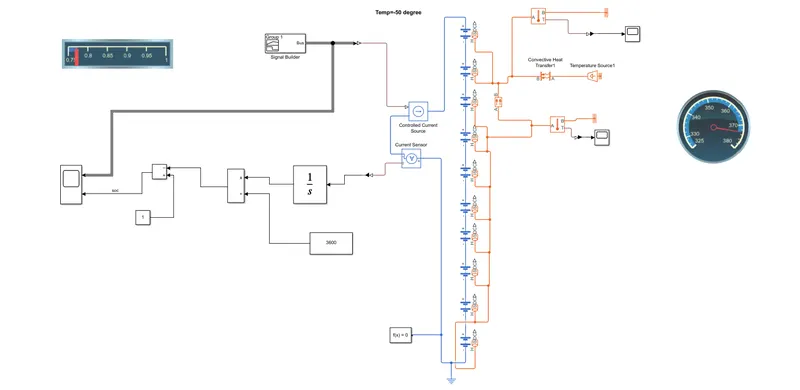
Fig23:-model of the battery pack
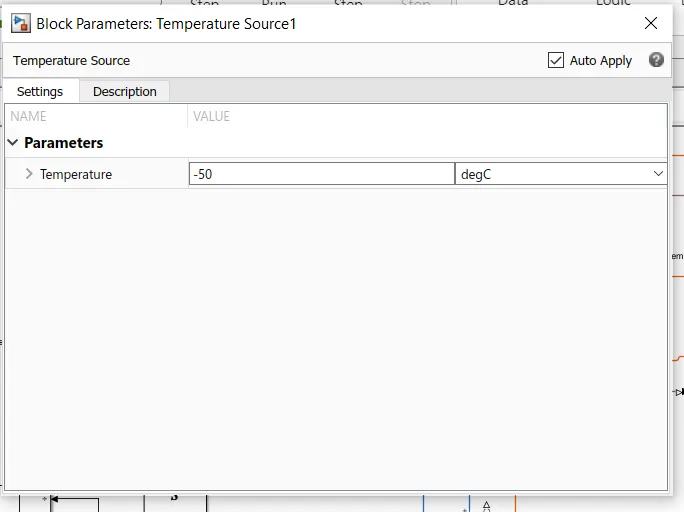
Fig24:-Temperature of heat Sources
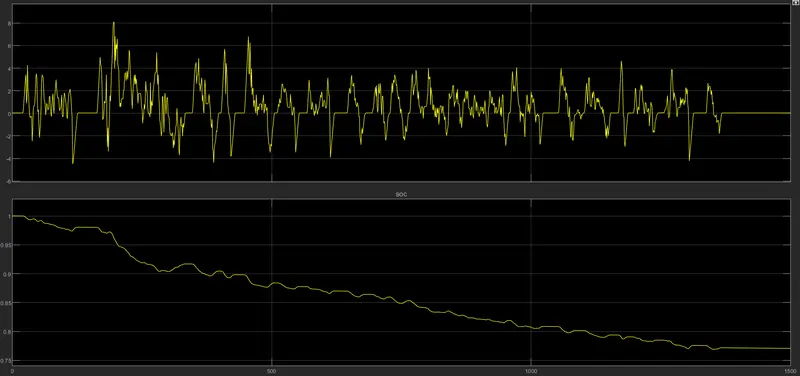
Fig25:-input waveform and soc
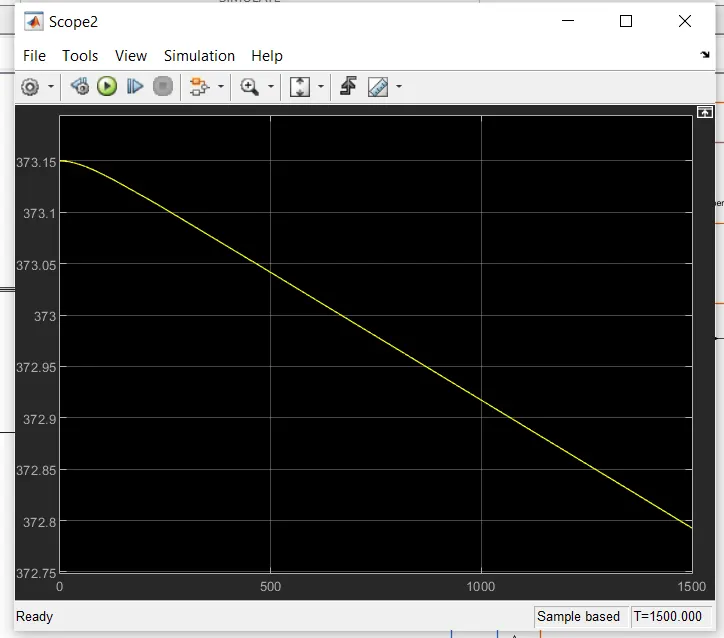
Fig26:-Temperature of the battery pack
| Sl no | Name of parameter | quantity |
| 1 | simulation time | 1500 second |
| 2 | temperature | -50 `circ` |
| 3 | Maximum temperature | 373.15 kelvin |
| 4 | soc end | 0.75 |
we can see that the team will decrease as per parabolic and the soc will be decreasing in the form of a straight line.
we can confirm that the variation will be clear and is as explained above.
From the above, we conclude that external temperature matters a lot to SOC and it won't matter much for the temperature of the battery pack.