Week-4 Challenge WOT Condition Part-2
Q1:-What is the difference between mapped and dynamic model of engine, motor and generator? How can you change model type?
- Mapped model of engine :-It is a default engine in the powertrain blocks. And it works on a lookup table which was taken by Simulink. And it is not accurate as a dynamic model. lookup tables are usually data that includes torque, brake torque, engine speed. And some other values that were extracted from the lookup table are airflow, gradient, fuel flow and emission.
- Dynamic model of the engine:-this type of data uses user enter data at the time of modelling. This model is more accurate and an engine model. This will use the data that is present in the subsystem.We can calculate the values such as fuel input and all.
- Mapped model of motor:-This will work in constant torque mode .this mode will give output compared faster .output is compared with input and difference will be given. All parameters we need to give as input and output can be extracted.
- Dynamic model of the motor:-this is usually a three-phase permanent magnet induction motor. And we need to give the input such as voltage and phase difference. The output will be in form of torque . This is more accurate.
- Mapped model of Generator:-this is a model work on input mechanical force and output will be on electrical voltage. This will work on the lookup table. This model is less accurate.
- Dynamic model of Generator:-similar to the above one, But this will involve manual entering of variables and get output. this will be more accurate.
changing the model from dynamic model to mapped model or visa versa
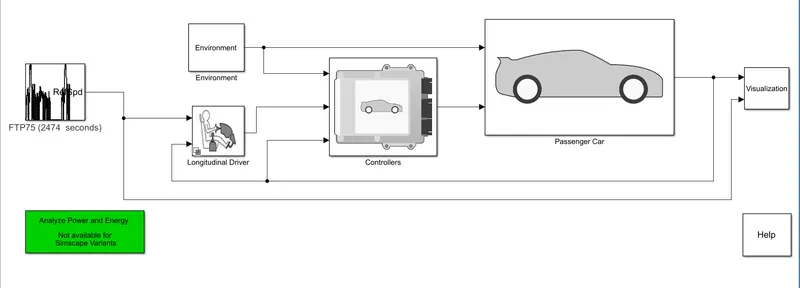
Fig1:-model in HEV
open passenger car subsystem and in that open electric plant
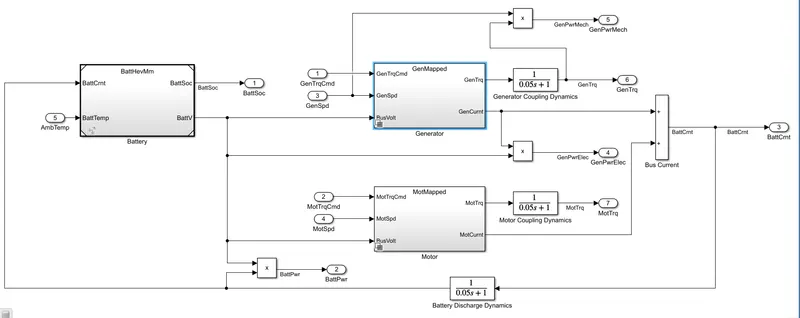
Fig2:-Electric model of passenger car system
now open generator and will be shown like this
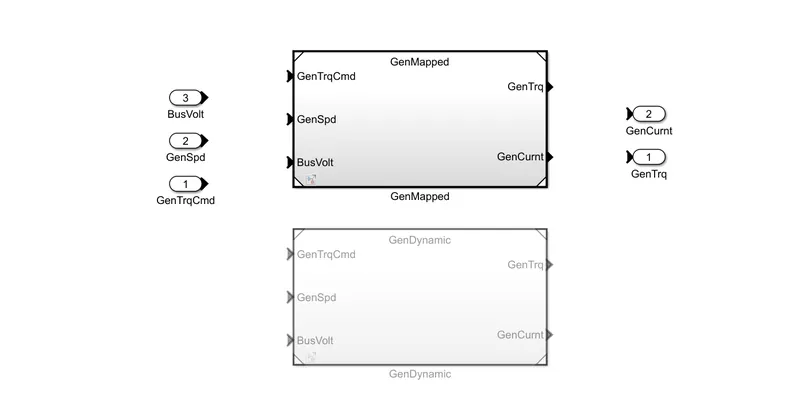
Fig 3:-Fig of an inside view of generator
now here we are getting 2 options going with mapped or with going with the dynamic we can select whichever you want.
Q2:How does the model calculate miles per gallon? Which factors are considered to model fuel flow?
Miles Per Gallon equivalent MPGe definition:-A measure of average distance travelled per unit
of energy consumed usually, it's used in united states of America. It is used to compare the energy consumption
of alternative fuel vehicles, plug-in electric vehicles and other advanced technology vehicles with the fuel economy of conventional ICE vehicles
MPGe represents the number of miles a vehicle can travel using a quantity of “ actually electricity with the same energy content as one gallon of gasoline 1 Gallon of Gasoline 33 7 kWh of energy or 1 gallon of petrol will contain 3.78 litres .
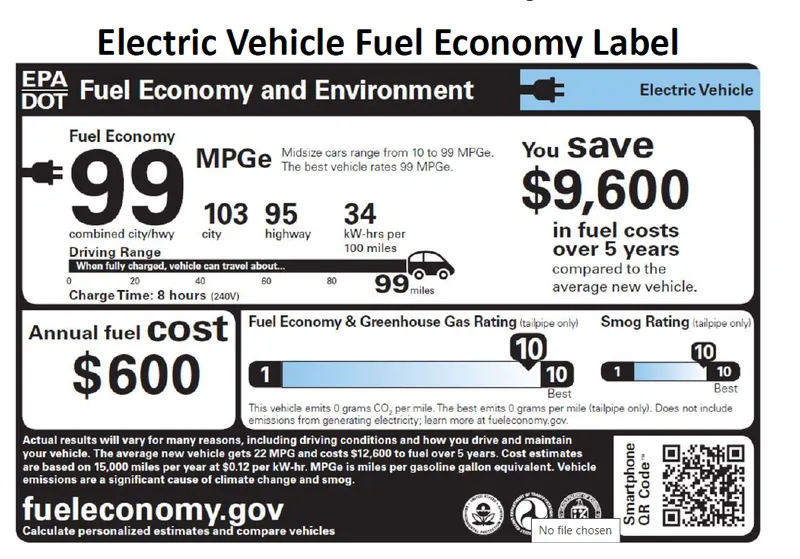
Fig 4:-Fuel economy of the model car.
1 Mpge=((total miles driven)*(energy of 1 galleon))/(total energy all fuel consumed)
factors which it depends on are
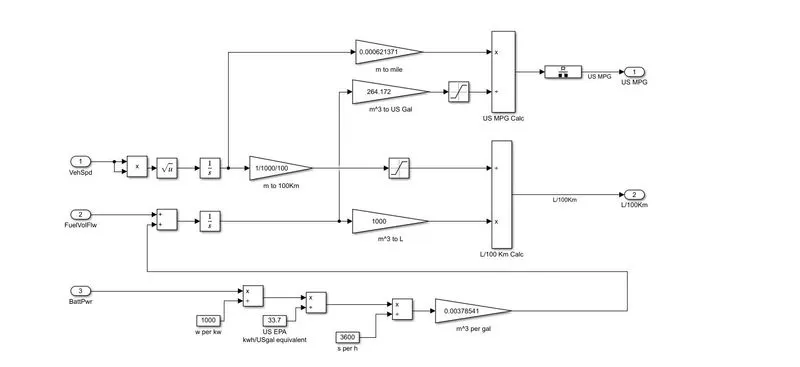
Fig 5:-factors which will matter for Mgpe
The factors which are considered are :-
- vehicle speed
- fuel inlet value
- battery power will matter
it will go in this process
we need to input the speed this it will take care and square root then it will convert it to m to a mile then it will giveout to US Mpge.
Q3:Run the HEV ReferenceApplication with WOT drive cycle. Change the grade and wind velocity in the environment block. Comment on the results.
now we need to open the model in Simulink and the model is as shown below
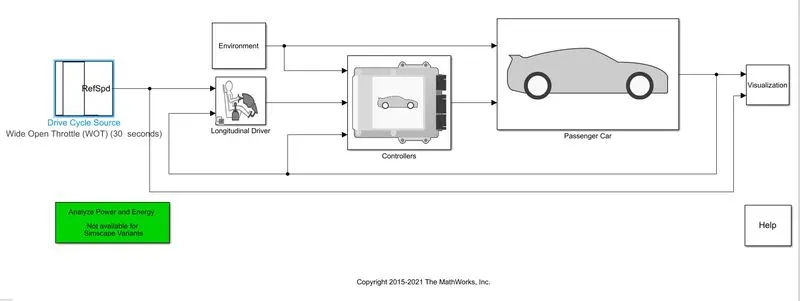
Fig 6:-model for HEV
and in question it has been given that the drive cycle must be of WOT so changing that we need to open the drive cycle and is shown below in Fig 7
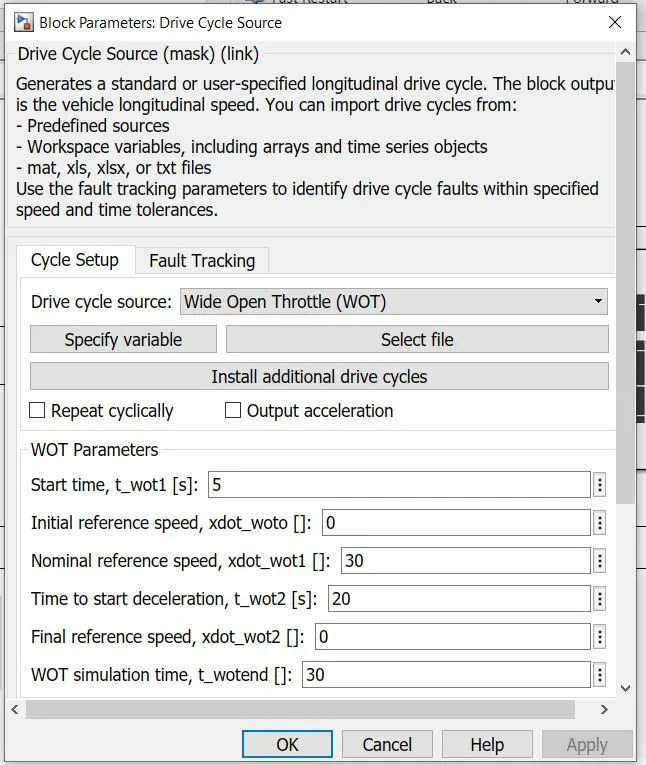
Fig7:-Wot throttle
we had simulated it for 100 seconds and the output is as shown below.
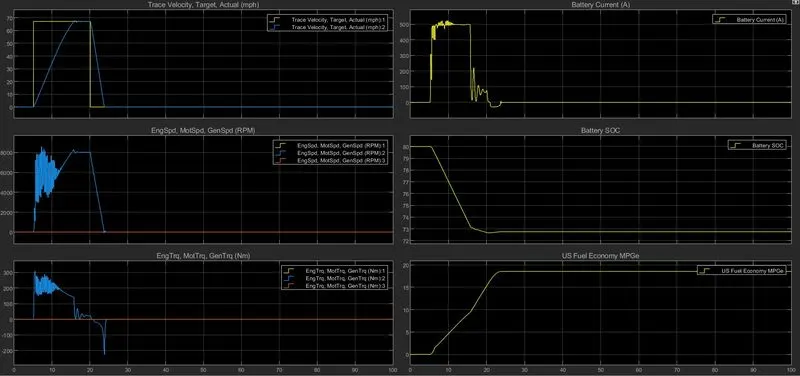
Fig 8:-Output of hybrid with 100 second
below are the graphs
- Velocity v/s Speed:- this graph will tell us the velocity With respect to seed. it has 2 options 1 is Traced velocity and is the actual velocity of the vehicle is shown in the yellow line. The actual velocity is shown in the blue line.
- Battery current:-it is the current which is drawn out from the battery.
- Engine, motor, generator speed:-engine speed is shown in yellow: motor speed in blue:Generator speed in orange colour.
- Battery soc:-it is shown in yellow colour.it decreases uniformly.
- Engine, motor, generator torque:-engine torque is shown in yellow: motor torque in blue: Generator torque in orange colour.
- Us MPGe:-This starts from zero and continue in some value.
now here we need to change some parameters and the below image will show that
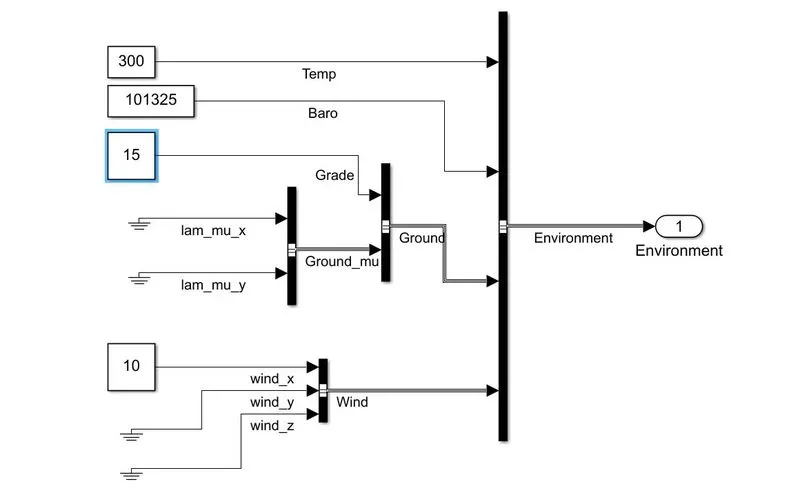
Fig 10:Changes in environmental block (grade is 15 degrees and wind in 10 m/s)
now the output is shown below
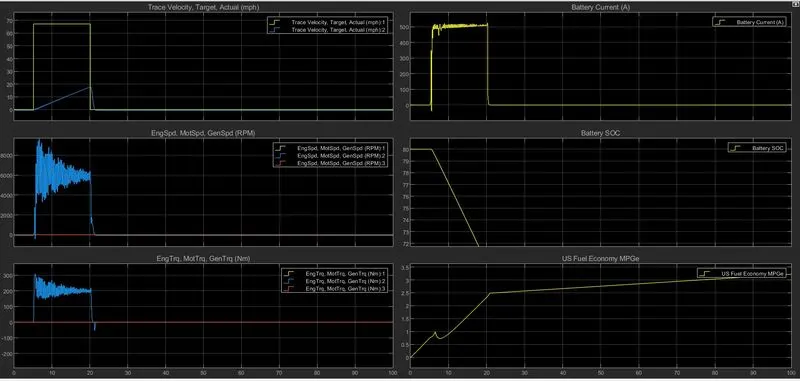
Fig 11:-Output of hybrid with some environmental changes @100 second
- Velocity v/s Speed:- this graph will tell us the velocity With respect to seed. it has 2 options 1 is Traced velocity and is the actual velocity of the vehicle deduced .this may be the effect of gradient and wind speed is shown in the yellow line. The actual velocity is shown in the blue line.
- Battery current:-it is the current which is drawn out from the battery.
- Engine, motor, generator speed:-engine speed is shown in yellow: motor speed in blue: Generator speed in orange colour.
- Battery soc:-it is shown in yellow colour.it decreases uniformly.
- Engine, motor, generator torque:-engine torque is shown in yellow: motor torque in blue: Generator torque in orange colour.
- Us MPGe:-This starts from zero and the behaviour is not the same it will increase but with 2 different slopes and all.
Q4:-Keeping all other parameters the same, compare the simulated results of hybrid and pure electric powertrains.
consider below images for HEV block
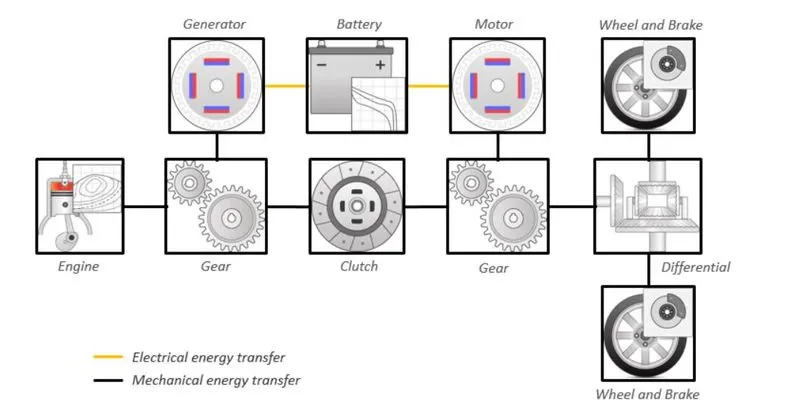
Fig12:-Block diagram of hybrid electric vehicle
Fig13:-Model of Hybrid electric vehicle
Fig14:Output of HEV
Now consider Electric Vehicle
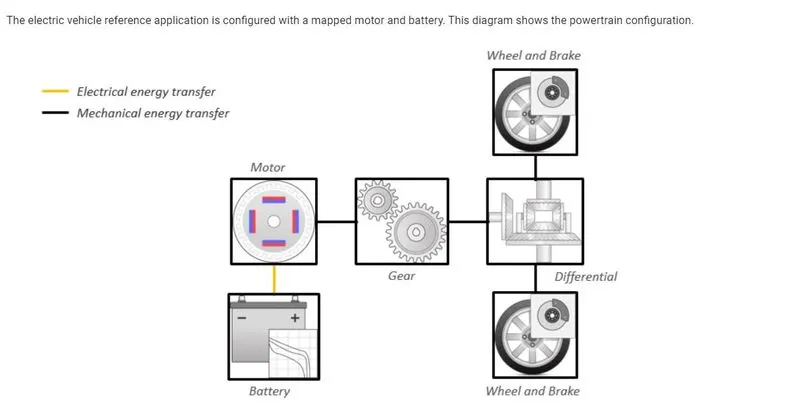
Fig15:-Block diagram of Electric vehicle
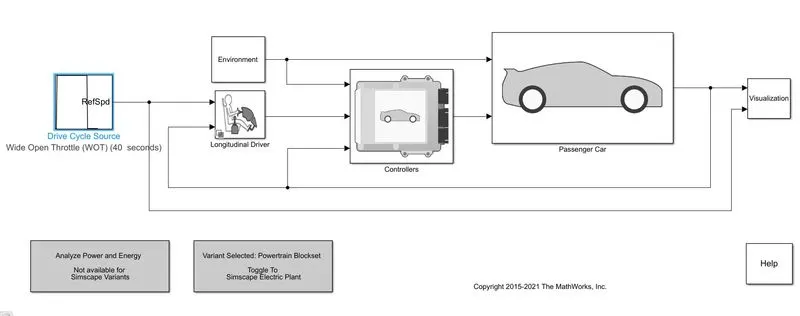
Fig16:-Model of Electric vehicle
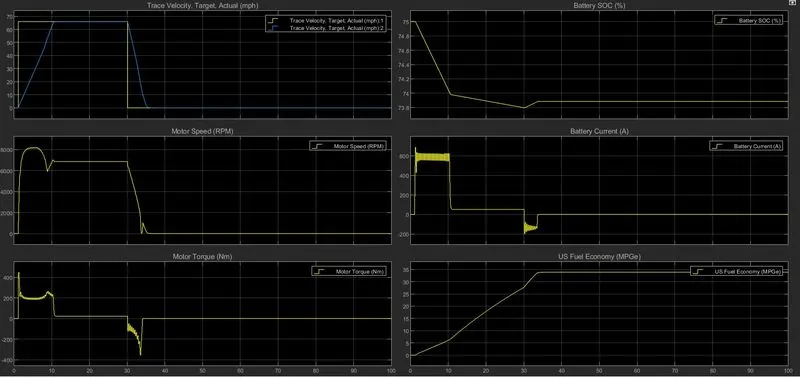
Fig17:Output of EV
Now look at the differences below the table
| SL no | Name of parameter | Hev | Ev |
| 1 | Velocity v/s Speed | it will travel a smaller distance | here it will travel at great speed |
| 2 | Battery current | it will consume lesser current. Because it got both fuel and electricity | here it will consume more current |
| 3 | Engine, motor, generator speed | the engine will rev at a greater speed | engine will rev at a small speed |
| 4 | Battery Soc | This will consume more battery | this will consume less SOC |
| 5 | Engine,motor,generator Torque | here torque will be lesser | torque will be more for EV |
| 6 | US fuel economy | here fuel economy will be more it has got 2 fuels | Here fuel economy is less and it has only 1 source of energy |
Conclusion:-
- Different types of engines, generators, motors are understood. How to change between them is also understood.
- How to calculate miles per gallon is understood and various parameters affecting them are also known.
- HEW operation parameters are known and results were analyzed, And the effect of gradient and wind velocity are also analyzed.
- the difference between EV and HEV were analyzed by considering their operating parameters.